Introduction
In eukaryotes, synteny analysis is really the investigation of how chromosomes, or large sections of chromosomes evolve over time. To investigate this, scientists compare the order and orientation of either genes or DNA sequences between homologous chromosomes from two or more species (syntenic blocks). Genes within a syntenic region may have similar functional constraints or regulatory regimes that function best when they are kept together. In the lab, flies exhibit chromosomal changes such as duplications, deletions, and inversions, particularly when exposed to mutagens such as x-rays; the question is what kinds of changes happen in the wild, and at what rate? Analysis of such changes gives us information about what changes can be tolerated and provides insights into speciation.
To search for chromosome changes that occurred over the course of fruit fly evolution, you can compare the order and orientation of the genes in your project with the order and orientation of the orthologous genes in Drosophila melanogaster. There are three basic steps to the process:
1. Determine orthologs
If you are going to decide how genes change order or orientation you first need to make sure you are looking at orthologous genes in each species. If you have assigned orthology during annotation you can use that assignment. If not, you will need to do cross-species BLAST searches.
2. Assess position
Once you have the orthology assigned, use your favorite genome browser (e.g., the GEP UCSC Genome Browser, JBrowse on FlyBase) to find the position and orientation of each gene in your project.
3. Comparing the gene order and relative gene orientation
The gene order and orientation in each species can now be compared. For Drosophila melanogaster, each chromosome arm has an agreed upon orientation with respect to its centromere. In general, the orientations of the scaffolds in the genome assemblies of other Drosophila species are arbitrary (i.e., determined by the output of the genome assembler). However, some sequencing projects (e.g., the F Element Expansion project) use additional experimental data (e.g., Hi-C data) to determine the order and orientations of the scaffolds so that they are consistent with the convention used by D. melanogaster.
As a scientist it is important when communicating your results to keep things simple and avoid unnecessary complications. Thus, when comparing the gene order, you may find that reverse complementing your project may result in a simpler result. For example, consider two sets of genes:
-
Orientation of Project genes are: a →, b →, c ←, and d →.
-
Orientation of genes in D. melanogaster are: d ←, c →, b →, and a ←.
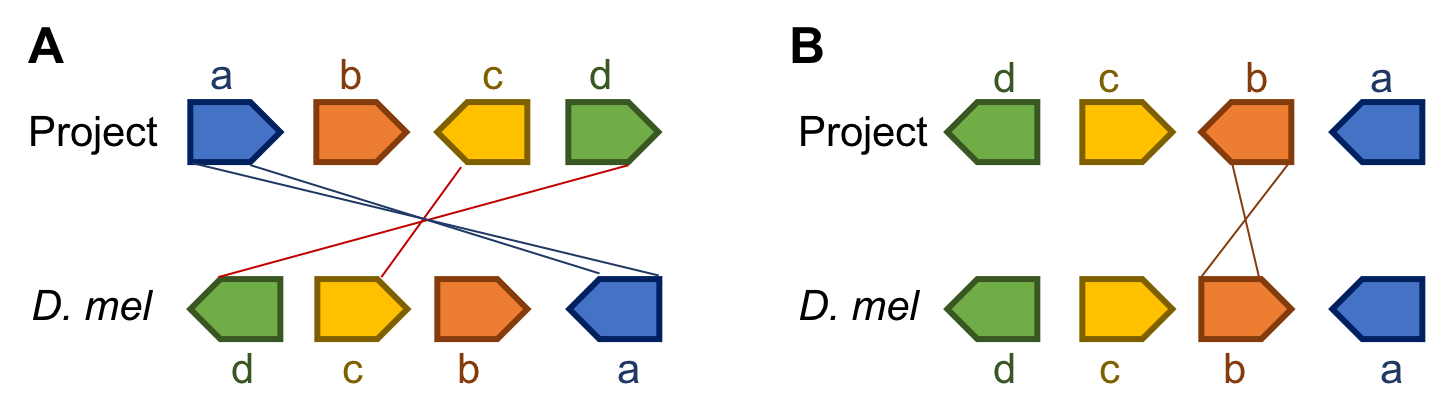
As you can see in the figure above, if you simply align the two sequences and note changes in order and orientation you get figure A. However, if you flip the project before you create the figure, you get figure B. Unless the orientation of the scaffolds are supported by experimental evidence (e.g., Hi-C data), we have no way of knowing the orientation of the project. Hence figure B would be preferable because it requires fewer changes.
Another way to think about this is to only consider the relative orientation of the genes when evaluating synteny using your project. In our example, we see that three of the four genes are in the same relative orientation while only gene b changes (going from pointing away from a to pointing toward a).
Please note in your report whether your project is syntenic with D. melanogaster, and if not, what minimal number of events would be needed to create the observed gene order. In our example only one event, an inversion containing only gene b, is needed to explain the differences between the two species. Such an inversion requires breakpoints at each side of gene b. For any region where your model predicts a breakpoint, you should also look for and note the evidence which indicates where the break might have occurred. These could be indicated by the presence of discontinuities in the alignment net track in the GEP UCSC Genome Browser or the presence of other conspicuous features (e.g. repeats). Occasionally (about 5–10%) of the time you will find evidence that a gene on a given chromosome in one species is on a different chromosome in another species; we are referring to these as “wanderer” genes.