Prerequisite
-
Annotation of Drosophila (presentation)
Resources
Files for this Tutorial
The exercise package is available on the GEP website under Curriculum → Transcription Start Sites → Annotation of Transcription Start Sites in Drosophila
Introduction
Despite residing in a domain with high repeat density, Drosophila melanogaster Muller F element genes are expressed over the same quantitative range as euchromatic genes [Riddle et al., 2012]. Comparing the types and distributions of motifs near the transcription start sites (TSS) of Muller F and D element genes could help elucidate the factors that enable Muller F element genes to function in a heterochromatic domain.
The first step of the motif analysis is to produce high quality annotations of the TSS in order to define the regions to search for conserved motifs. Comparative annotation of the TSS is more challenging than the annotation of coding regions because the 5' and 3' untranslated regions (UTR) evolve more quickly than the coding region and there is less external evidence available to support the annotations. For example, most gene finders only predict coding regions and the RNA-Seq read coverage data generally do not provide sufficient evidence to infer the precise location of the TSS. Consequently, the annotation of the TSS has a higher degree of uncertainty compared to annotation of the coding regions. In some cases, we might only be able to define a genomic region where the TSS could be found. This walkthrough will illustrate some of the challenges associated with the annotation of the TSS using the putative orthologs of onecut and Eph on the D. biarmipes Muller F element project contig35 [Aug. 2013 (GEP/Dot) assembly].
Annotating the TSS of the D. biarmipes onecut ortholog
Determine the shape of the core promoter of onecut
While most studies on core promoters have focused on genes that have a single TSS (i.e., peaked promoters), there is another class of core promoters where multiple TSS are distributed within a 50–100bp region (i.e., broad promoters) [Juven-Gershon and Kadonaga, 2010]. A previous study by the modENCODE project has shown that the distribution of TSS within the core promoters of D. melanogaster genes is actually a continuum, and that only ~20%–30% of the D. melanogaster genes have peaked promoters. Genes with peaked promoters tend to be expressed only at specific developmental time points or tissues, while genes with broad promoters tend to be constitutively expressed. Peaked promoters are enriched in some of the core promoter motifs (e.g., Inr, TATA boxes, DPE) compared to the broad promoters [Hoskins et al., 2011]. Different isoforms of the same gene could have different types of core promoters.
Similar to the GEP annotation strategy for coding regions, the comparative annotation of TSS in D. biarmipes aims to minimize the number of changes compared to the orthologous model in D. melanogaster. Hence the first step of our analysis is to determine the type of promoter that is found in the onecut gene in D. melanogaster.
We will use the resources produced by modENCODE and other projects in order to classify the core promoter of onecut in D. melanogaster. Because some of these resources are not available on FlyBase, we will examine the genomic regions surrounding the onecut gene using the GEP UCSC Genome Browser.
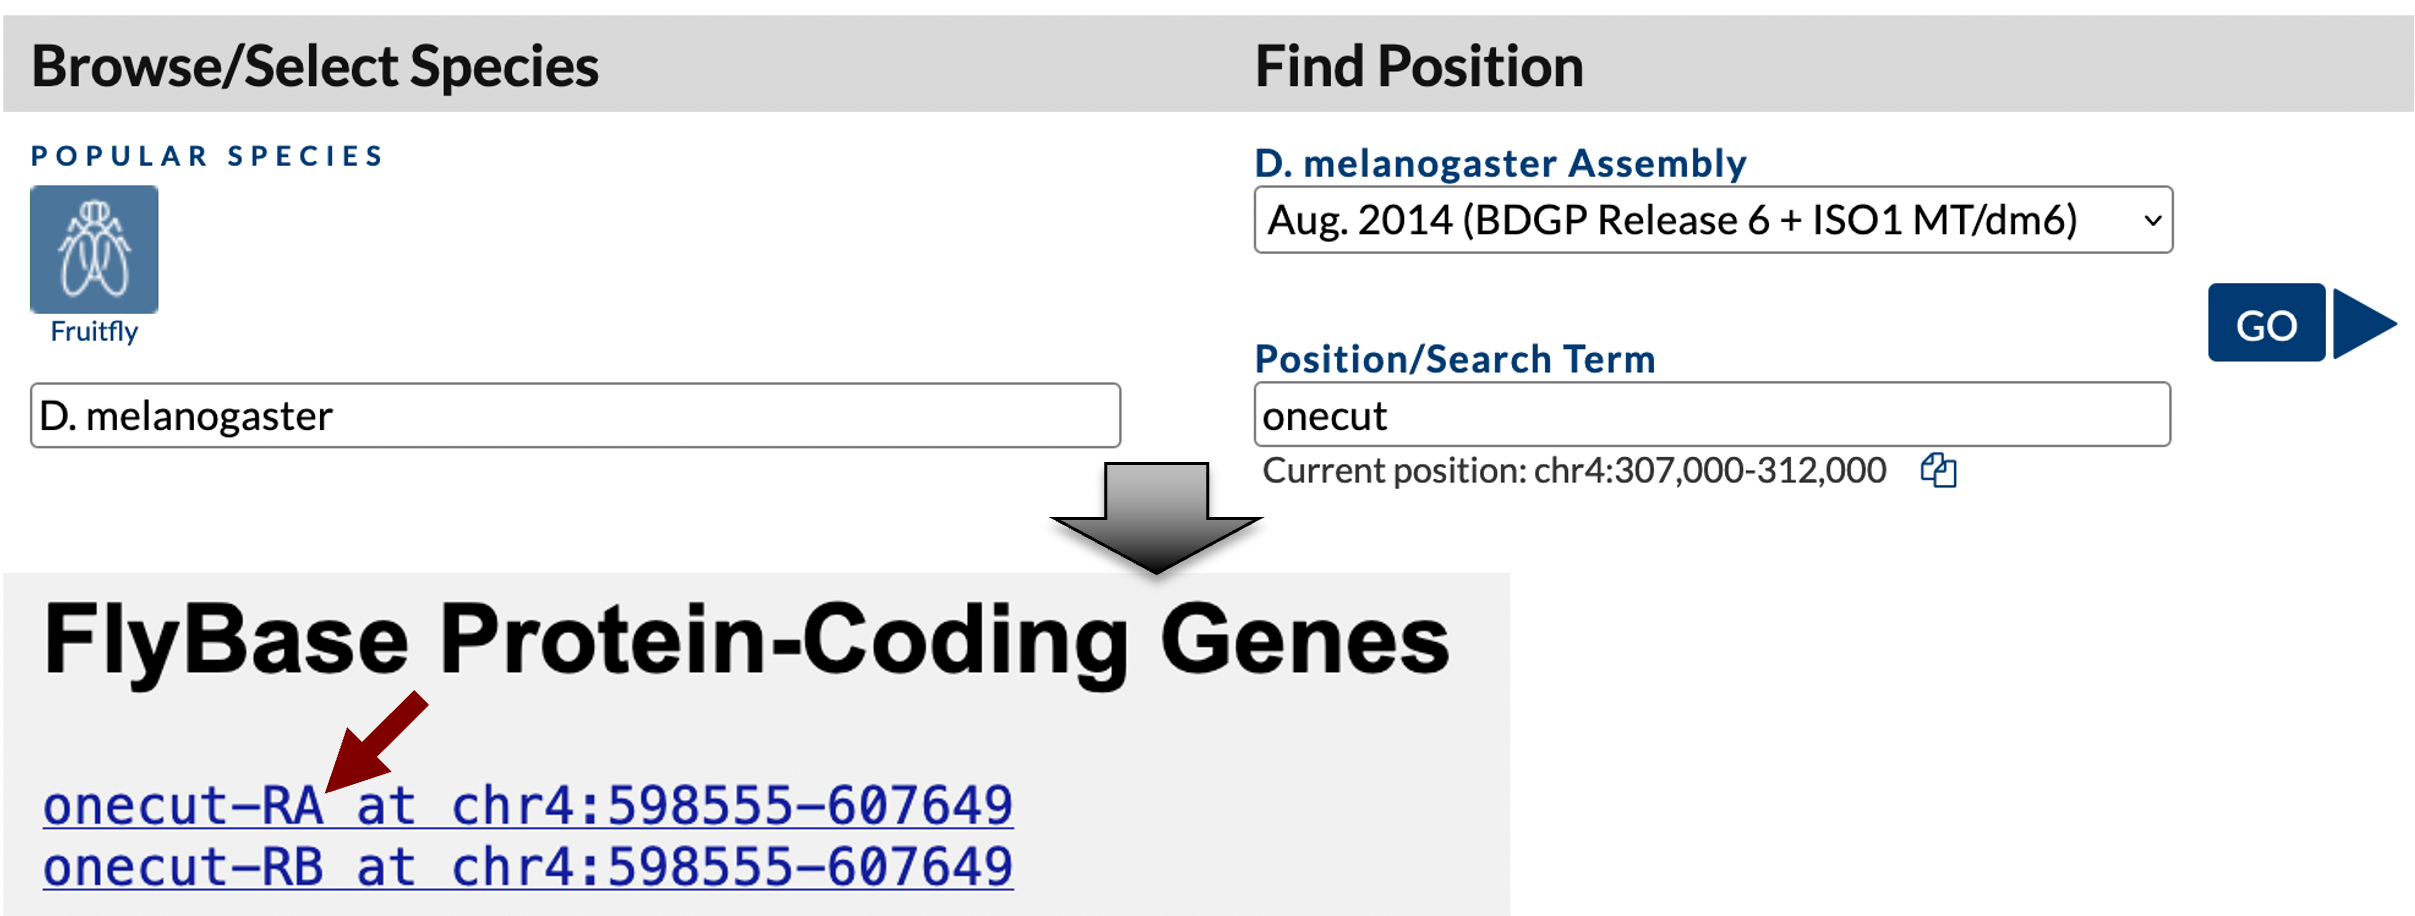
Open a new web browser window, navigate to the GEP UCSC Genome Browser, and click on the “Genome Browser” link on the left sidebar. Enter “D. melanogaster” into the “Enter species, common name, or assembly ID” field. Select “Aug. 2014 (BDGP Release 6 + ISO1 MT/dm6)” under the “D. melanogaster Assembly” field, enter “onecut” into the “Position/Search Term” field, and then click on the “GO” button. Click on the “onecut-RA” link under the “FlyBase Protein-Coding Genes” section (Figure 1).
Zoom out 1.5x and then click on the “hide all” button. Click on the “+” icons next to the “Chromatin Domains” and “Expression and Regulation” track group headings to expand these sections. Change the display modes for the tracks listed below and then click on the “refresh” button.
-
Under “Chromatin Domains”:
-
BG3 9-state (R5): dense
-
S2 9-state (R5): dense
-
-
Under “Genes and Gene Prediction Tracks”:
-
FlyBase Genes: pack
-
-
Under “Expression and Regulation”:
-
Detected DHS Positions (Cell Lines) (R5): pack
-
DHS Read Density (Cell Lines) (R5): full
-
TSS (Celniker) (R5): pack
-
The Genome Browser view of this region of the D. melanogaster chr4 (i.e., Muller F element) shows that the onecut gene is on the negative strand. There are two isoforms of onecut (A and B); the only difference between these two isoforms is at the 5' UTR (thinner boxes in the FlyBase Genes track at ~607kb). The 5' UTRs of the A and B isoforms overlap with each other and both isoforms have the same TSS at 607,649 (Figure 2).
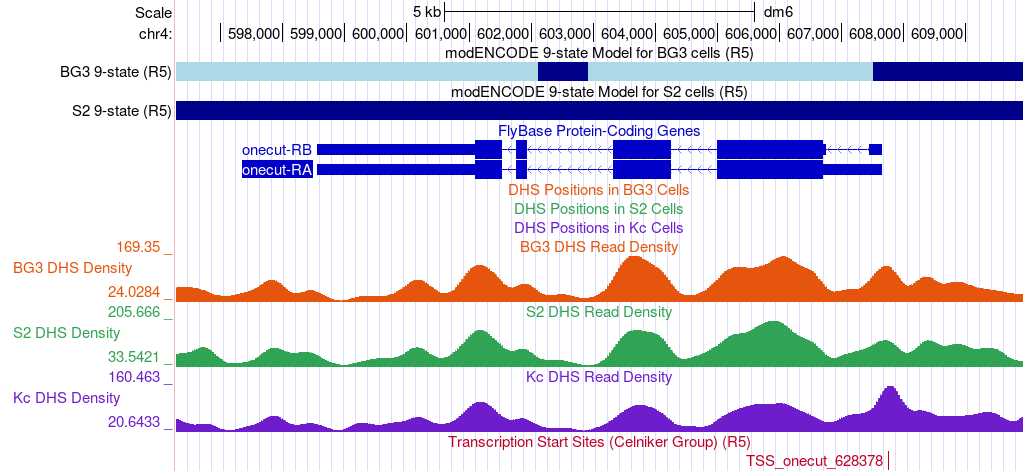
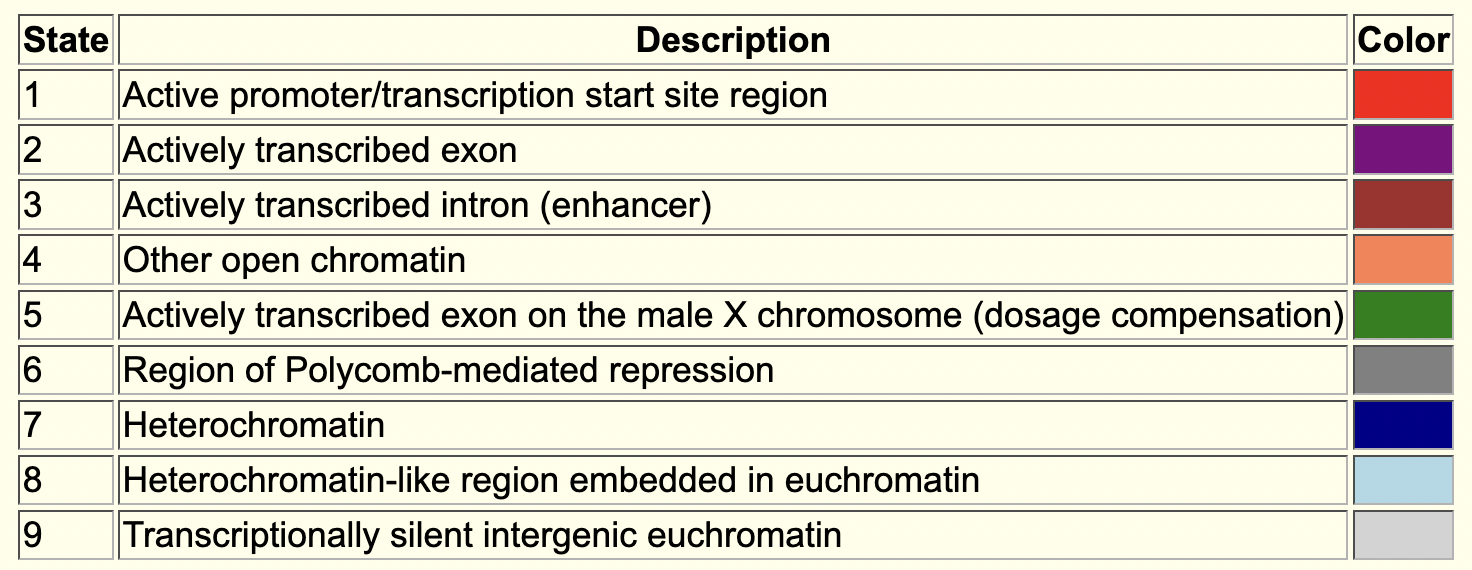
The “BG3 9-state” and “S2 9-state” tracks summarize the epigenomic landscape (i.e., histone modification enrichment patterns) of the region surrounding the onecut gene in the BG3 (neuronal) and S2 (late embryonic stage) cell lines, respectively. The color blocks correspond to the different states in the 9-state model [Kharchenko et al., 2011]. For example, the dark blue regions correspond to the state observed for pericentromeric heterochromatin and the light blue regions correspond to heterochromatin-like regions that are embedded in euchromatin (Figure 3). Hence the 9-state models indicate that the onecut gene is not being actively transcribed in either the BG3 or the S2 cell lines.
The three DHS tracks demarcate regions that are sensitive to cleavage by the DNase I endonuclease in the BG3, S2, and Kc (dorsal closure stage) cell lines. DNase I hypersensitive sites (DHS) correspond to regions with low nucleosome density, and many regulatory regions (such as transcription factor binding sites and TSS) are found within DHS [Kharchenko et al., 2011]. The “DHS Read Density” tracks show the relative sensitivity to DNase I while the “DHS Positions” tracks show the genomic positions that have significantly higher sensitivity to DNase I than the background DNase I density.
The “DHS Read Density” tracks show that the genomic regions that overlap with the exons of onecut tend to have higher sensitivity to DNase I than the intronic regions. However, this increase in read density is not statistically significant (i.e., not a hypersensitive site), as denoted by the lack of features on the “DHS Positions” track in the region surrounding the onecut gene. Hence the DHS data indicates that the onecut gene is inactive in the three cell lines sampled by the modENCODE project and this data does not give us any information regarding the possible locations of the TSSs.
The “TSS (Celniker)” track shows the putative TSS locations that have been annotated by modENCODE project [Hoskins et al., 2011]. These TSS predictions are based on experimental results that specifically isolate mRNA fragments that contain the 5' cap of the mRNAs (i.e., CAGE, 5' RLM-RACE, and cap-trapped ESTs) in Drosophila embryos during different stages of development. Consistent with the FlyBase gene annotations for onecut, the TSS (Celniker) track shows a single TSS annotation (TSS_onecut_628378) at 607,752 (Figure 2). Hence the available modENCODE data suggest that the onecut gene in D. melanogaster has a peaked promoter.
|
|
For the GEP TSS annotation projects, each D. melanogaster core promoter is classified into one of four categories based on the number of TSS (Celniker) annotations and the number of DHS positions within a 300bp window
|
Example of a TSS supported by modENCODE transcriptome data
To see an example of a TSS that is supported by the modENCODE transcriptome data, enter “Dyrk3-RA” into the “chromosome range, or search terms” text box in the Genome Browser and then click on the “go” button. Zoom out 1.5x (Figure 4).
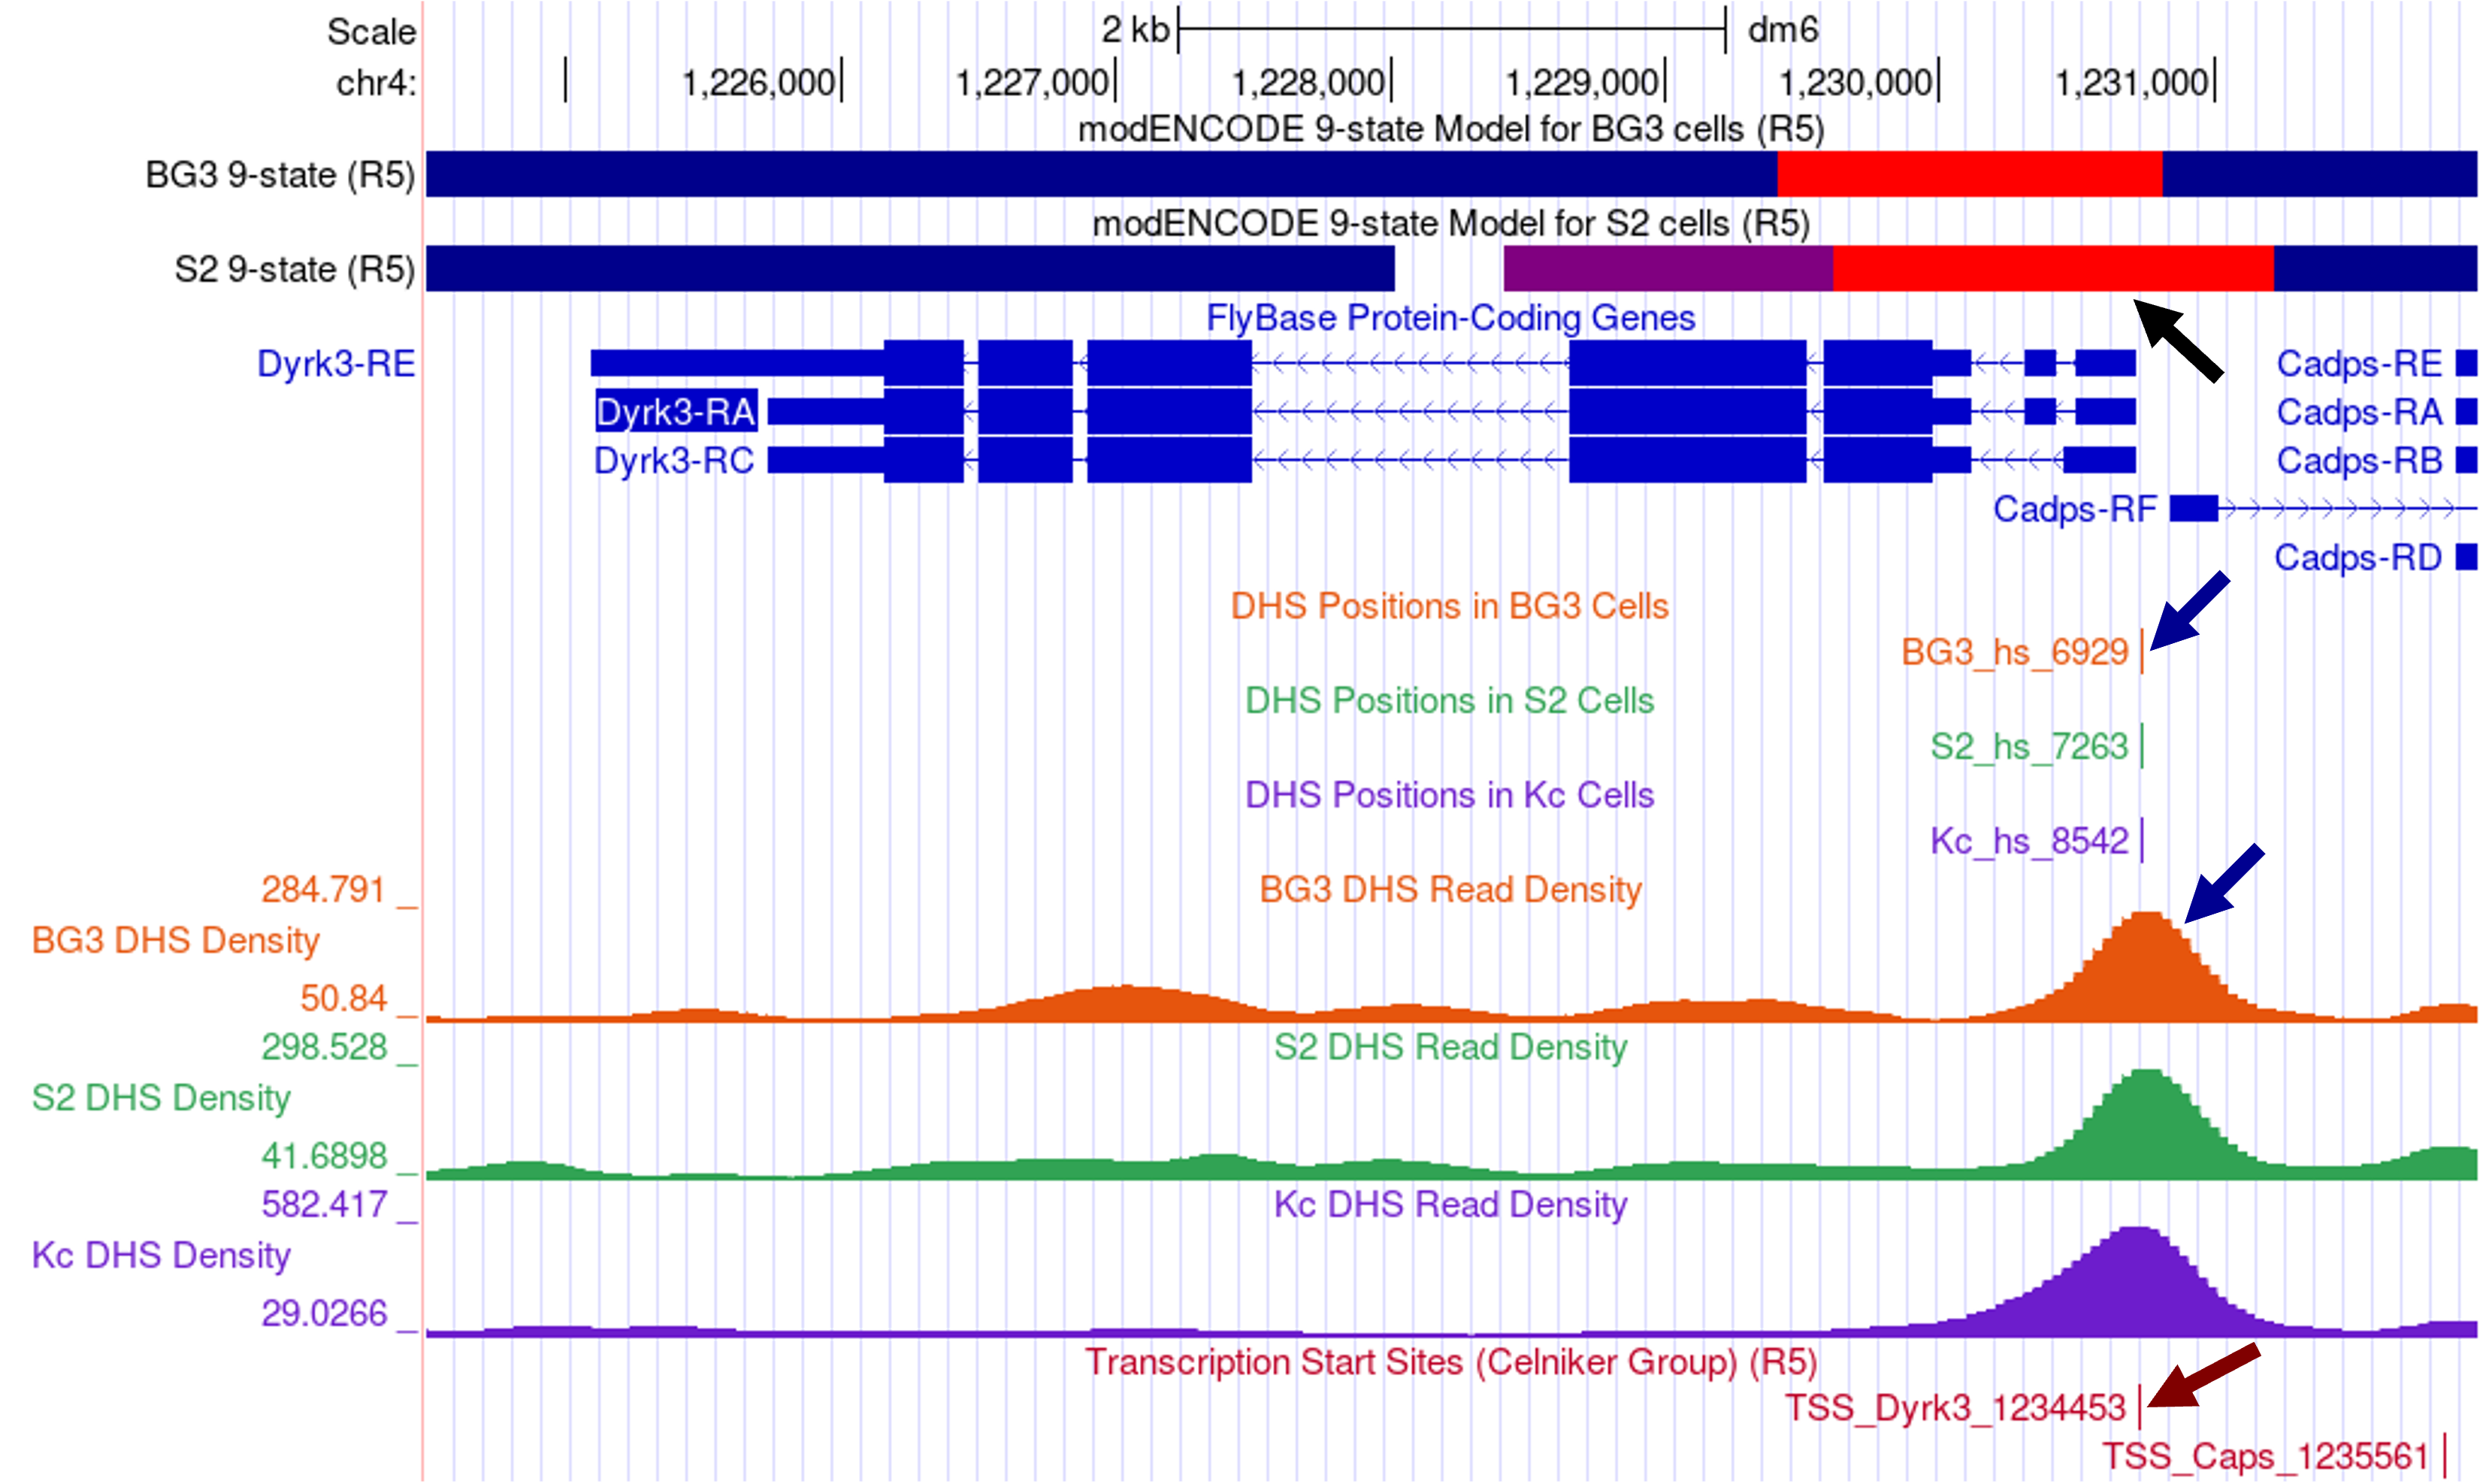
The FlyBase Protein-Coding Genes track shows that the Dyrk3 gene has three isoforms (A, C, and E) but they all share the same TSS. The BG3 and S2 9-state models show that the first three transcribed exons of Dyrk3-RA overlap with the red state (i.e., active promoter, TSS region). Consistent with the 9-state models, both the “Detected DHS Positions (Cell Lines)” and the “DHS Read Density (Cell Lines)” tracks show a single DHS near the TSS of Dyrk3 in S2, BG3, and Kc cells. In addition, the “TSS (Celniker)” track shows that the annotated TSS for Dyrk3 (TSS_Dyrk3_1234453) is supported by the experimental results (i.e., CAGE, 5' RLM-RACE, and cap-trapped ESTs) produced by the modENCODE project. Collectively, the available experimental evidence indicates that Dyrk3 has a peaked promoter and that this gene is expressed in the BG3, S2, and Kc cell lines.
Examine DHS datasets from other developmental stages
In cases where a gene is not expressed in the three cell lines sampled by the modENCODE project (e.g., onecut), we can examine DHS datasets from other developmental stages in order to classify the type of core promoter. The Berkeley Drosophila Transcription Network Project (BDTNP) has previously produced DHS datasets from five stages of Drosophila embryonic development [Thomas et al., 2011]. These DHS datasets are available through the “Detected DHS Positions (Embryos)” and the “DHS Read Density (Embryos)” evidence tracks (under the “Expression and Regulation” section) on the GEP UCSC Genome Browser for D. melanogaster.
For example, we can use these evidence tracks to gather additional evidence in support of the classification of the core promoter for onecut. Enter “chr4:606,500-608,000” into the “chromosome range, or search terms” textbox and click on “go” to navigate to the region near the core promoter of onecut. In addition to changing the display modes for the embryonic DHS evidence tracks, we will also hide the DHS evidence tracks for the three cell lines in order to simplify the display. Change the display modes of the evidence tracks listed below and then click on the “refresh” button:
-
Under “Expression and Regulation”:
-
Detected DHS Positions (Cell Lines) (R5): hide
-
DHS Read Density (Cell Lines) (R5): hide
-
Detected DHS Positions (Embryos): pack
-
DHS Read Density (Embryos): full
-
The DHS datasets generally show a consistent DNase I enrichment pattern near the FlyBase annotated TSS of onecut across the five embryonic stages (Figure 5, red box). Each subtrack in the “Detected DHS Positions (Embryos)” track corresponds to the different embryonic stages (i.e., stages 5, 9, 10, 11, and 14). The boxes in each subtrack correspond to the regions that show high sensitivity to DNase I and the color line within each box denotes the summit location (i.e., estimated binding site) as determined by MACS2 [Zhang et al., 2008]. The color of each box corresponds to the false discovery rate (FDR), where the darker boxes have a lower FDR than the lighter boxes. In other words, darker color indicates more confidence and vice versa.
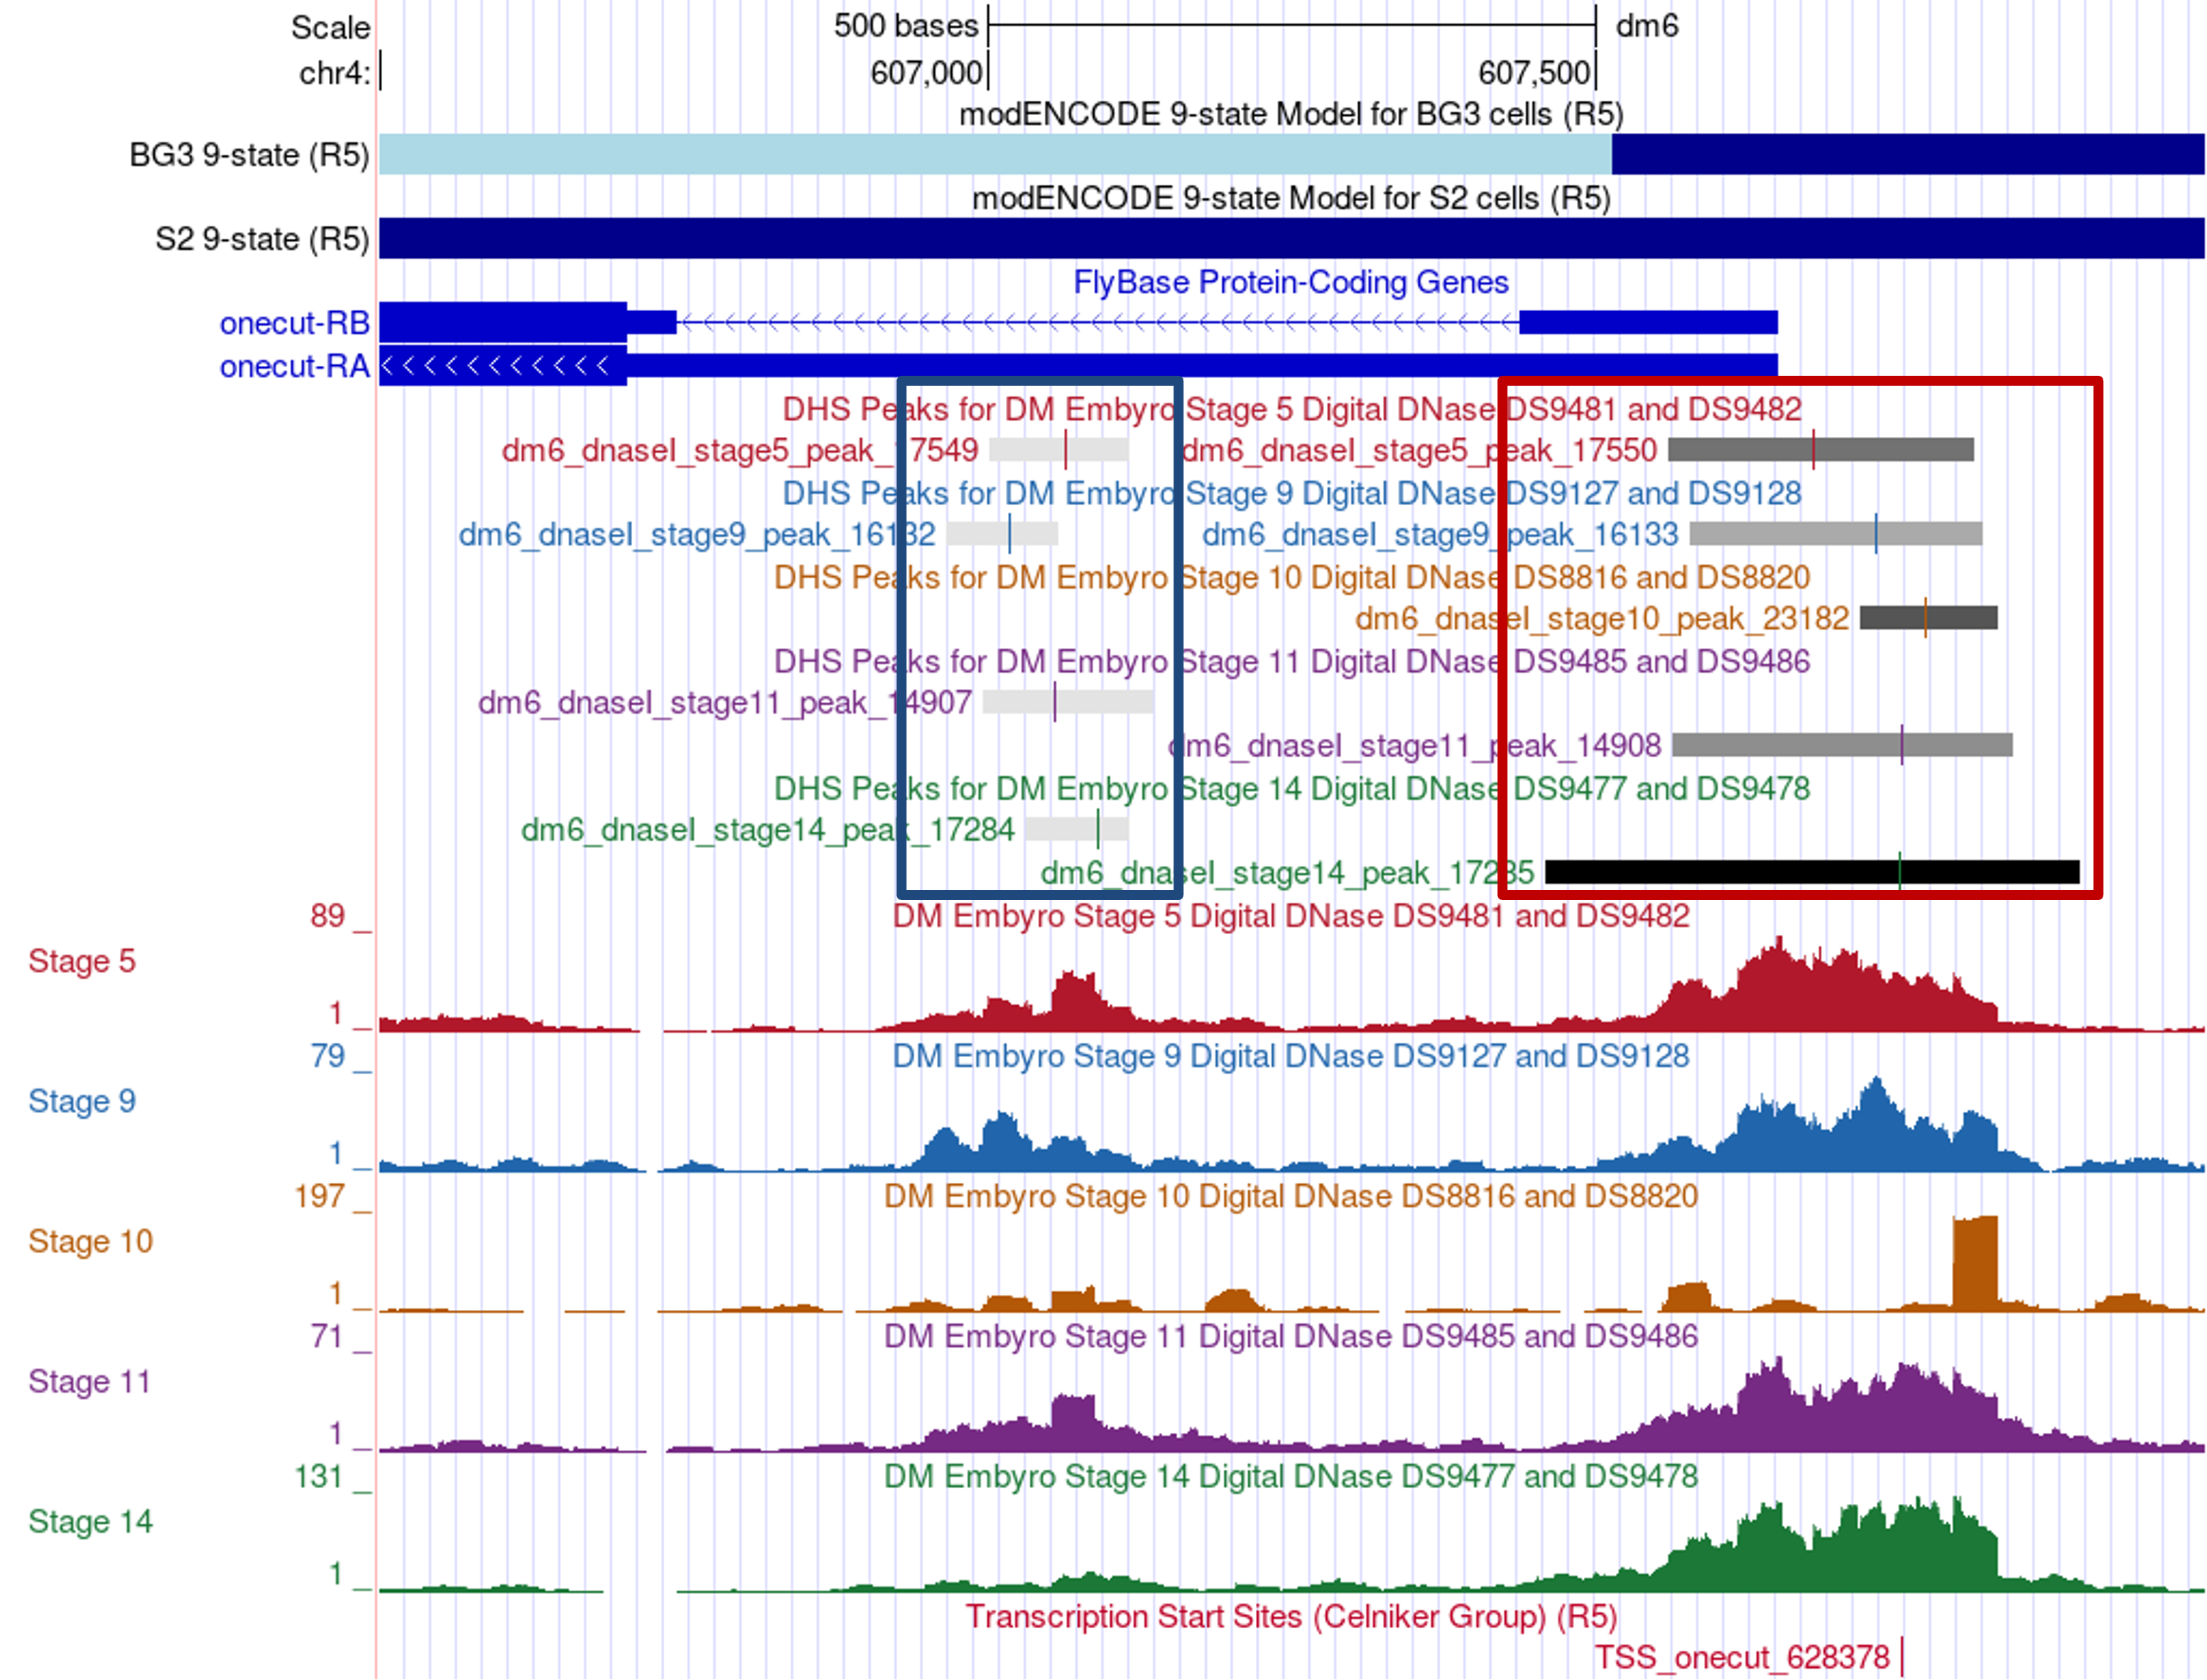
While MACS2 predicted different summit locations for the five embryonic stages, the DHS peaks in the five samples all overlap with each other. Hence, despite the differences in the summit locations, the results of the embryonic DHS datasets are consistent with the hypothesis that the D. melanogaster onecut gene has a peaked promoter.
Note that MACS2 also identified a weaker DHS peak within the first intron of the B isoform of onecut in four of the five embryonic stages (Figure 5, blue box). Examination of the “TFBS HOT Spots (R5)” evidence track (available under the “Expression and Regulation” section) on the GEP UCSC Genome Browser shows that this region contains a transcription factor binding site (TFBS) HOT Spot (TFBS_HSA_031023; FlyBase ID: FBsf0000377429), which could account for the higher sensitivity to DNase I.
Using RAMPAGE datasets to support the classification of the core promoter
In addition to CAGE and 5' RLM-RACE, RNA Annotation and Mapping of Promoters for Analysis of Gene Expression (RAMPAGE) is another high-throughput technique for identifying TSS [Batut et al., 2013]. Unlike CAGE which only produces short sequence tags (~27bp) near the 5' cap of the transcript, RAMPAGE uses a combination of template-switching and cap-trapping to enable the sequencing of 5' complete cDNAs. The longer paired-end reads and the use of a novel algorithm to define TSS clusters result in a more precise and a more specific estimate of the distributions of TSS [Batut and Gingeras, 2013].
The strand-specific RAMPAGE analysis results for 36 Drosophila developmental stages are available through the “RAMPAGE TSS Read Density (R5)” composite evidence track on the GEP UCSC Genome Browser. To obtain an overview of the TSS distributions across all the stages, the RAMPAGE results from the 36 developmental stages were merged into a single evidence track. The combined read density and peak calls are available through the “Combined RAMPAGE TSS (R5)” evidence track on the GEP UCSC Genome Browser.
To see how we can utilize these RAMPAGE datasets in the classification of the type of core promoter, enter “chr4:607,400-607,800” into the “chromosome range, or search terms” text box of the Genome Browser and then click on the “go” button to navigate to the core promoter of onecut. Change the display modes of the evidence tracks listed below and then click on the “refresh” button:
-
Under “Expression and Regulation”:
-
Detected DHS Positions (Embryos): hide
-
DHS Read Density (Embryos): hide
-
Combined RAMPAGE TSS (R5): full
-
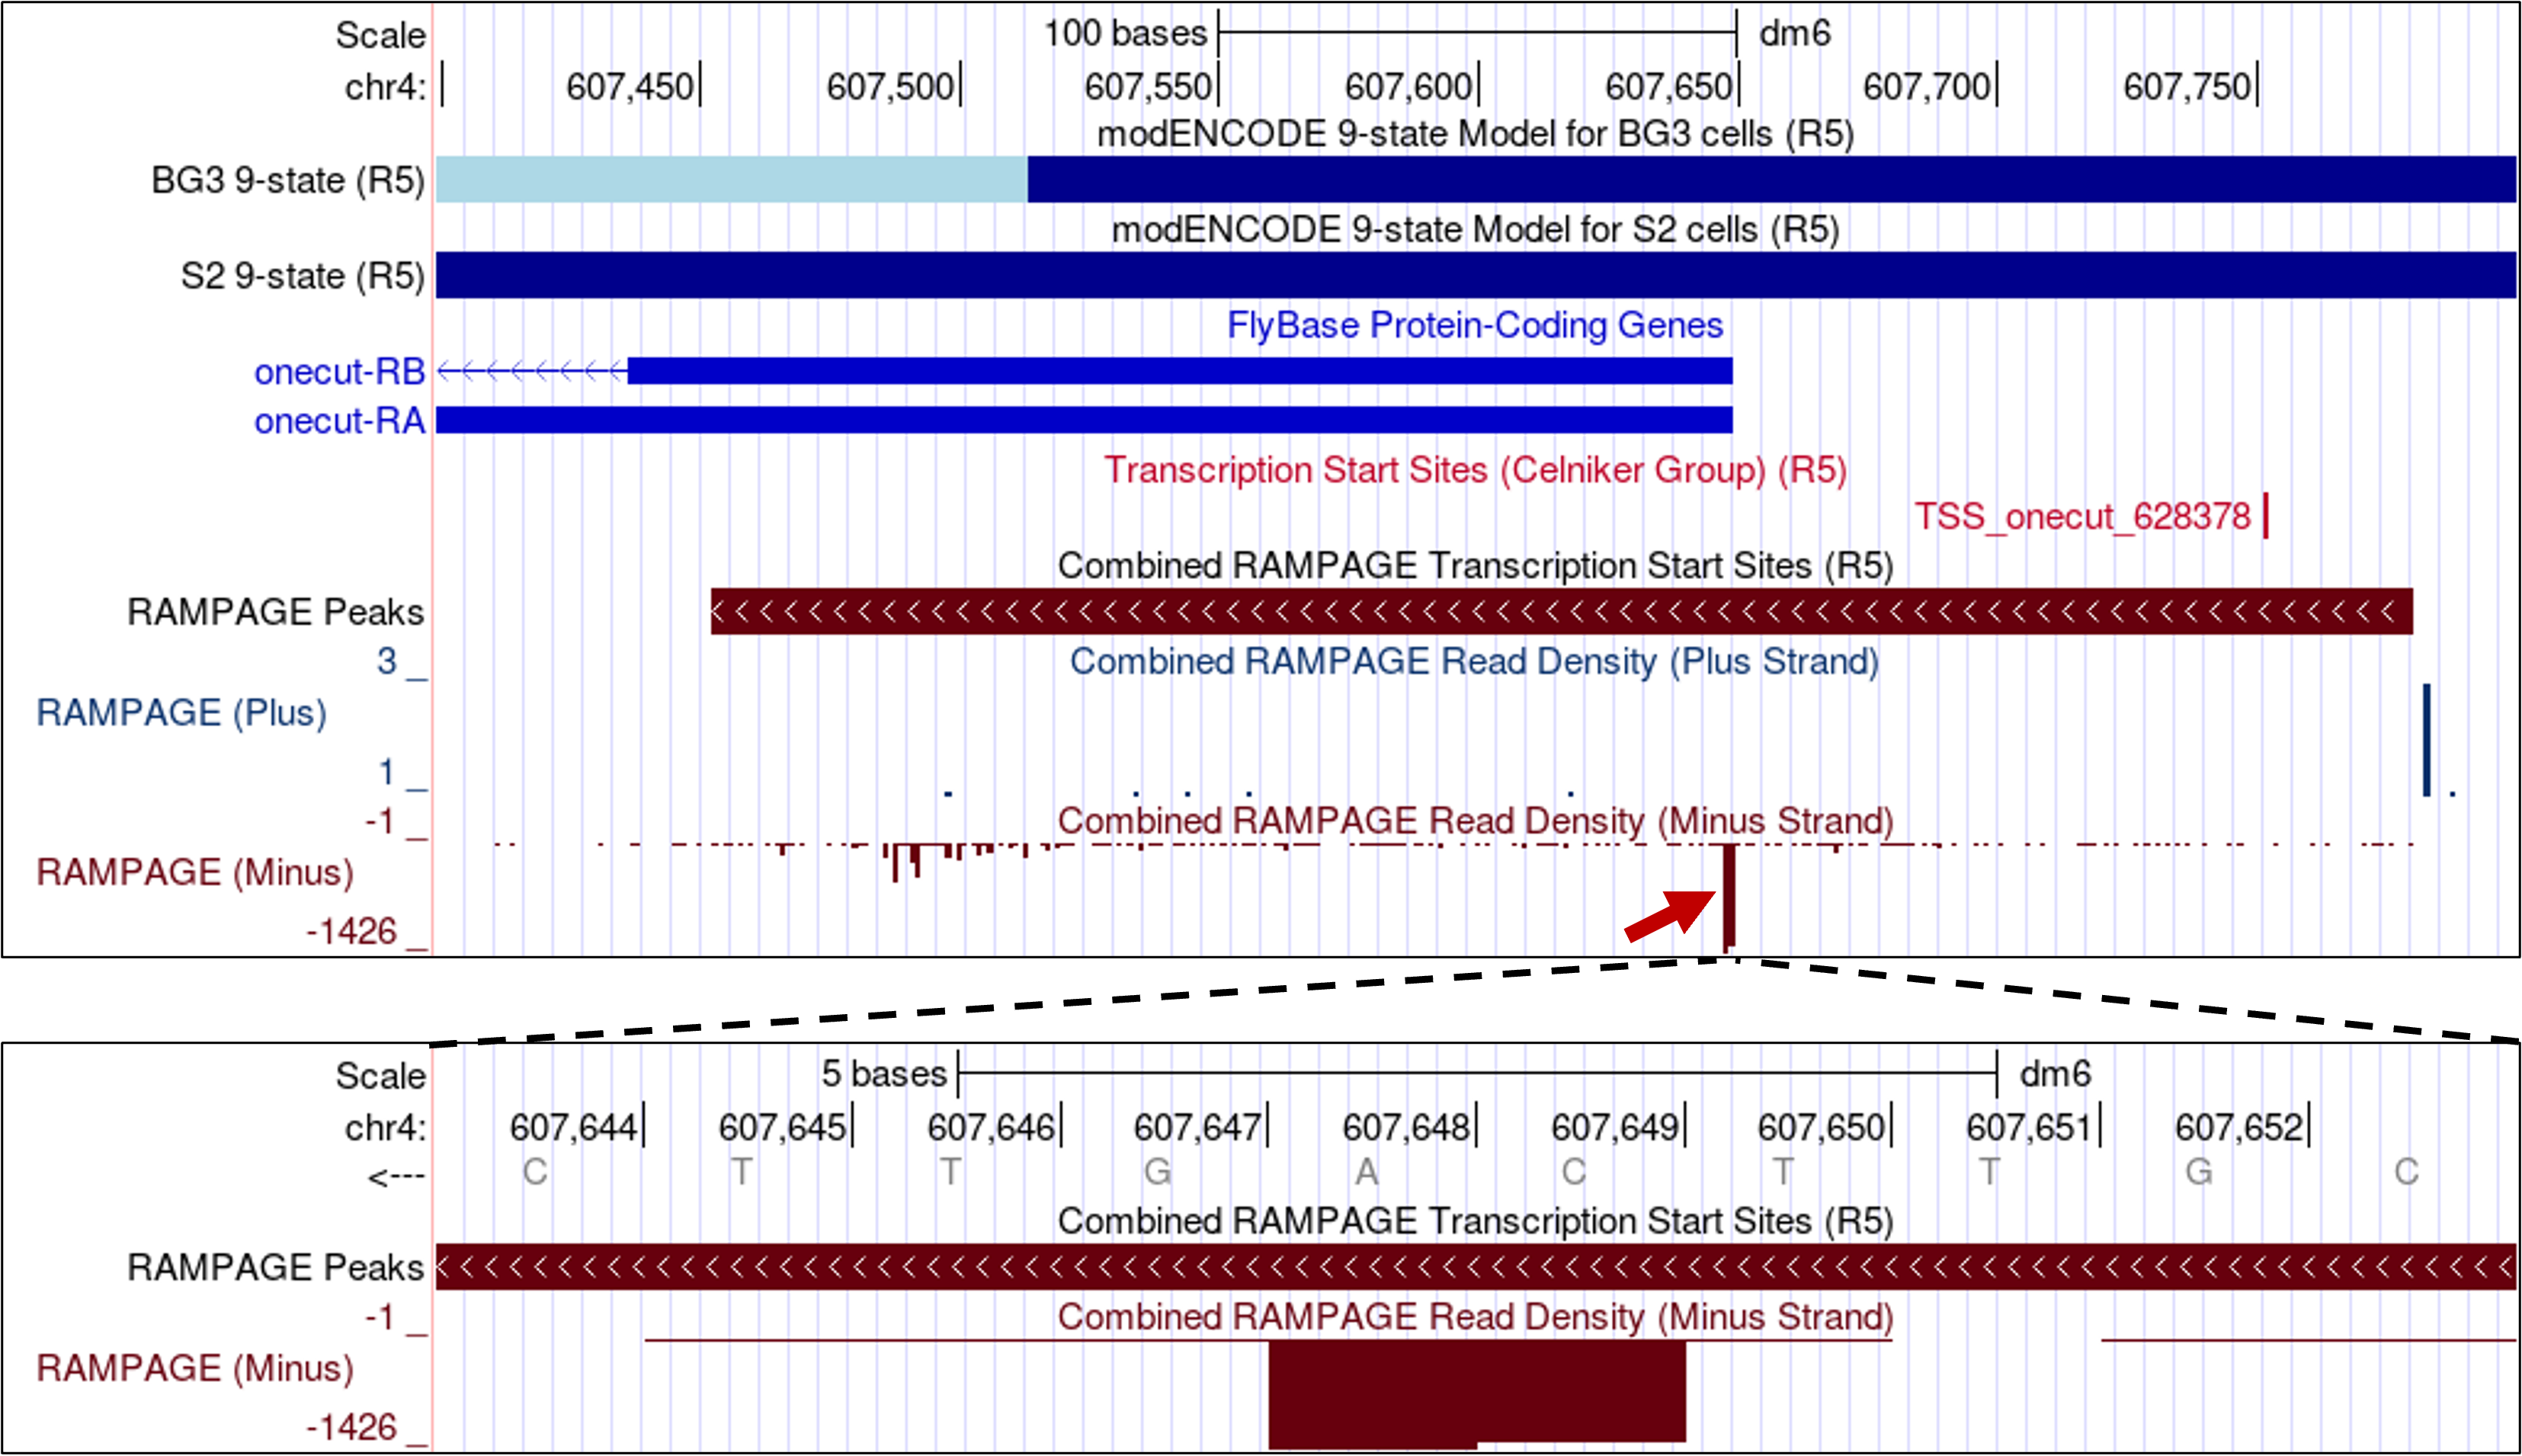
Based on the distribution of RAMPAGE reads from 36 samples, the RAMPAGE analysis pipeline defined a TSS cluster for onecut that spans from 607,453-607,780 (Figure 6). Examination of the “Combined RAMPAGE Read Density” track shows that the position near the start of the A and B isoforms of onecut has the highest RAMPAGE read density within this TSS cluster (red arrow in Figure 6). When we zoom into this region, we find that the strongest TSS for onecut are located at 607,648 and 607,649 (Figure 6, bottom).
Collectively, given the limitations and variability of the different experimental techniques and the fact that the distribution of TSS is a continuum, the core promoter of onecut is more similar to a peaked promoter than a broad promoter. Consequently, we would classify the core promoter of onecut as a peaked promoter and we would expect to find a peaked promoter in the D. biarmipes ortholog of onecut based on parsimony with D. melanogaster.
Annotation of the coding regions of onecut
For the rest of this walkthrough, we will focus on the annotation of the TSS of onecut. However, before we can search for the TSS of the onecut ortholog in D. biarmipes, we need to first annotate the coding regions. This walkthrough assumes that the reader is already familiar with the GEP annotation protocol for the coding regions. (See the “Annotation of Drosophila” presentation and the “Annotation of a Drosophila gene” walkthrough on the GEP website for details.)
The onecut gene has two isoforms (A and B) in D. melanogaster but both isoforms use the same set of coding exons (CDSs). The CDSs of onecut are highly conserved between D. biarmipes and D. melanogaster. For this walkthrough, we assume that the annotator has already constructed the gene models for the coding regions of the A and B isoforms. The coordinates for the coding exons of onecut in D. biarmipes contig35 are listed below:
| FlyBase ID | CDS Coordinates | Frame |
|---|---|---|
onecut:1_2735_0 |
20650-18924 |
-2 |
onecut:2_2735_1 |
18238-17316 |
-3 |
onecut:3_2735_2 |
16462-16284 |
-1 |
onecut:4_2735_0 |
14595-14188 |
-3 |
Determine the gene structure in D. melanogaster
Before we can identify the TSS, we need to annotate the first transcribed exon of onecut. We will use the Gene Record Finder and FlyBase to determine the exon structure of the D. melanogaster onecut gene and to retrieve the sequence for the first transcribed exon.
Open a new tab on your web browser, navigate to the Gene Record Finder (under “Research” → “F Element” → “Resources & Tools” on the GEP website) and search for the gene record for onecut. Consistent with our previous observations in the GEP UCSC Genome Browser, the “Polypeptide Details” section shows that both the A and B isoforms of onecut share the same set of CDSs (Figure 7, left). Hence the differences between these two isoforms are limited to the untranslated regions.
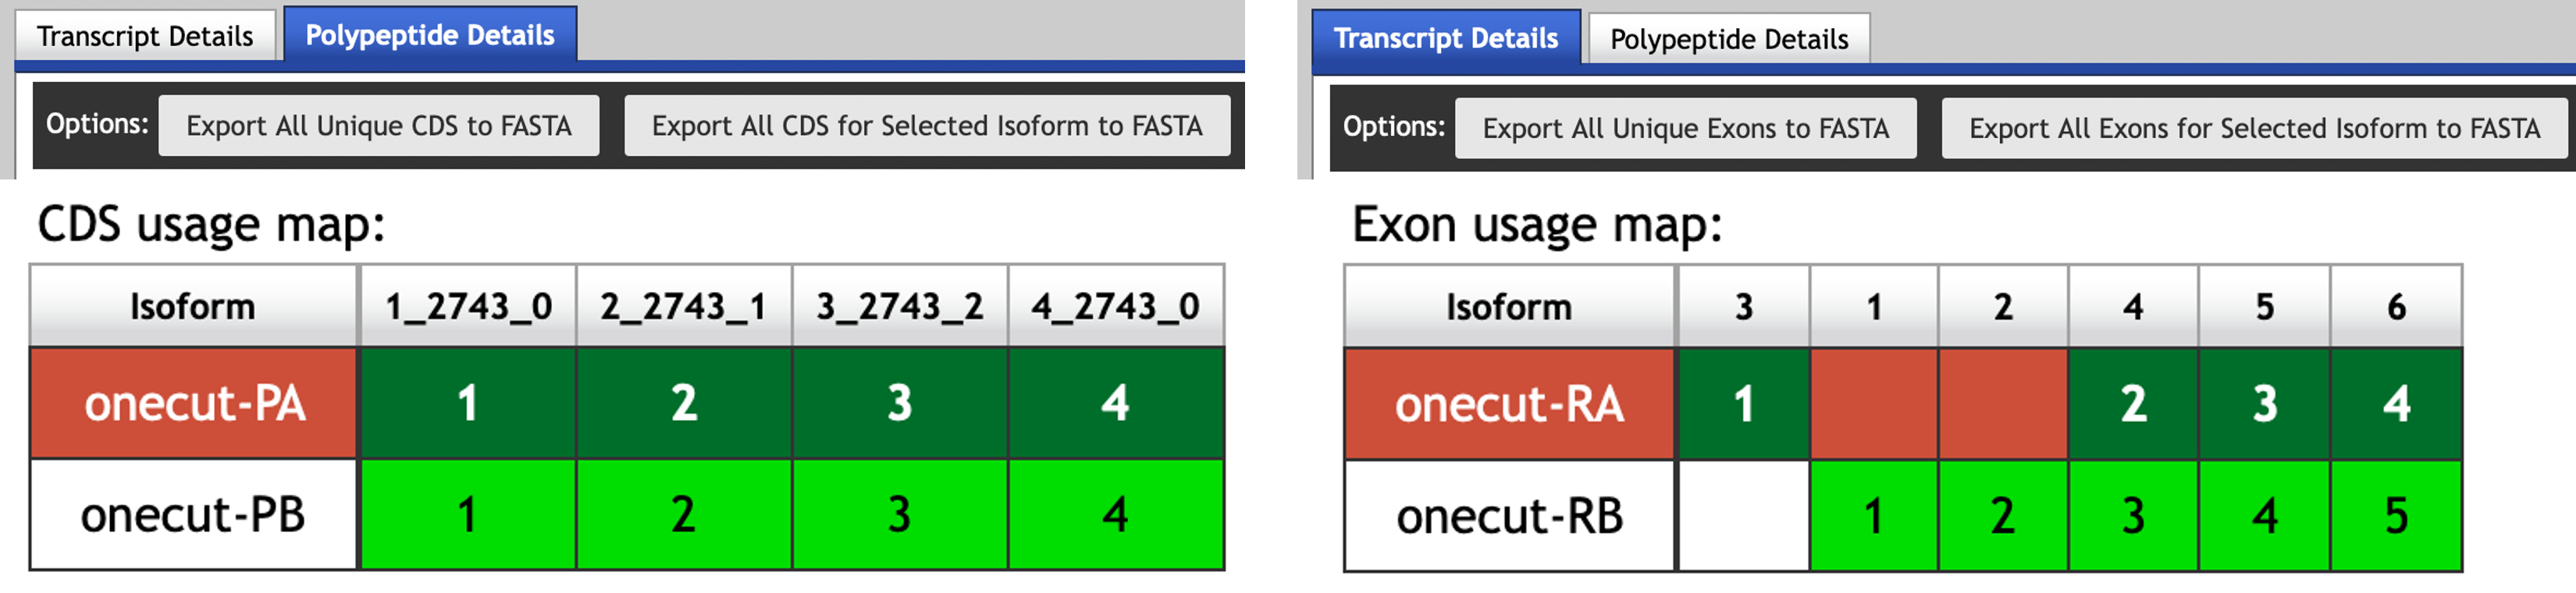
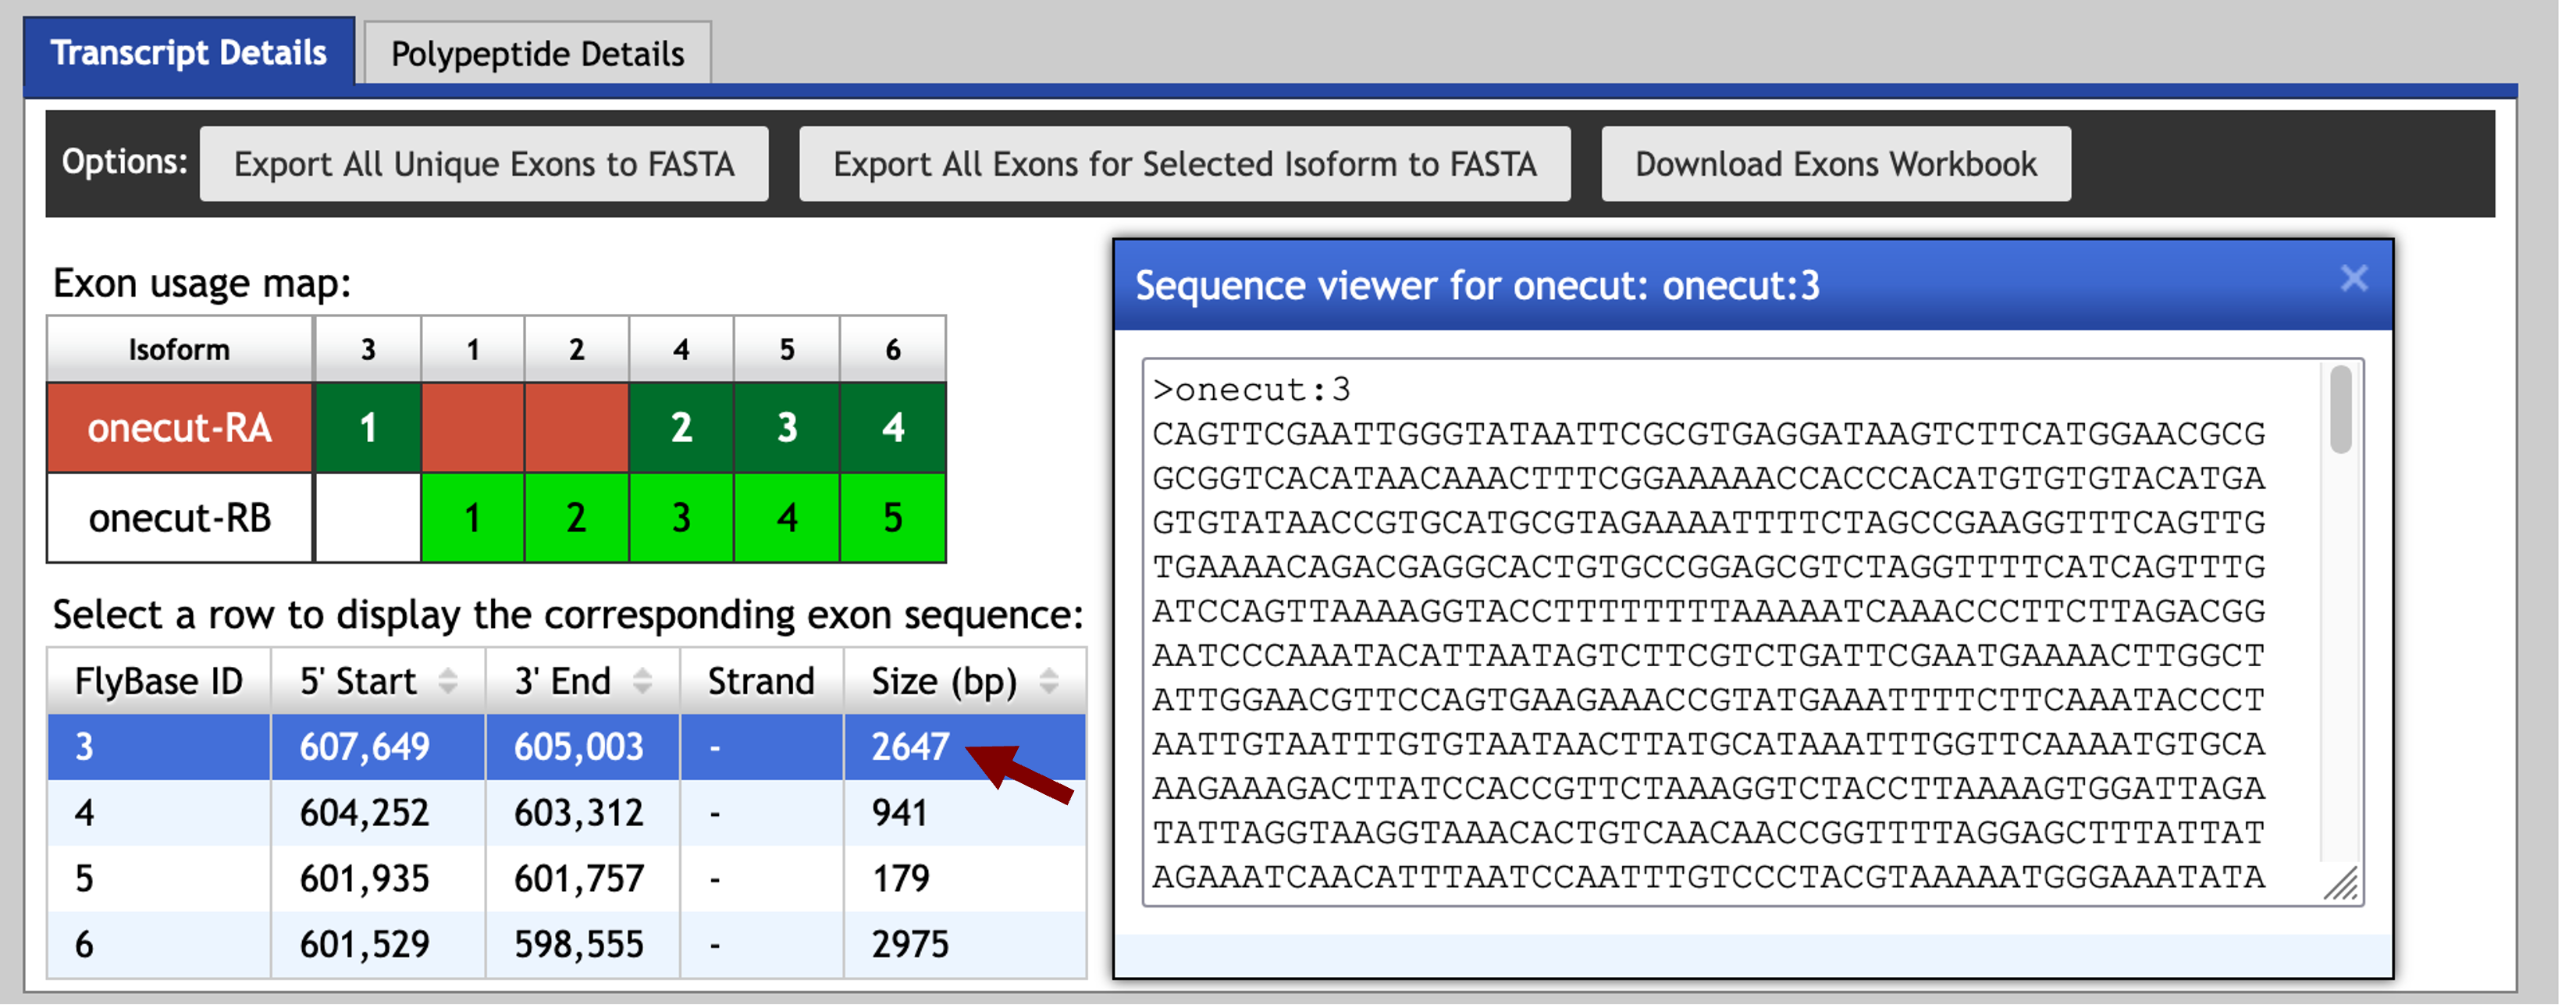
Click on the “Transcript Details” tab so that we can examine the set of transcribed exons used by the two isoforms. The “Exon usage map” shows that the difference between these two isoforms is found at the 5' untranslated region: The A isoform of onecut uses the exon onecut:3 while the B isoform uses the exons onecut:1 and onecut:2 (Figure 7, right).
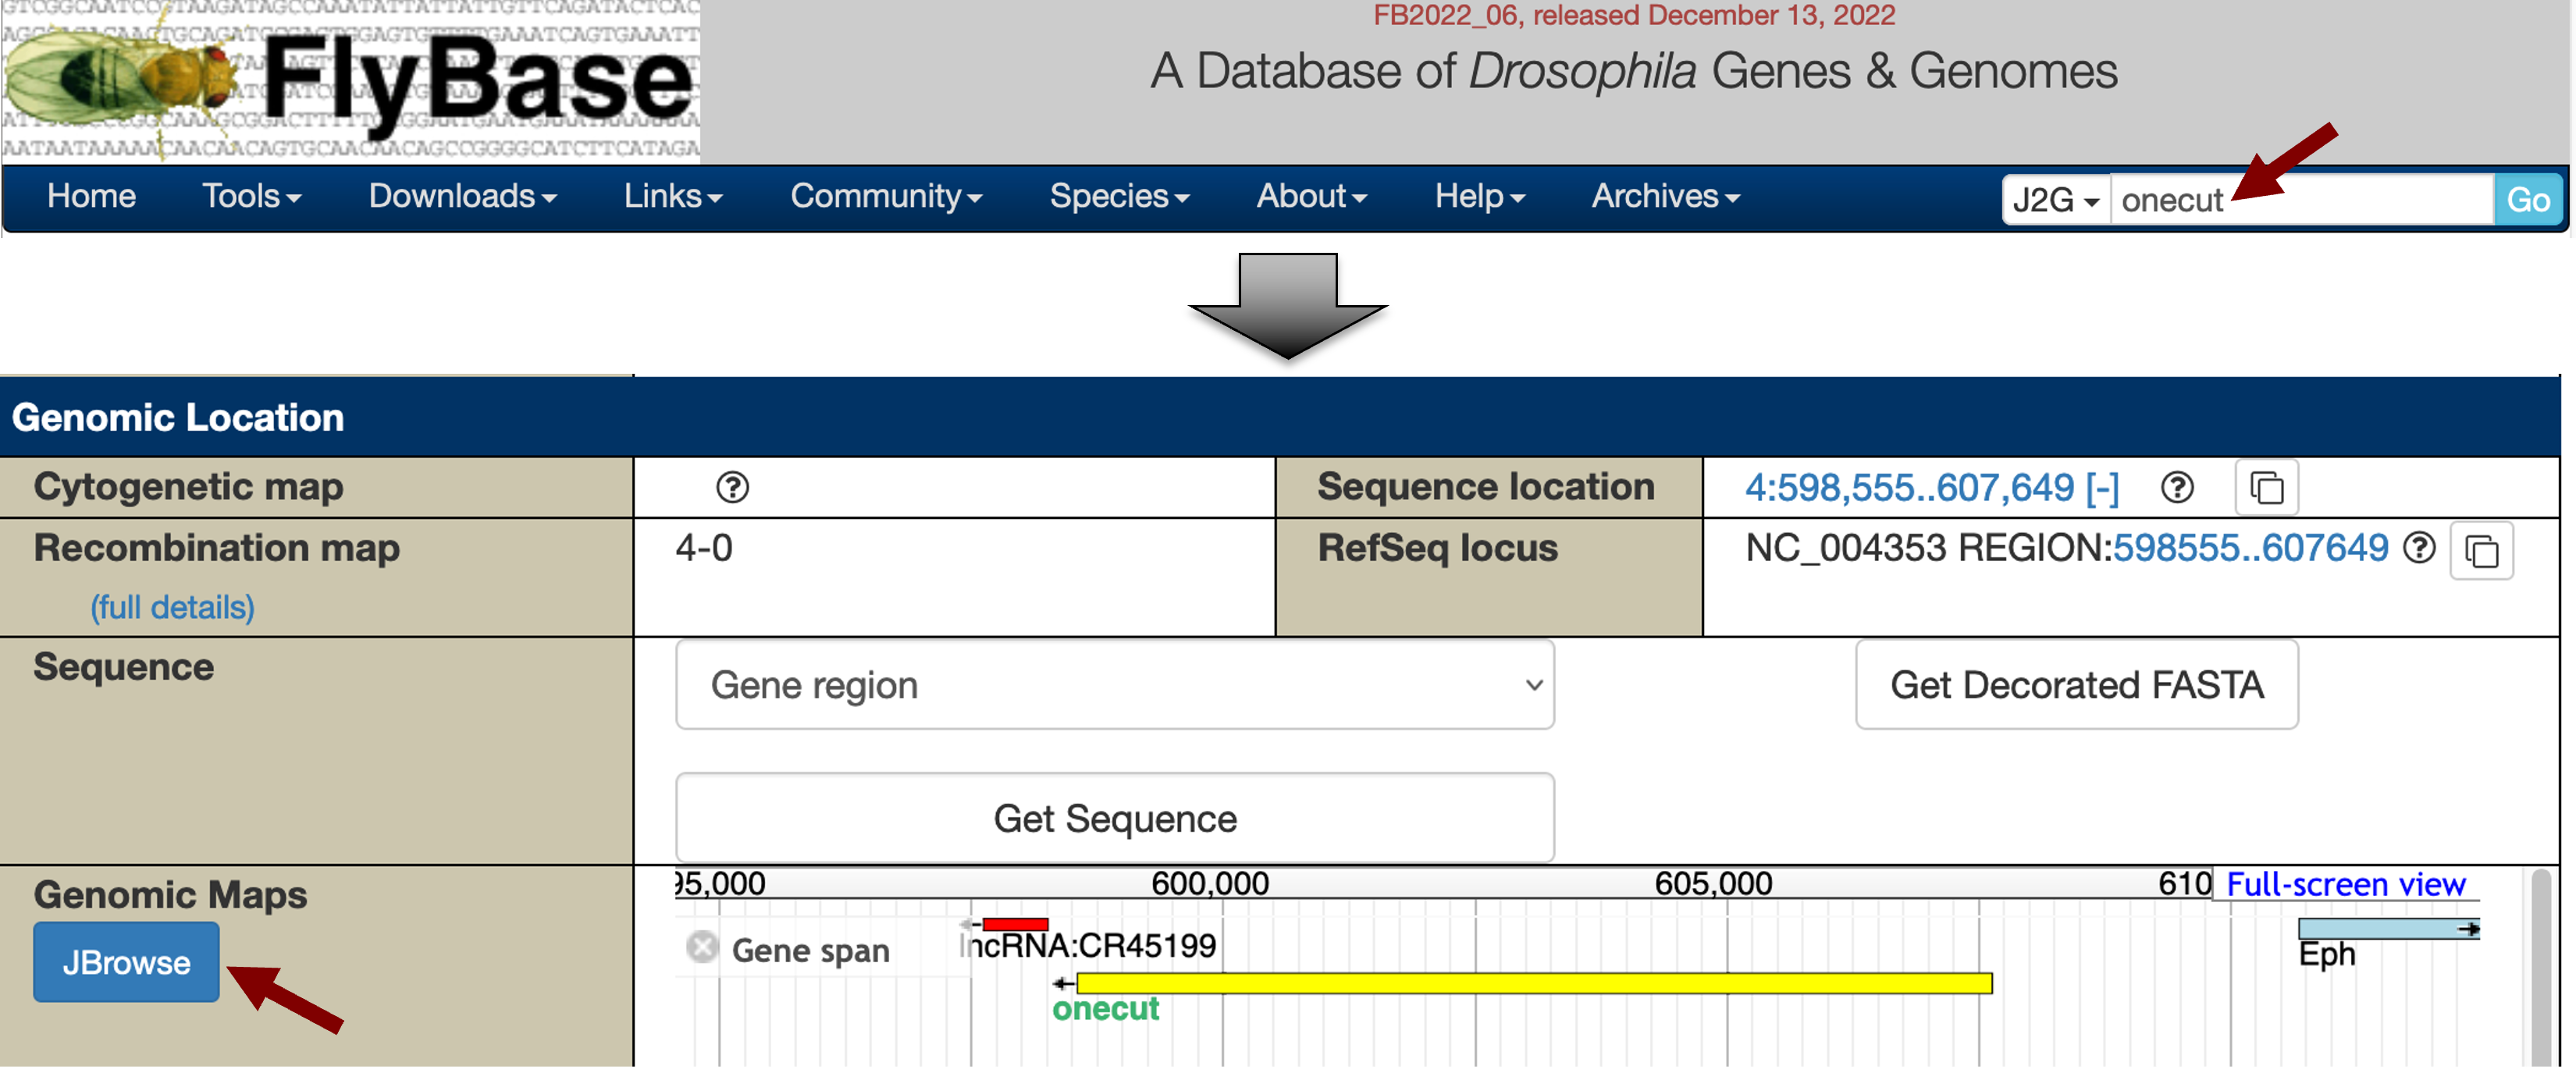
A graphical overview of the two isoforms of onecut is available in the “mRNA Details” section, where the thin rectangles denote the UTRs, the thick rectangles denote the CDS’s, and the lines denote the introns. In addition to the GEP UCSC Genome Browser, we can also use FlyBase JBrowse to visualize the order and organization of these 5' untranslated exons of onecut. Open a new tab and navigate to FlyBase. Enter “onecut” into the “Jump to Gene” (J2G) search box in the top navigation bar and then click “Go”. Click on the “JBrowse” button under the “Genomic Location” section of the FlyBase Gene Report to view the genomic region surrounding the onecut gene in JBrowse (Figure 8).
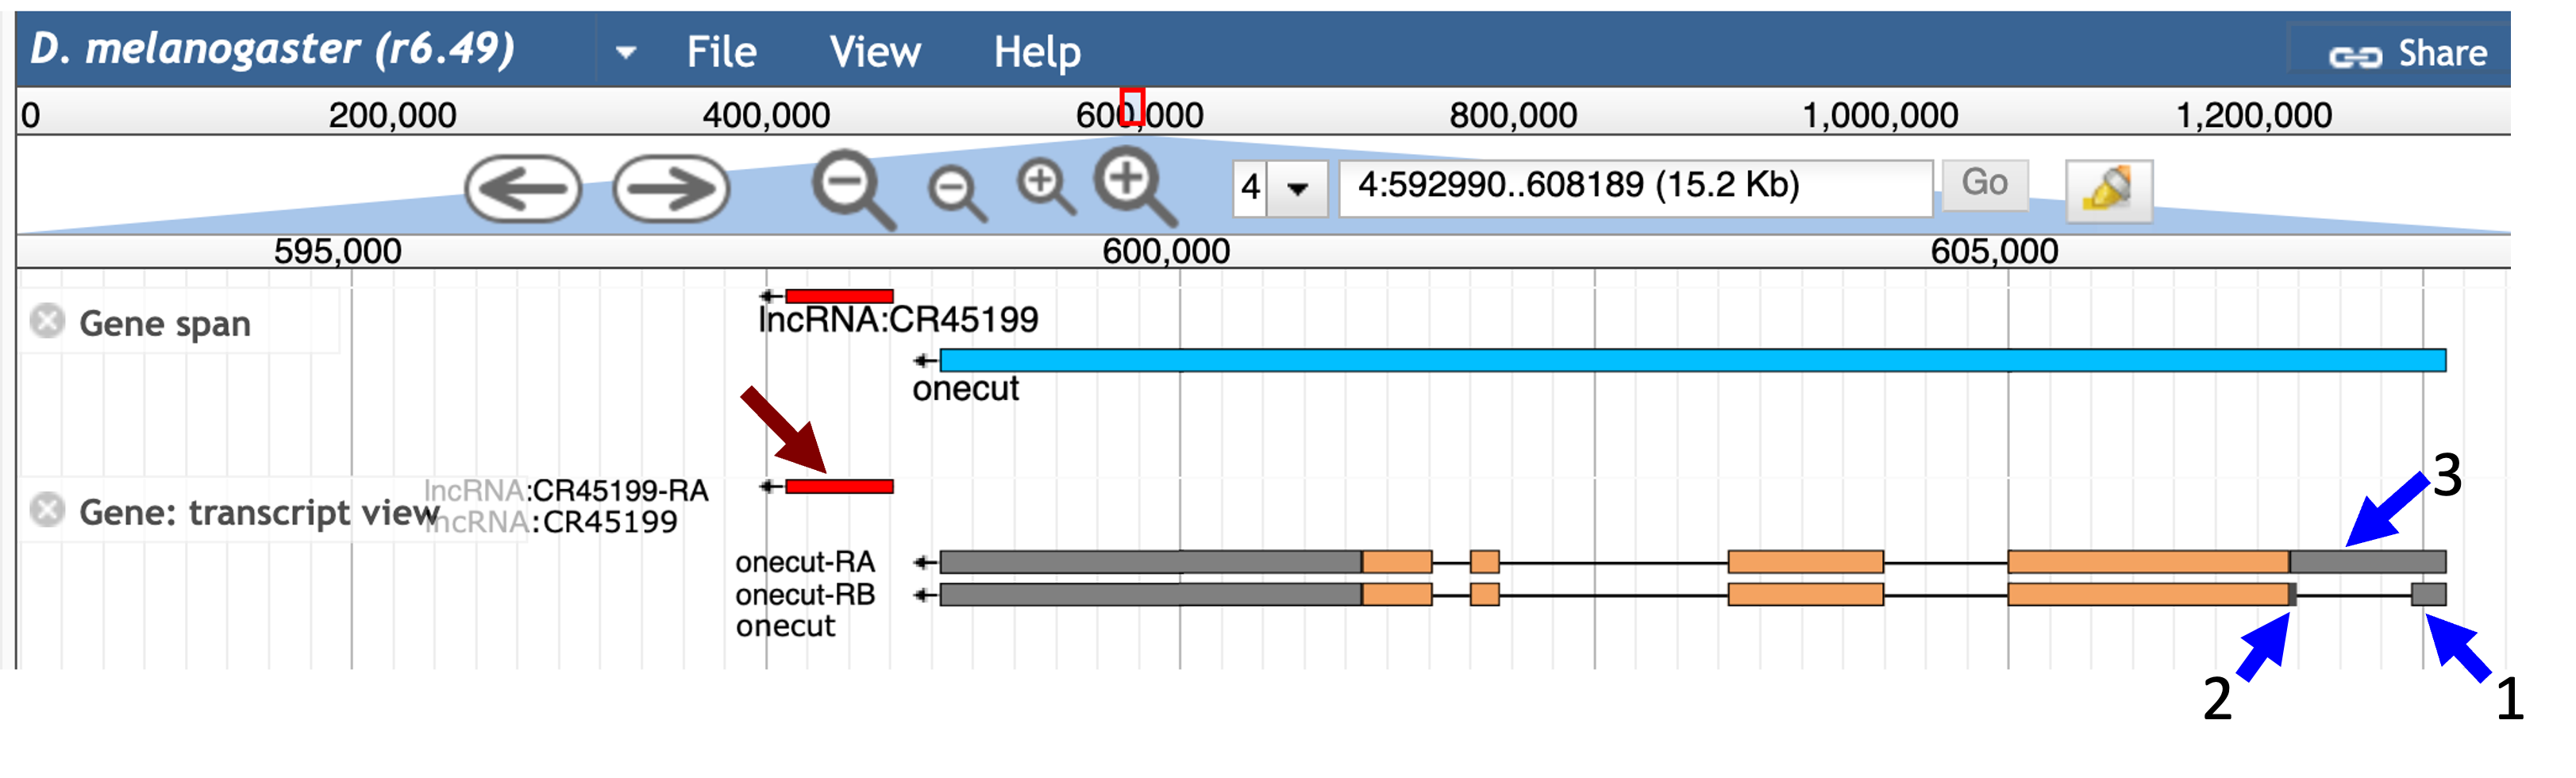
The orange boxes in the “Gene: transcript view” track correspond to the coding exons while the grey boxes correspond to the UTRs. Examination of the JBrowse view shows that the 5' untranslated region of the A isoform of onecut is located immediately upstream of the first coding exon (CDS 1_2735_0). The smaller 5' UTRs of the B isoform (onecut:1 and onecut:2) overlap completely with the larger initial transcribed exon of the A isoform (onecut:3) (Figure 9). This exon structure indicates that both the A and B isoforms of onecut have the same TSS in D. melanogaster.
|
|
The JBrowse view also shows that the 3' UTRs of both the A and B isoforms of onecut are located immediately adjacent to the last coding exon. There is also a non-coding RNA (lncRNA:CR45199) located immediately downstream of the 3' UTR (red arrow, Figure 9). For an actual GEP annotation project, we would need to ascertain if this non-coding RNA exists in the orthologous region of our D. biarmipes project. |
Using blastn to map a 5' untranslated exon
Because the JBrowse view indicates that both the A and B isoforms have the same TSS, we can use either exon onecut:3 or onecut:1 to estimate the location of the TSS for the onecut ortholog in our D. biarmipes project. The JBrowse view shows that the exon onecut:3 is larger than onecut:1 and the end of onecut:3 contains the initial coding exon of the A and B isoforms. Because coding regions are usually more highly conserved than untranslated regions, we can use the alignment to the coding region as an anchor when we evaluate the alignment to the 5' UTR of onecut. Hence, we will try to place exon onecut:3 in the D. biarmipes contig35 project.
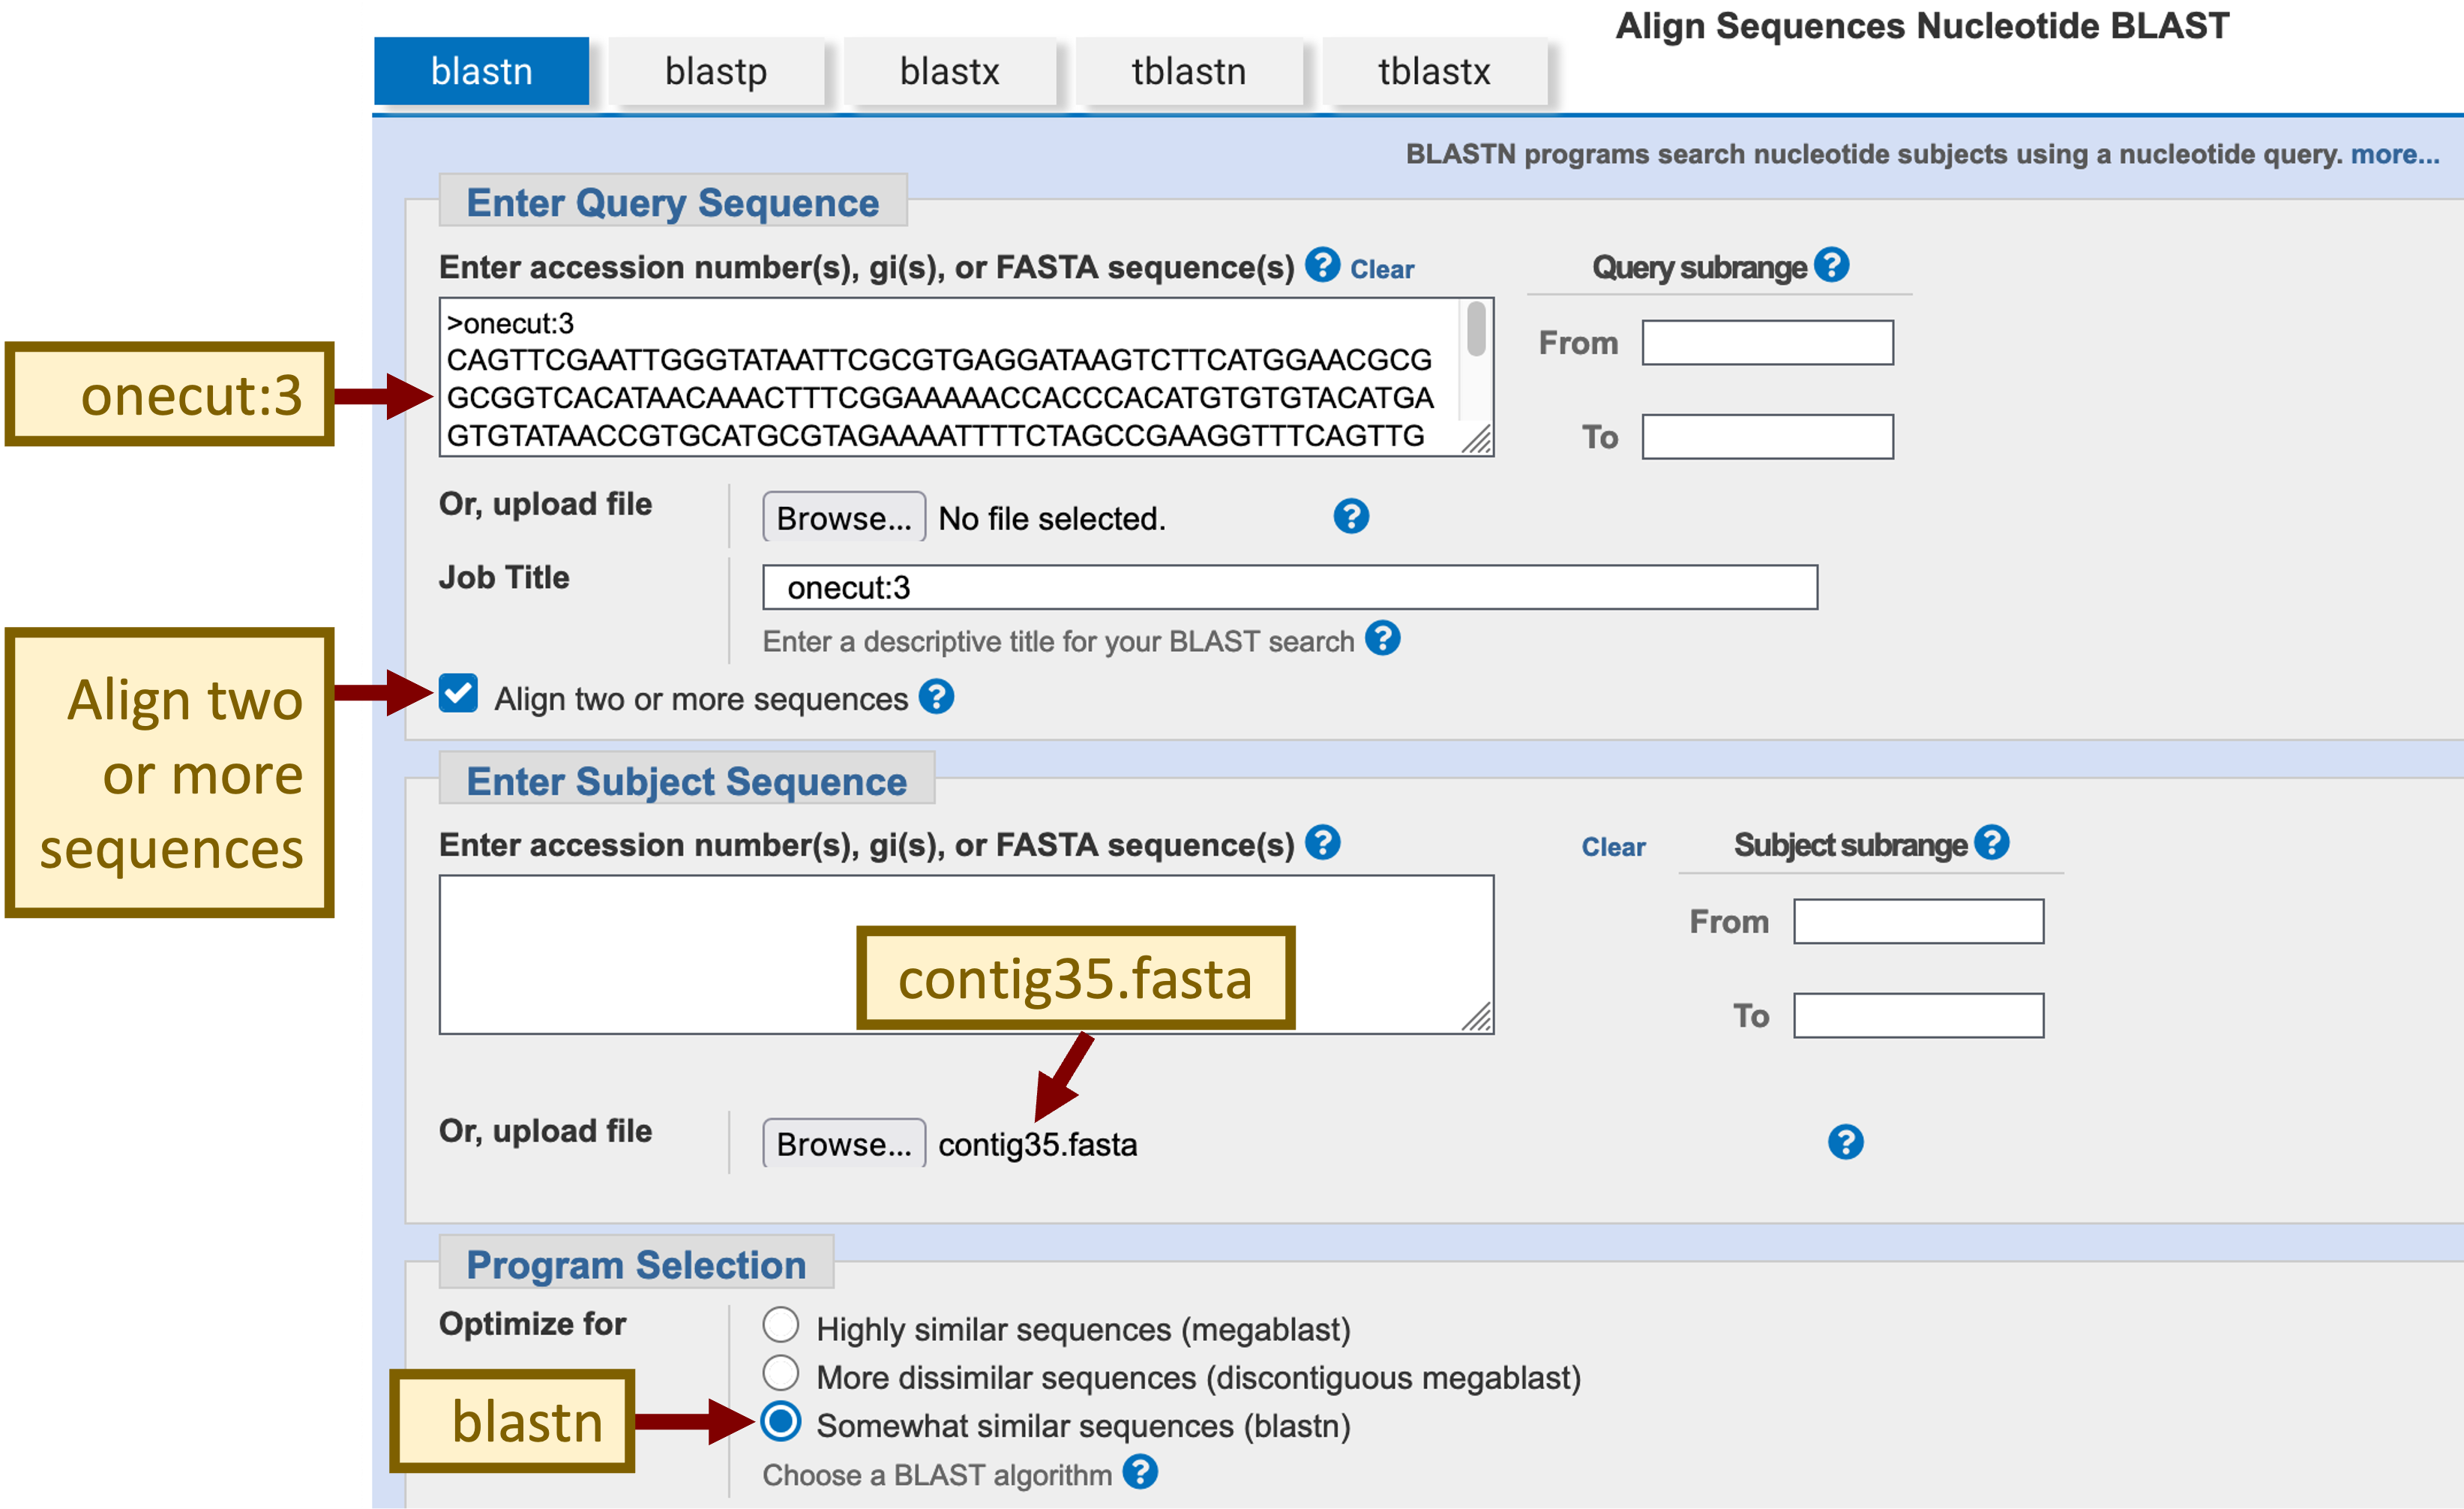
In order to map the untranslated region, we must compare the transcribed exons in the D. melanogaster ortholog against the D. biarmipes genomic sequence at the nucleotide level. Open a new tab on your web browser, navigate to the NCBI BLAST web server and then click on the “Nucleotide BLAST” image under the “Web BLAST” section. Because we are only comparing two sequences against each other, we will select the “Align two or more sequences” checkbox. In addition, because we are performing a cross-species comparison, we will select the option “Somewhat similar sequences (blastn)” under the “Program Selection” section.
We can retrieve the nucleotide sequence for exon onecut:3 using the Gene Record Finder. Go back to the Gene Record Finder tab on your web browser and then select the “Transcript Details” tab for onecut. Verify that you have selected the record for the A isoform of onecut (highlighted in blue in the mRNA Details section) and then click on the first row (with the FlyBase ID 3) of the exon sequence table. Select the sequence in the Sequence viewer window and then copy the sequence onto your clipboard (Figure 10). (For teaching purposes, the onecut:3 sequence is available in the file onecut_exon_3.fasta inside the exercise package).
For the actual GEP annotation projects, we can retrieve the project sequence either from the annotation package (inside the “src” folder) or through the “DNA” link (under the “View” menu) on the GEP UCSC Genome Browser. For teaching purposes, the genomic sequence for the D. biarmipes contig35 project is available in the file contig35.fasta inside the exercise package.
Switch back to the NCBI BLAST tab. Paste the onecut:3 sequence into the textbox under the “Enter Query Sequence” section and then select the contig35.fasta file under the “Enter Subject Sequence” section (Figure 11).
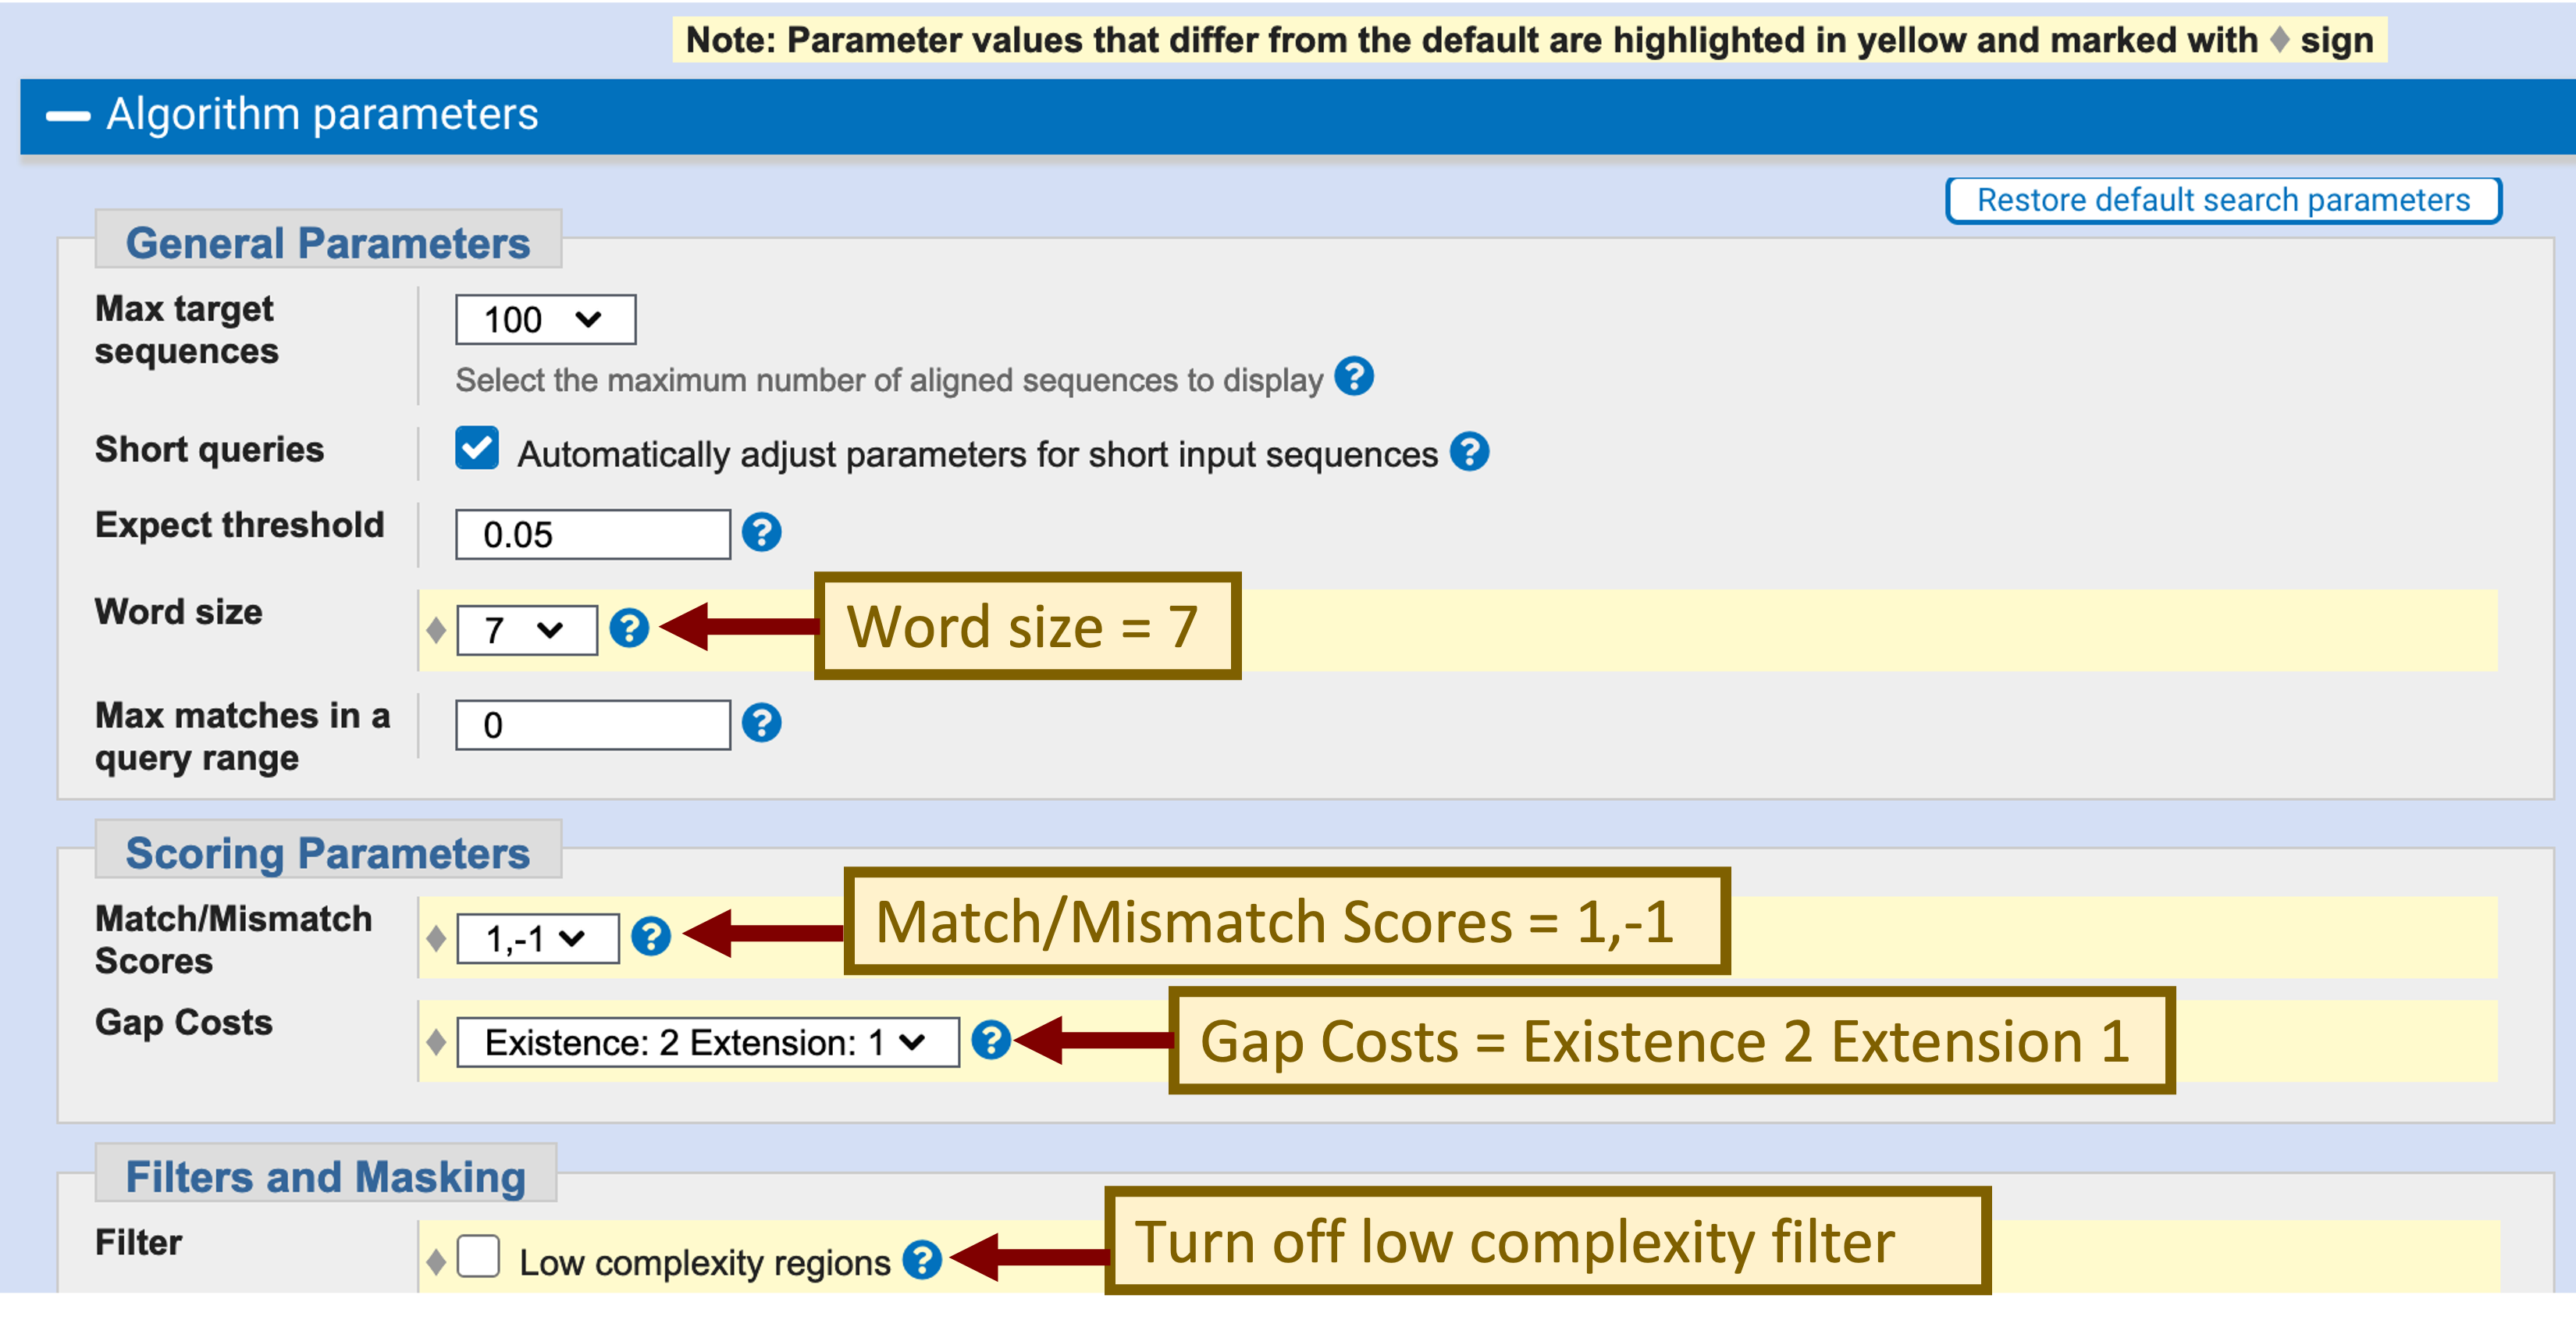
Preliminary analysis indicates that the level of sequence identity between the D. melanogaster untranslated regions and the D. biarmipes genome is ~50–70%. Because the default NCBI blastn search parameters (match: +2, mismatch -3) are optimized to search for sequences with ~90% identity, we need to change the default blastn parameters in order to increase the sensitivity of our search.
Click on the “Algorithm parameters” link to expand this section. Change the “Word size” parameter to 7, the “Match/Mismatch Scores” to “1, -1”, the “Gap Costs” to “Existence: 2 Extension: 1”, and uncheck the filter for “Low complexity regions” (Figure 12). Click on the “BLAST” button to run the search.
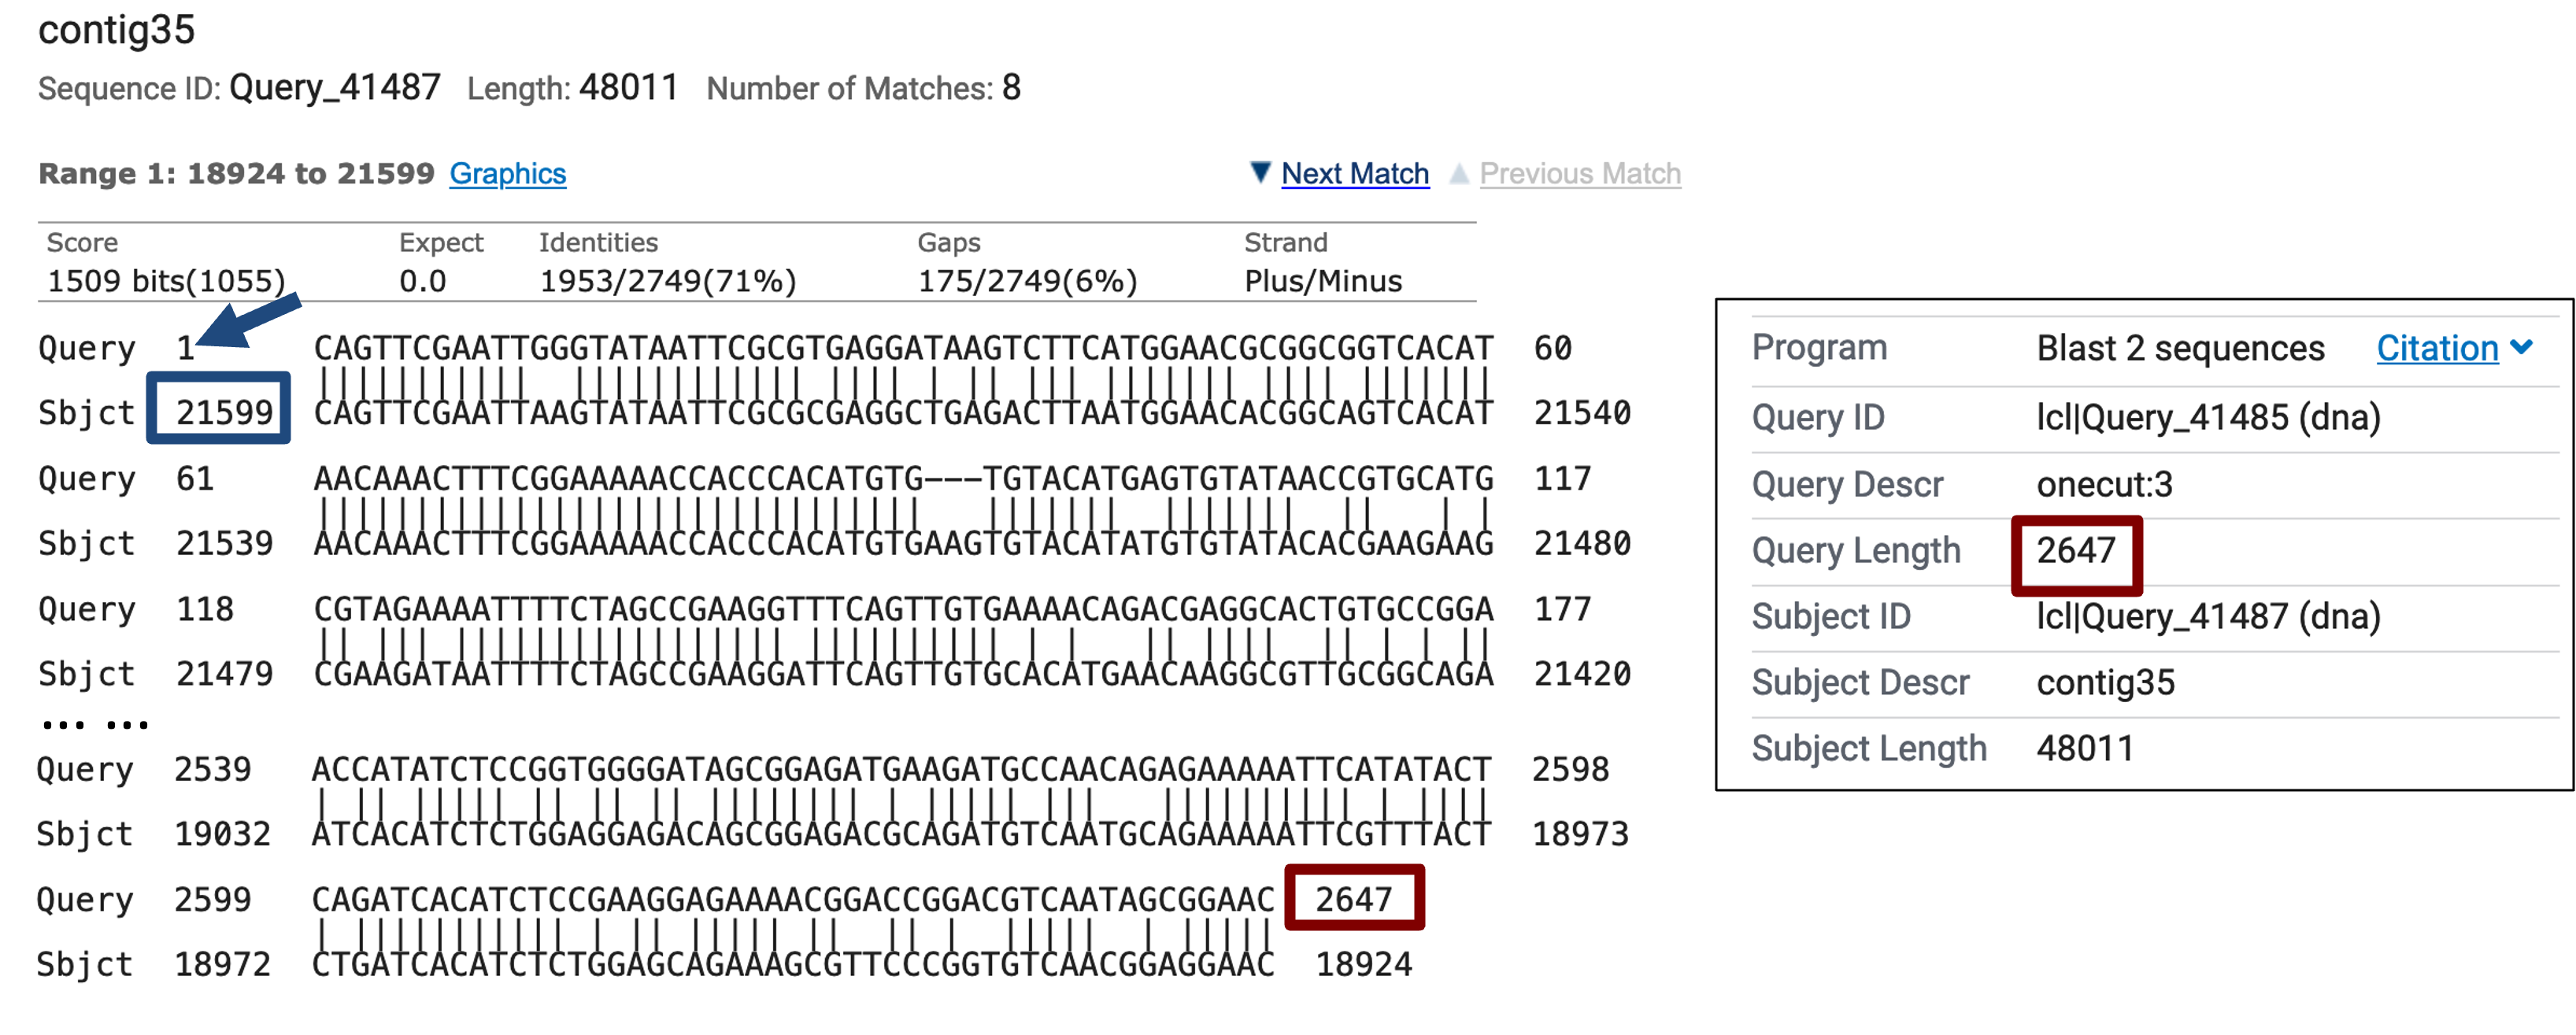
The “Alignments” tab of the search results page shows that the best match reported by blastn spans the entire length of the exon onecut:3 (2,647bp) with 71% sequence identity and places the exon at 21,599–18,924 in the D. biarmipes contig35 (Figure 13). The blastn alignment shows that the beginning of the exon is highly conserved between D. melanogaster and D. biarmipes and it suggests that the TSS for onecut is located at 21,599 in contig35.
Searching for core promoter motifs
To gather additional evidence that would further support the hypothesis that the start of the blastn alignment (i.e., 21,599) corresponds to the TSS of the onecut gene in D. biarmipes, we will search for core promoter motifs using the “Short Match” functionality of the UCSC Genome Browser.
Previous studies have identified sequence motifs that are often found in the vicinity of the TSS (i.e., the core promoter) ([Ohler et al., 2002]; [Juven-Gershon and Kadonaga, 2010]). Some of these core promoter motifs are position and orientation specific. For example, the initiator (Inr) motif is usually found at -2 relative to the TSS while the TATA box motif is found at either -31 or -30 relative to the TSS. Both of these motifs are in the same orientation as the transcript. However, previous analysis in D. melanogaster has also shown that most of the TSSs are not associated with core promoter motifs [Hoskins et al., 2011]. Consequently, while the presence of core promoter motifs provides additional evidence that a region contains a TSS, the absence of core promoter motifs does not imply that a genomic region does not contain a TSS.
In this walkthrough, we will search for the initiator (Inr) motif in our D. biarmipes sequence. Open a new tab and navigate to the Drosophila Core Promoter Motifs web page. This web page contains the consensus sequences for the core promoter motifs that have previously been characterized in D. melanogaster. Select the consensus sequence for the Inr motif (i.e., TCAKTY) and copy it onto the clipboard (Figure 14).
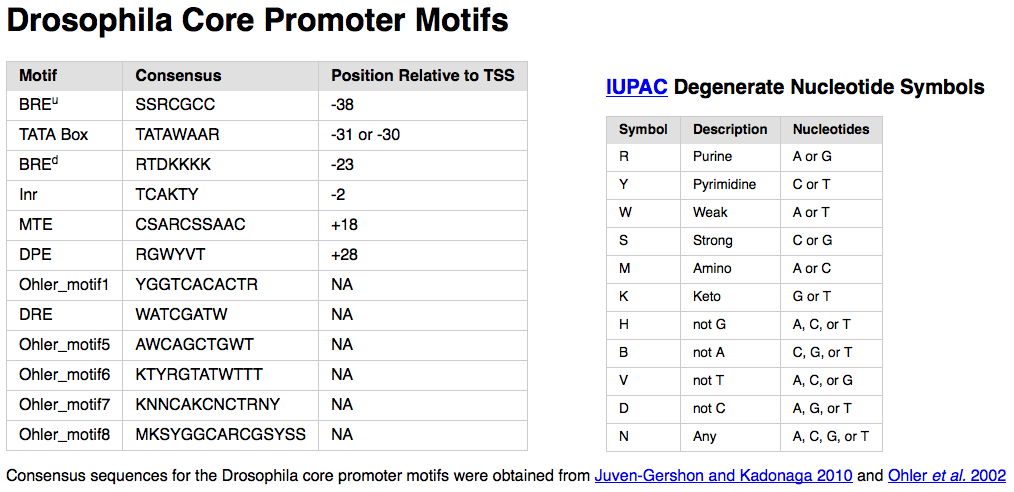
The consensus sequence for the Inr motif contains two degenerate symbols (K and Y) that are defined by the International Union of Pure and Applied Chemistry (IUPAC). These degenerate nucleotide symbols represent two or more nucleotides (Figure 14, right). For example, K (keto) corresponds to either G or T while Y (pyrimidine) corresponds to either C or T. (See the “Nomenclature for Incompletely Specified Bases in Nucleic Acid Sequences” web page for details.)
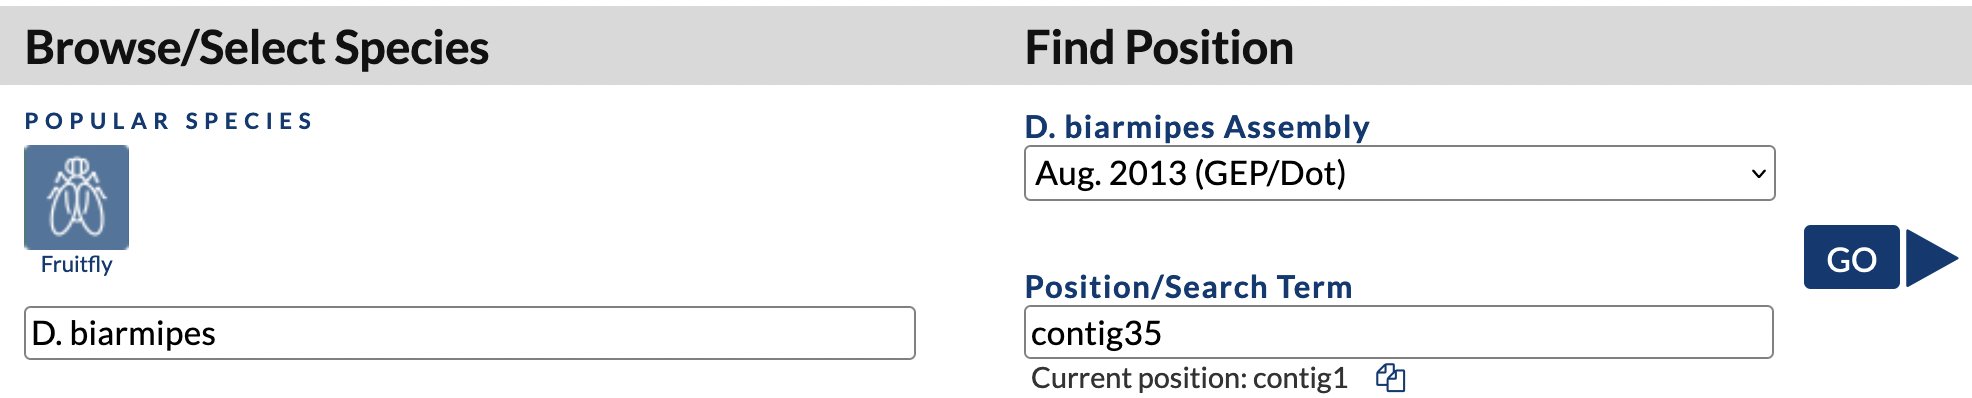
To search for matches to the Inr motif in contig35, open a new tab, navigate to the GEP UCSC Genome Browser and click on the “Genome Browser” link on the left sidebar. Enter “D. biarmipes” into the “Enter species, common name or assembly ID” field. Select “Aug. 2013 (GEP/Dot)” under the “D. biarmipes Assembly” field, and then enter “contig35” into the “Position/Search Term” field (Figure 15). Click on the “GO” button.
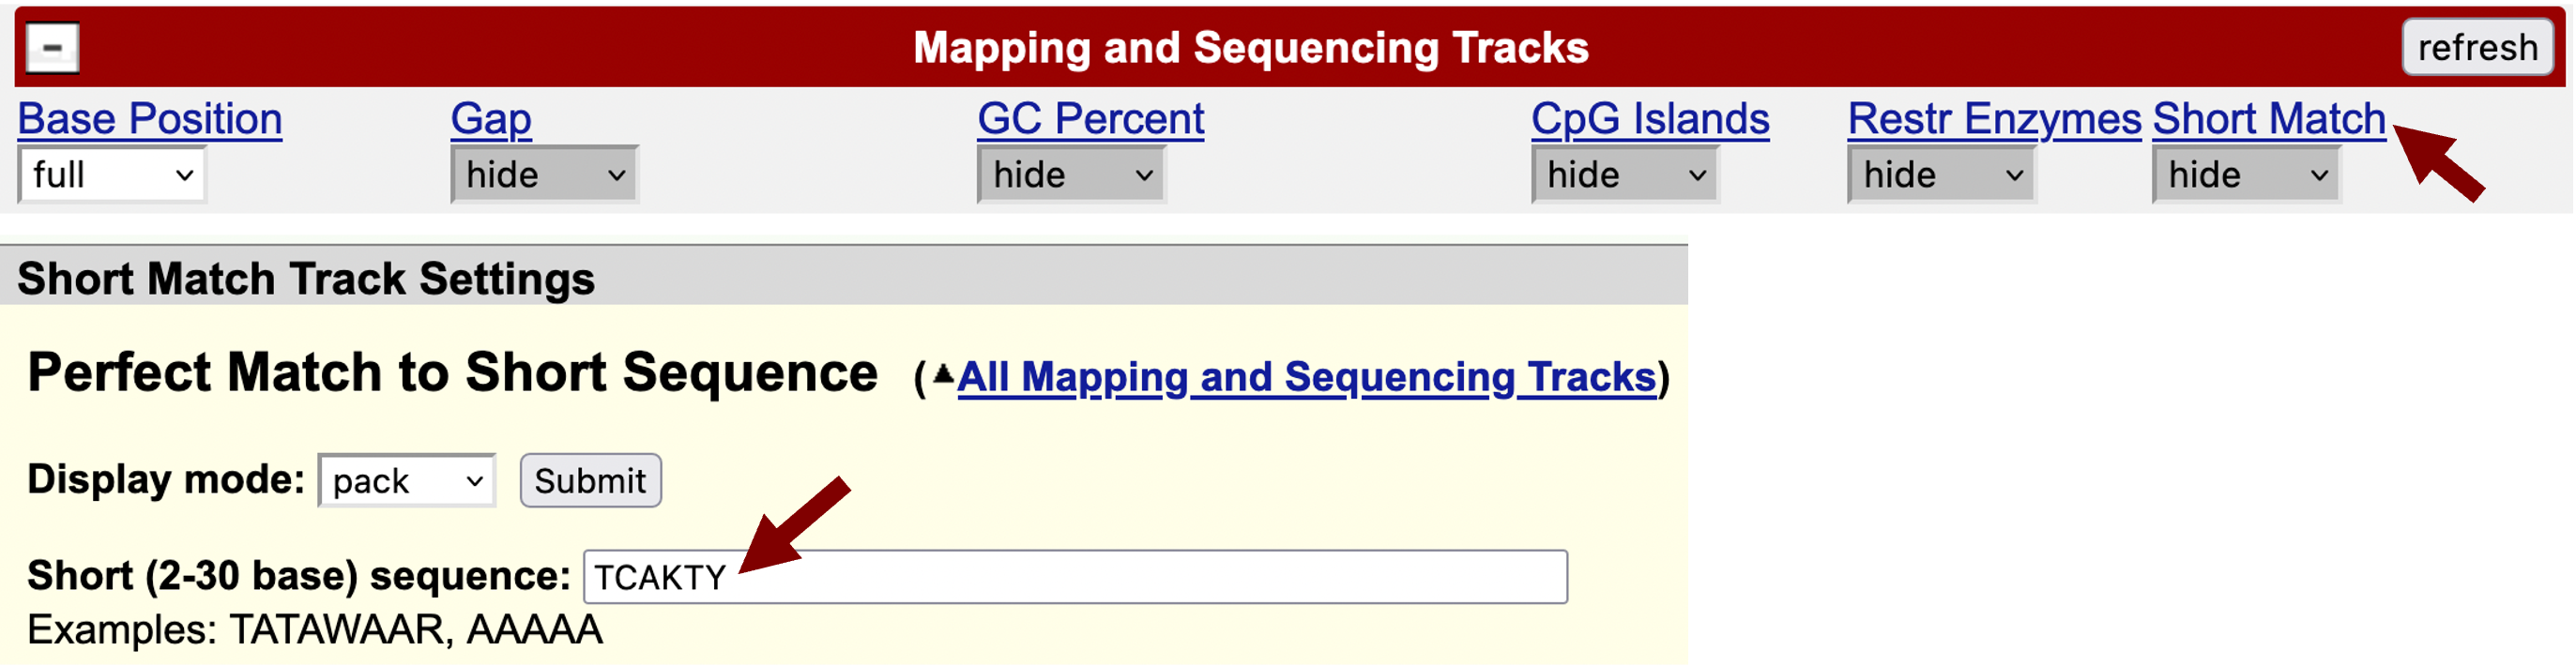
Scroll down to the track configuration section, under “Mapping and Sequencing Tracks” change the “Base Position” to full and then click on the “Short Match” link. Change the “Display mode” field to “pack”, change the “Short (2-30 base) sequence” field to “TCAKTY” and then click “Submit” (Figure 16). Each black rectangle in the “Perfect Matches to Short Sequence (TCAKTY)” track corresponds to the motif instance. The sign (+ or -) next to each bar denotes the orientation of the match while the number denotes the match position.
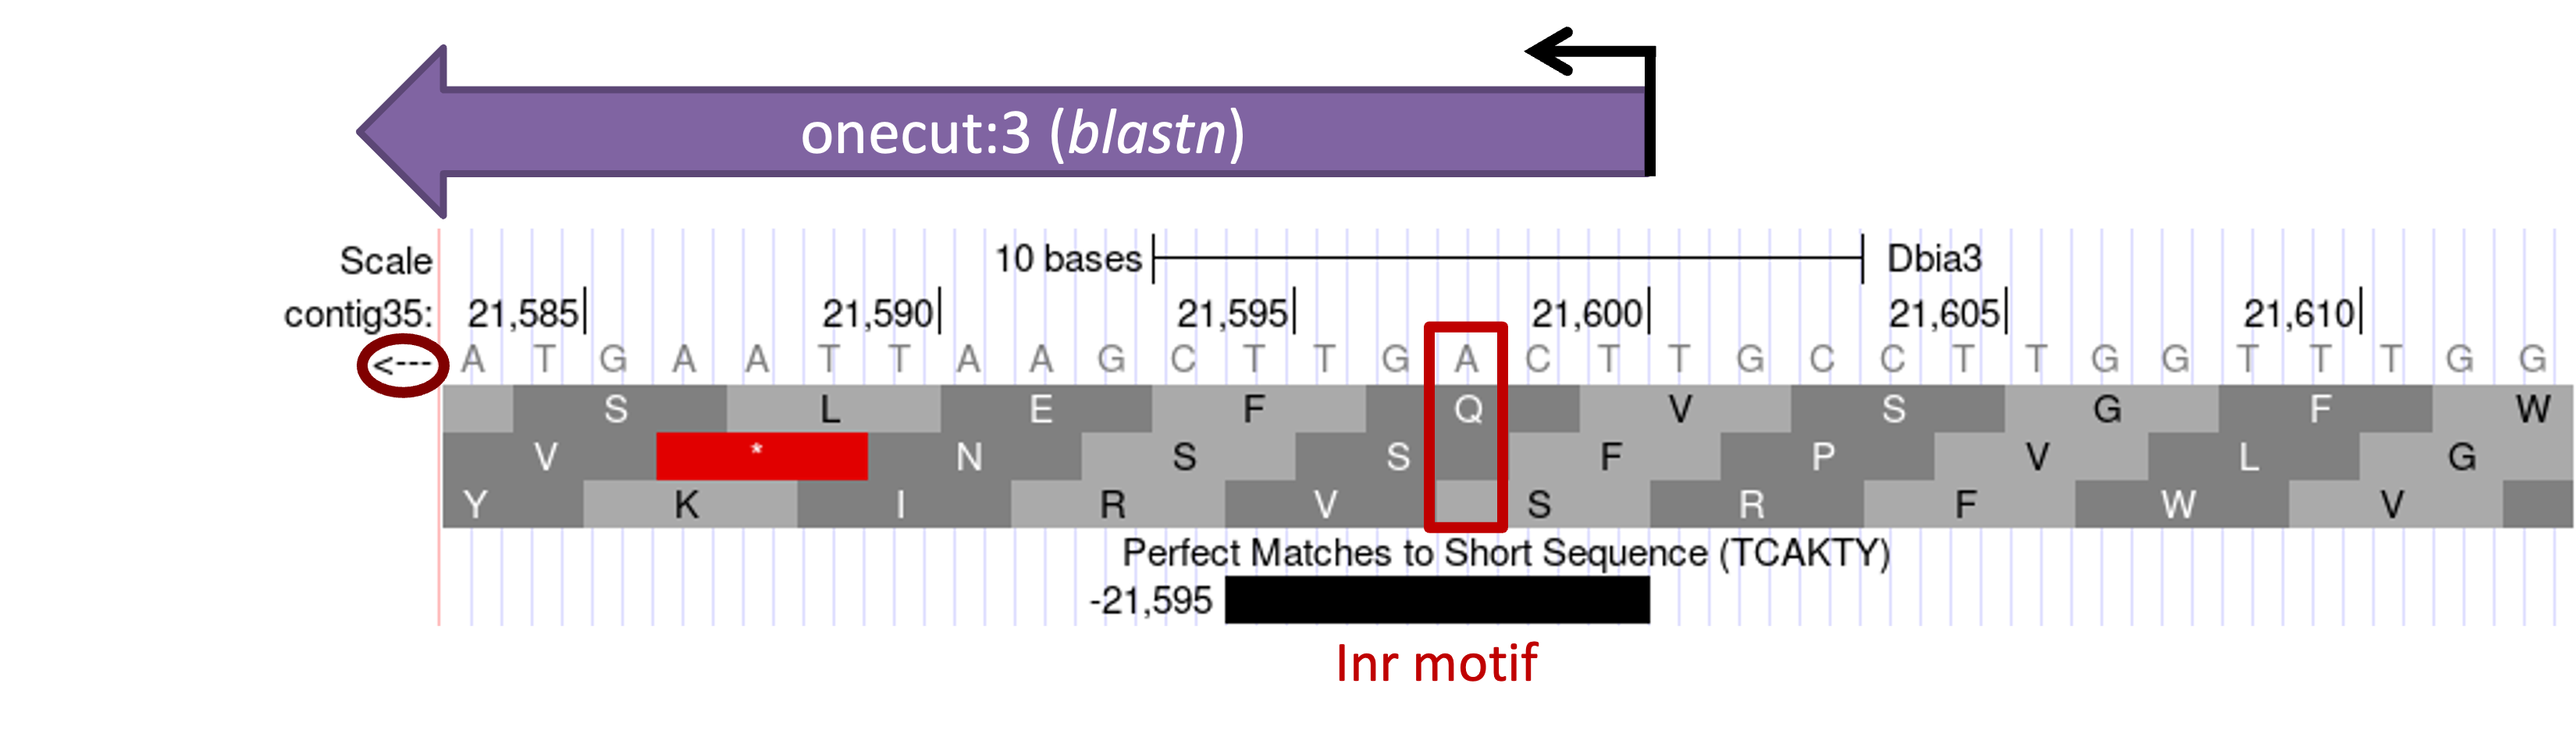
Because the onecut gene is on the minus strand in contig35, the transcription initiator motif (Inr) must also be on the minus strand. We have previously inferred, based on the blastn alignment of the D. melanogaster exon onecut:3 and contig35, that the TSS of onecut is located at 21,599 in contig35. By definition, the Inr motif must overlap with the TSS. Hence, we would expect to find this motif at around 21,599 in contig35. Enter “contig35:21599” into the “chromosome range, or search terms” text box and then click “go”. Zoom out 10x and then zoom out another 3x.
Because the onecut gene is on the minus strand, click on the arrow next to the “Base Position” track to reverse complement the sequence. The Short Match track shows that there is an instance of the Inr motif at 21,595–21,600 in the minus strand that overlaps with the putative TSS. Because the Inr motif is located at -2 relative to the TSS, the Inr motif would place the TSS of onecut at 21,598 instead of 21,599 (Figure 17). This result is consistent with our previous observations of the D. melanogaster RAMPAGE data, which shows two strong TSS for onecut at 607,648 and 607,649 (Figure 6). To gather additional evidence in support of the TSS annotation, we should apply the same procedure to search for other core promoter motifs surrounding this TSS. (In this case, none of the other core promoter motifs support this TSS annotation.)
Based on sequence conservation with the D. melanogaster exon onecut:3, we have defined a TSS position for the D. biarmipes ortholog of onecut at 21,599 in contig35. However, the placement of the Inr motif and the higher RAMPAGE read density at 607,648 compared to 607,649 in D. melanogaster suggests that there might be another TSS at 21,598 that is stronger than the TSS at 21,599 in the D. biarmipes ortholog of onecut. Based on parsimony with D. melanogaster, we will place the TSS of the D. biarmipes ortholog of onecut at 21,599 so that both TSS are part of the D. biarmipes gene model.
Given the prevalence of broad promoters, we should also examine other evidence tracks to determine if there are any additional TSS in the surrounding region. We could often use the RNA-Seq data and sequence conservation among multiple Drosophila species to define a TSS search region. The GEP has also produced RNA Polymerase II (RNA PolII) ChIP-Seq data for D. biarmipes, D. elegans, D. ficusphila, D. eugracilis, and D. takahashii that could be used to define the TSS search region. Regions that are significantly enriched in RNA PolII are shown in the “RNA PolII Peaks” track while the levels of RNA PolII enrichment compared to input DNA are shown in the “RNA PolII Enrichment” track.
In order to examine the genomic region surrounding the putative TSS, enter “contig35:21400-21800” into the “chromosome range, or search terms” text box and then click on the “go” button. Click on the “hide all” button. Change the display modes for the evidence tracks listed below and then click on the “refresh” button.
-
Under “Mapping and Sequencing Tracks”:
-
Base Position: dense
-
Short Match: pack
-
-
Under “RNA Seq Tracks”:
-
RNA-Seq Alignment Summary: show
-
-
Under “Expression and Regulation”:
-
RNA PolII Peaks: dense
-
RNA PolII Enrichment: full
-
-
Under “Comparative Genomics”:
-
Conservation: full
-
Most Conserved: dense
-
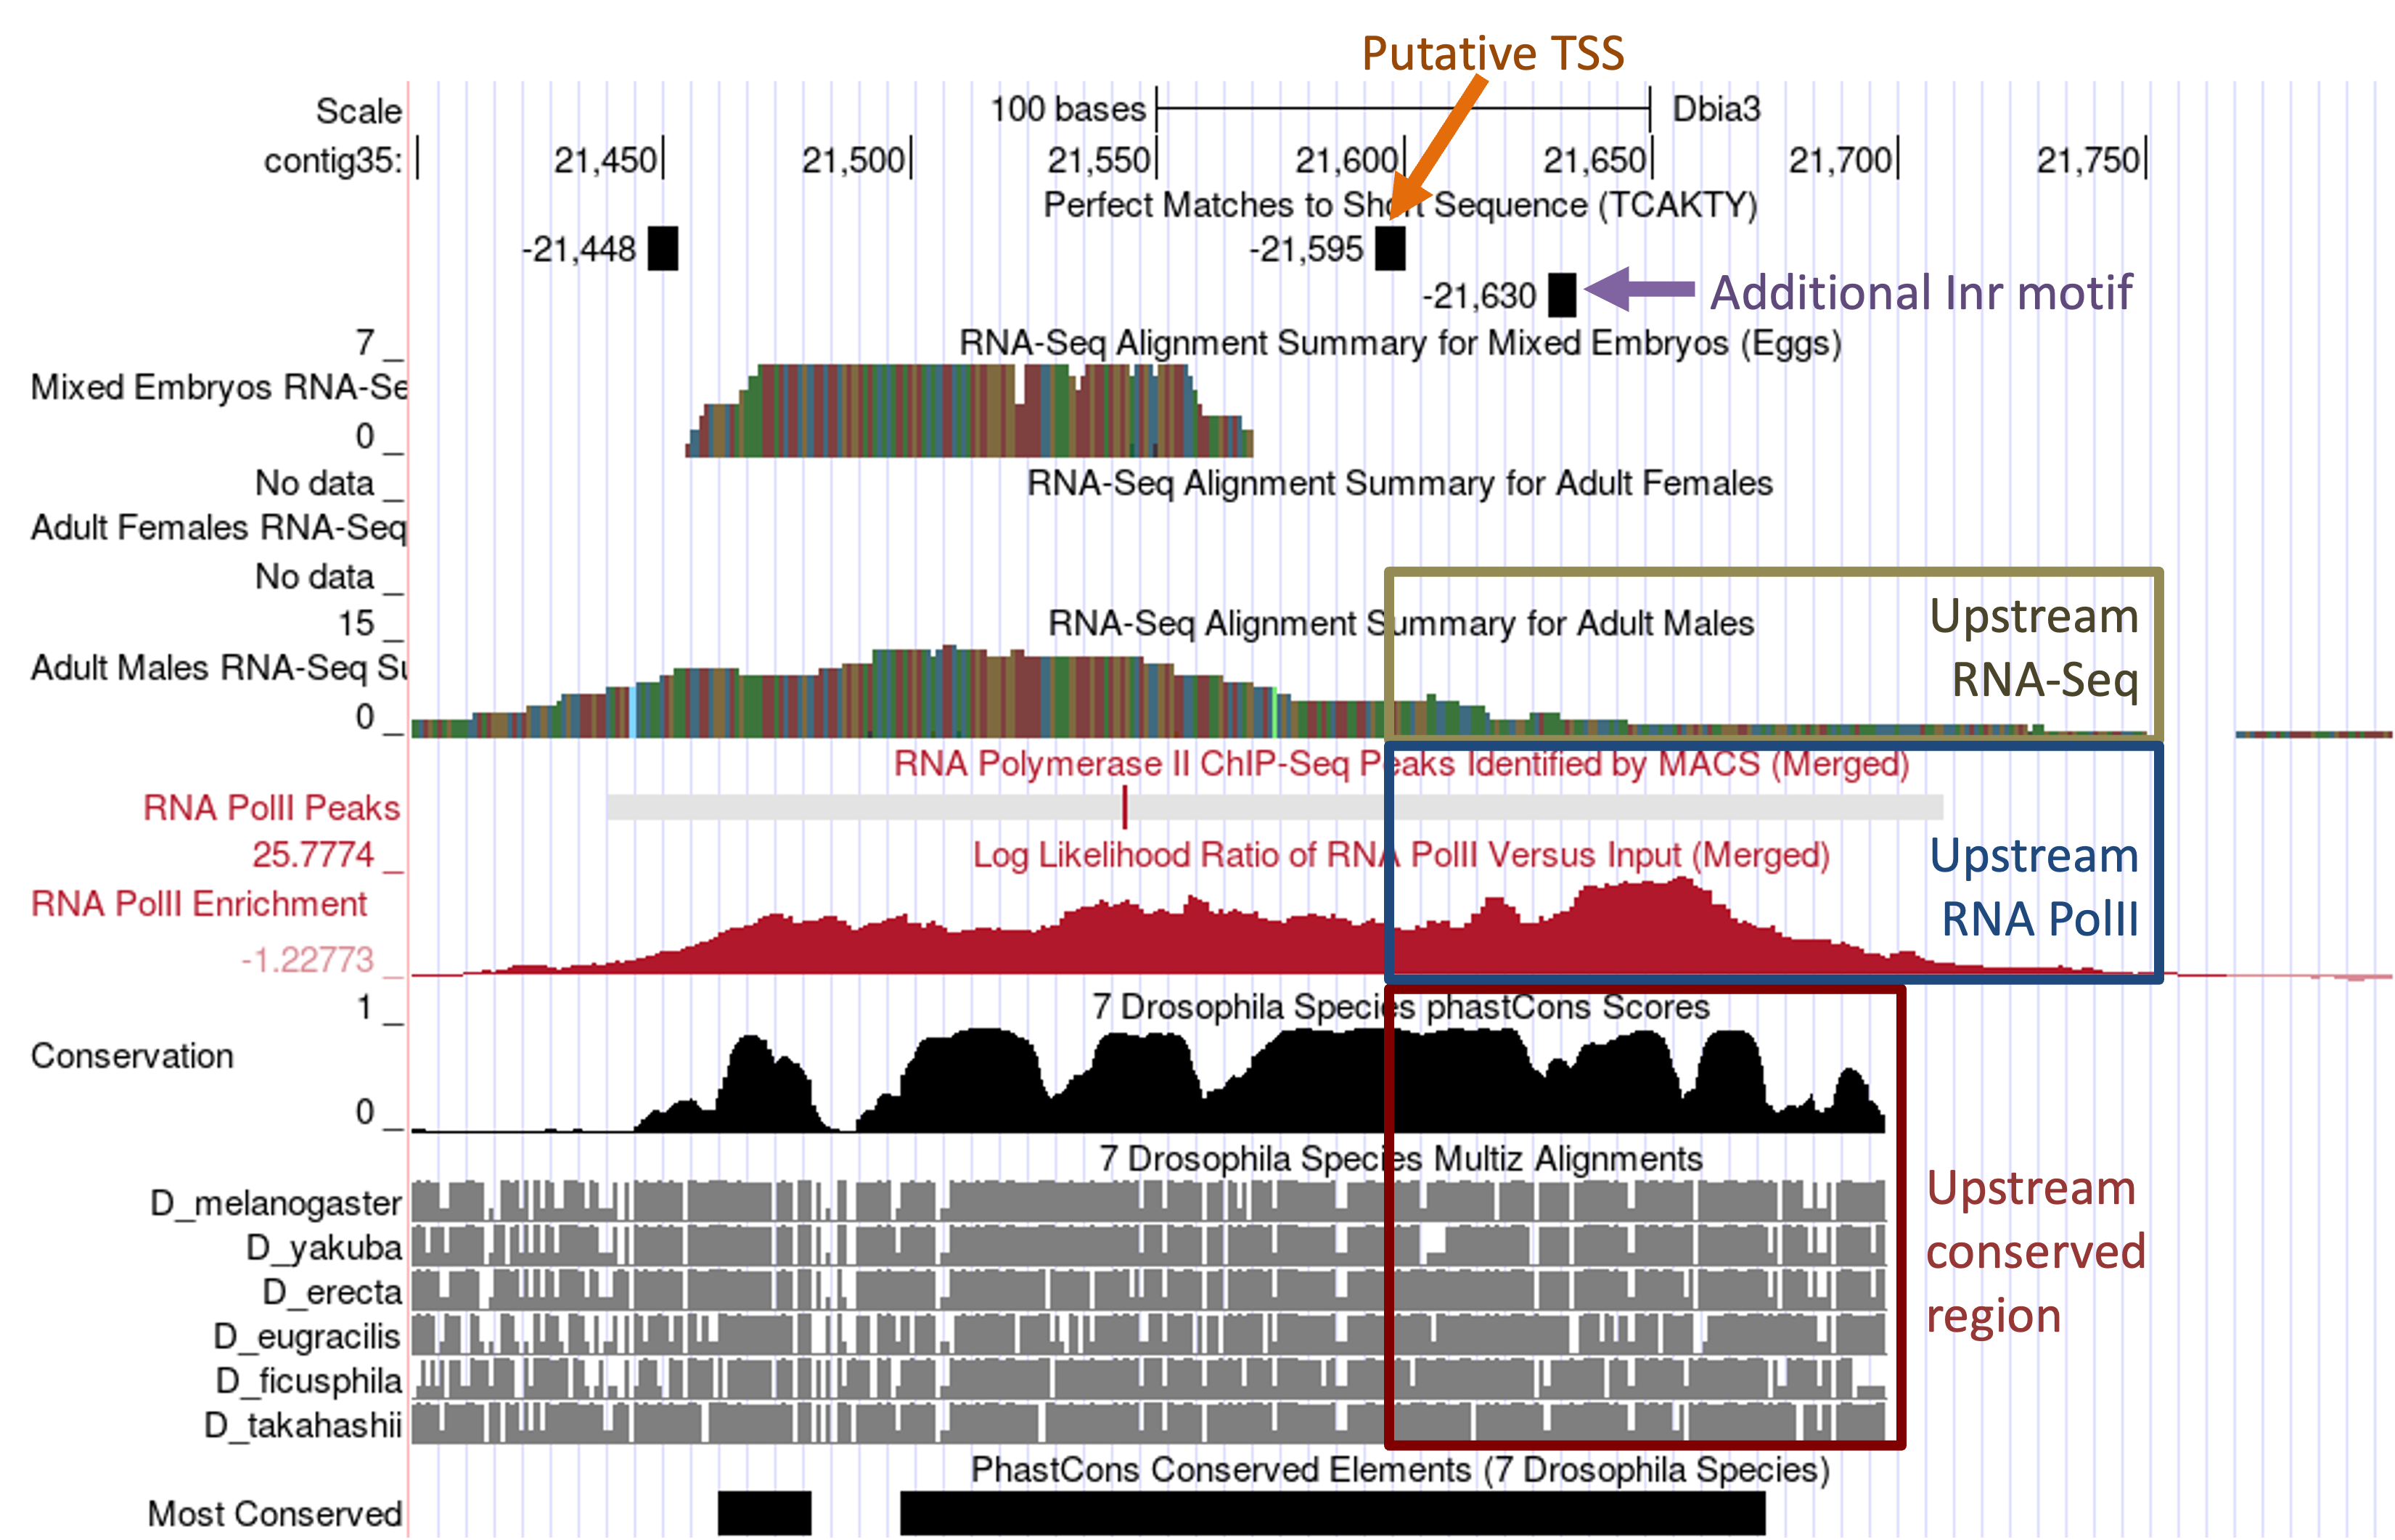
Examination of these evidence tracks indicates that there might be additional TSS located upstream of the putative TSS at 21,599. The RNA PolII peak identified by the MACS2 program spans from 21,440–21,709 and the RNA PolII enrichment track shows that the region upstream of the putative TSS at 21,599 is highly enriched in RNA PolII. Furthermore, the “Conservation” and the “Most Conserved” tracks show that the region at 21,600–21,697 is highly conserved among seven Drosophila species. This region also shows low levels of RNA-Seq read coverage from the adult males sample that extends to 21,750 and there is an Inr motif at 21,630 (Figure 18). Consequently, based on the extent of the RNA PolII and RNA-Seq data, we will define a TSS search region from 21,599 to 21,750.
In addition to annotating the TSS position and defining the TSS search region, we also need to document the core promoter motif instances surrounding the TSS (±300bp) in the D. biarmipes project and in the TSS of the D. melanogaster ortholog as part of the TSS annotation report. We can use the Short Match functionality of the Genome Browser to perform this search in both D. biarmipes and D. melanogaster. (See the sample TSS report for the locations of all the core promoter motif instances surrounding the annotated TSS.)
Identify the TSS for the D. biarmipes Eph ortholog
The putative ortholog of Eph is located next to onecut in the D. biarmipes contig35 project. We will apply the strategy described above to annotate the TSS of Eph in D. biarmipes.
Determine the shape of the core promoter of Eph
Similar to the analysis of the TSS of onecut, the first step of the analysis is to classify the type of core promoter for the Eph gene in D. melanogaster. Select the web browser tab with the GEP UCSC Genome Browser for D. melanogaster. Enter “Eph” into the “chromosome range, or search terms” text box and then click on the “go” button. Click on the “Eph-RA” link underneath the “FlyBase Protein-Coding Genes” header.
Zoom out 1.5x and then click on the “hide all” button. Change the display modes for the evidence tracks listed below and then click on the “refresh” button.
-
Under “Chromatin Domains”:
-
BG3 9-state (R5): dense
-
S2 9-state (R5): dense
-
-
Under “Genes and Gene Prediction Tracks”:
-
FlyBase Genes: pack
-
-
Under “Expression and Regulation”:
-
Detected DHS Positions (Cell Lines) (R5): pack
-
DHS Read Density (Cell Lines) (R5): full
-
TSS (Celniker) (R5): pack
-
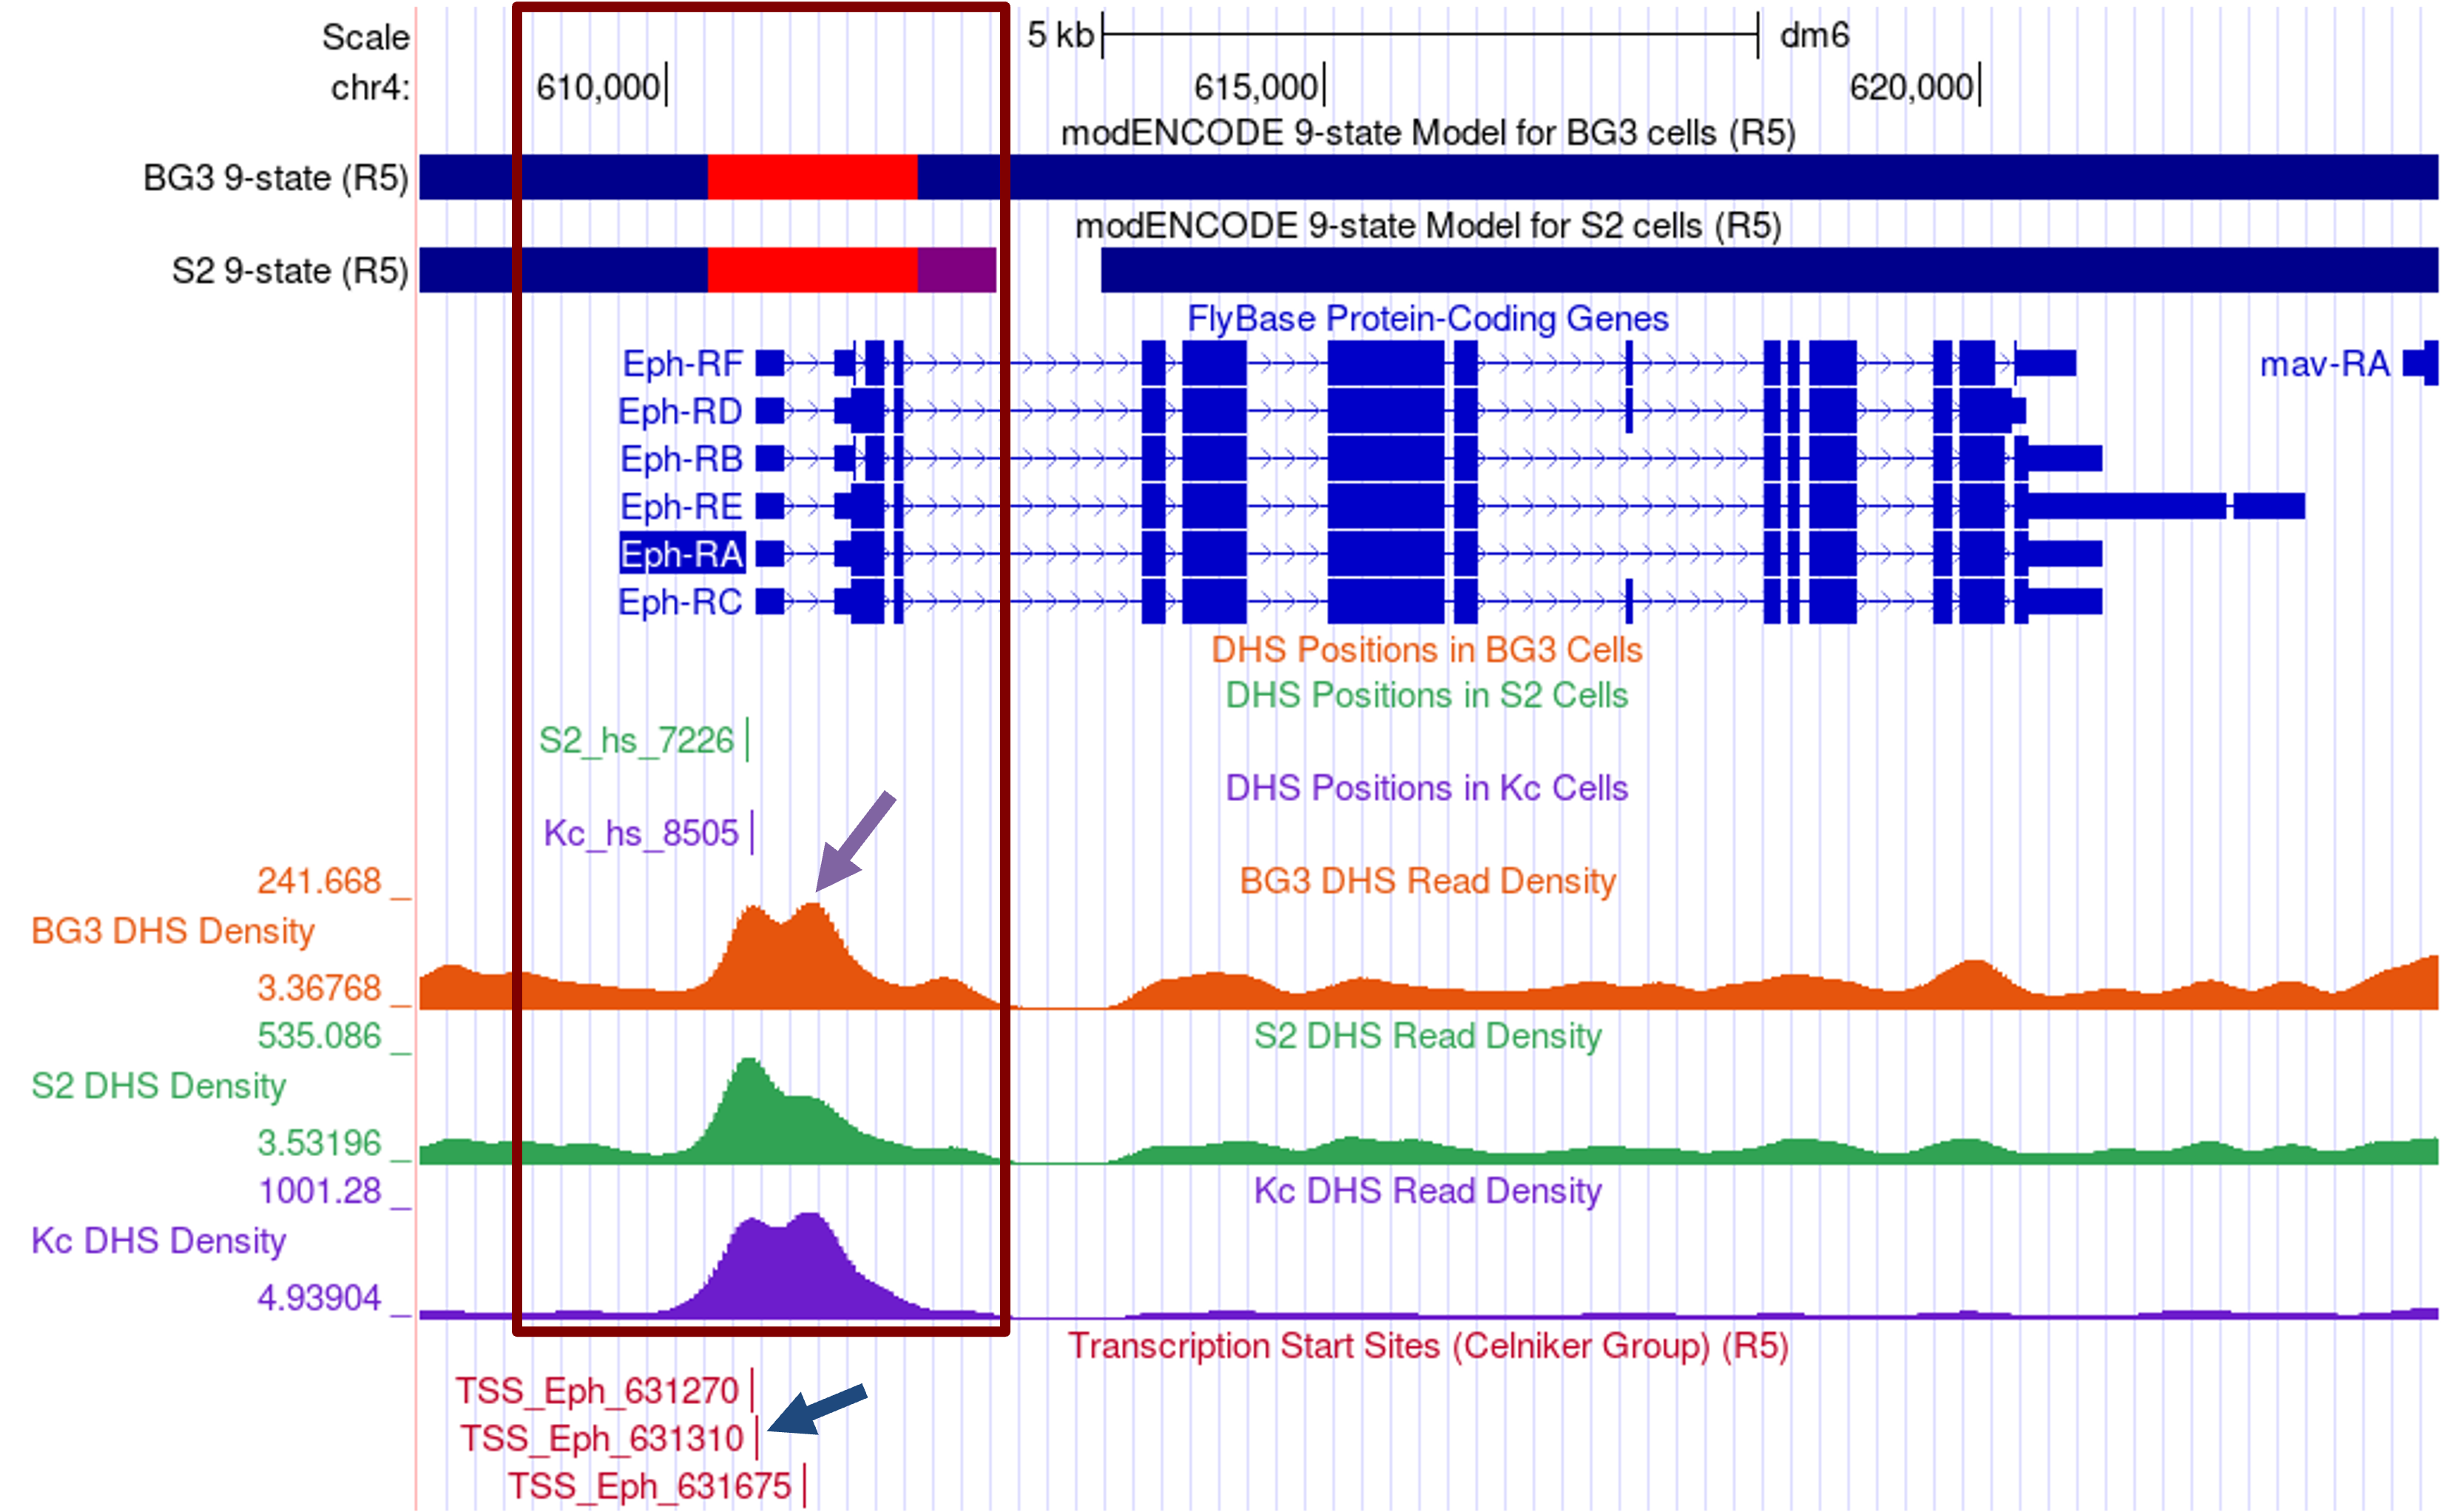
The Genome Browser view shows that the Eph gene has six different isoforms (A–F) in D. melanogaster, but all of the isoforms have the same TSS. The modENCODE 9-state models indicate that the epigenomic landscape at the 5' end of Eph (at ~610,000–613,000) is conducive to transcription in both BG3 and S2 cells (Figure 19); this region is in either the red (i.e., promoter and TSS) or the purple (i.e., transcription elongation) states.
There are also significant DHS positions in S2 and Kc cells near the TSS annotated by FlyBase. While the DHS positions track for the BG3 cells did not show a significant DHS, the BG3 DHS read density track shows that this region has a higher DHS read density (i.e., it is more accessible) than the rest of the gene body.
Examination of the “TSS (Celniker)” track shows that TSS_Eph_631310 overlaps with the start of the Eph transcripts (Figure 19, blue arrow). There is also one TSS upstream (TSS_Eph_631270) and one TSS downstream (TSS_Eph_631675) of the first exon.
Given the presence of a single DHS position and multiple TSS, the core promoter of Eph would normally be classified as an intermediate promoter. However, the DHS read density tracks for BG3, S2, and Kc cells show two distinct peaks that are adjacent to each other (Figure 19, purple arrow).
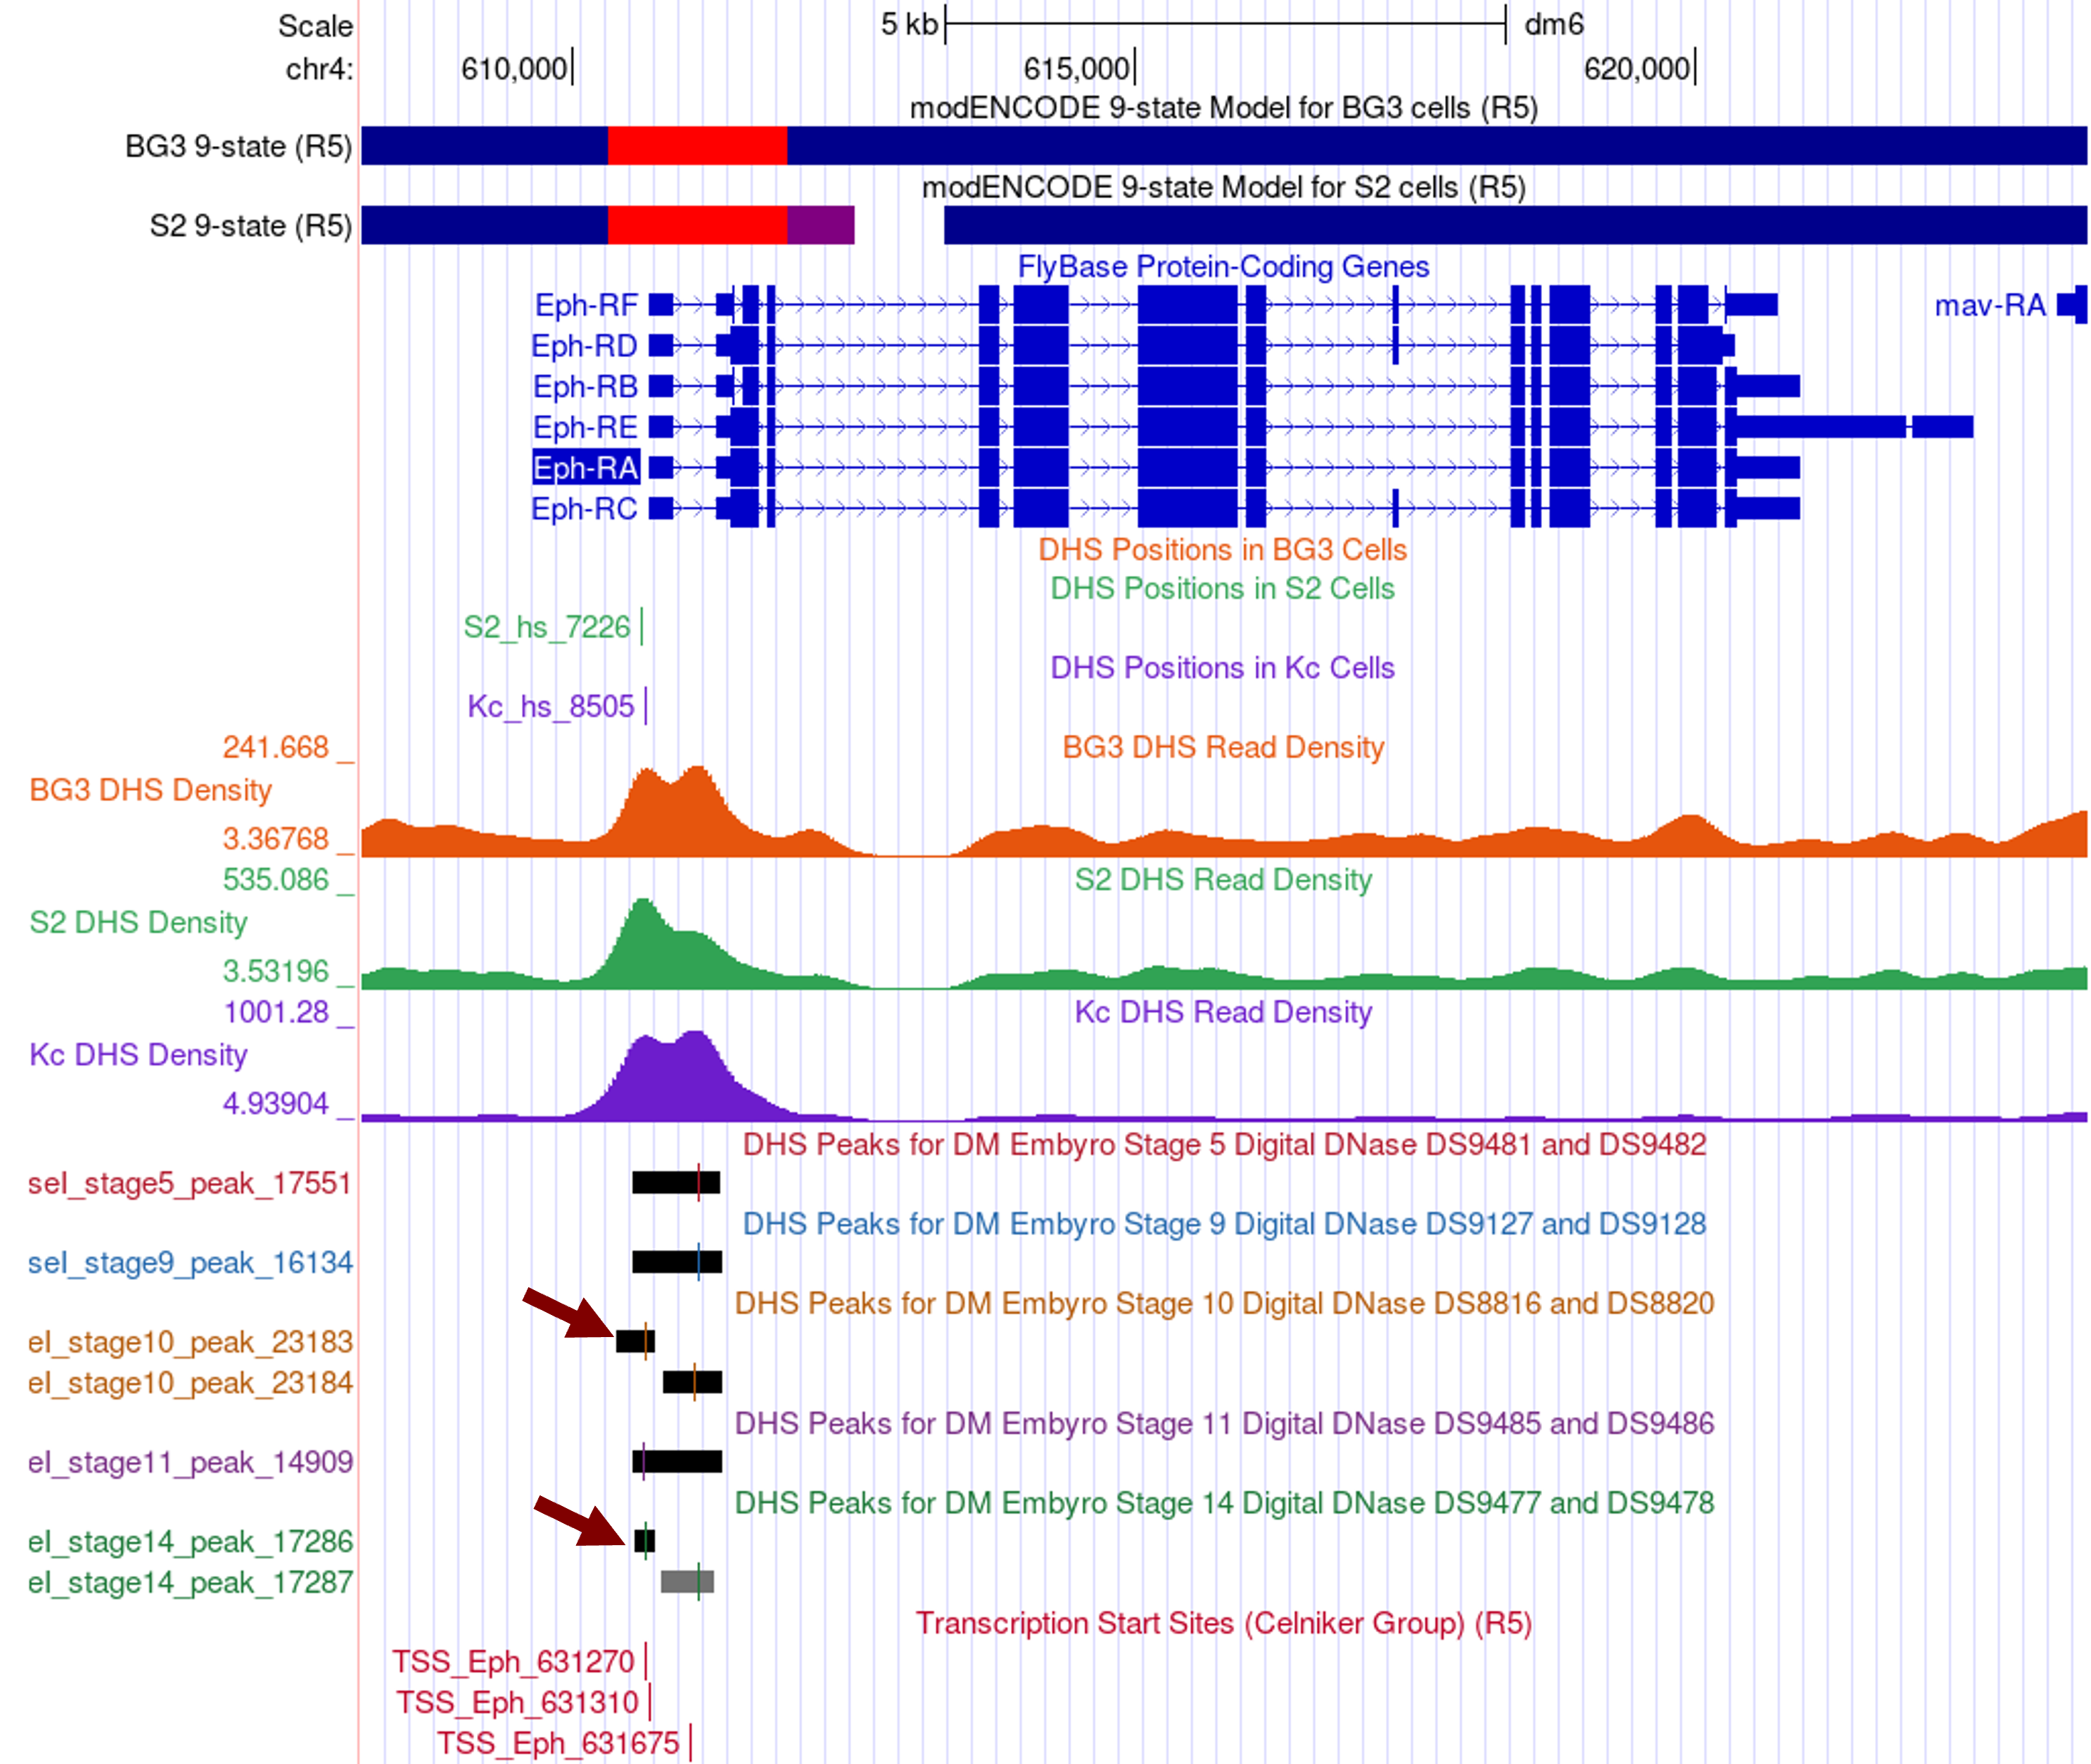
Examination of additional DHS datasets from the five embryonic stages [available through the “Detected DHS Positions (Embryos) track”] show that there are two distinct DHS peaks in stages 10 and 14 of embryonic development (Figure 20, red arrows).
Collectively, the available data suggests there is a broad region surrounding the TSS of Eph that is accessible for active transcription. Hence, within the spectrum of shapes of the core promoters, the TSS of Eph is closer to being a broad promoter than a peaked promoter.
Determine the exon structure of the D. melanogaster Eph gene
The next step of the analysis is to use blastn to map the initial 5' untranslated exon of Eph to the D. biarmipes contig35 sequence. Using the strategy described above, we will use the Gene Record Finder to determine the exon structure of Eph in D. melanogaster.
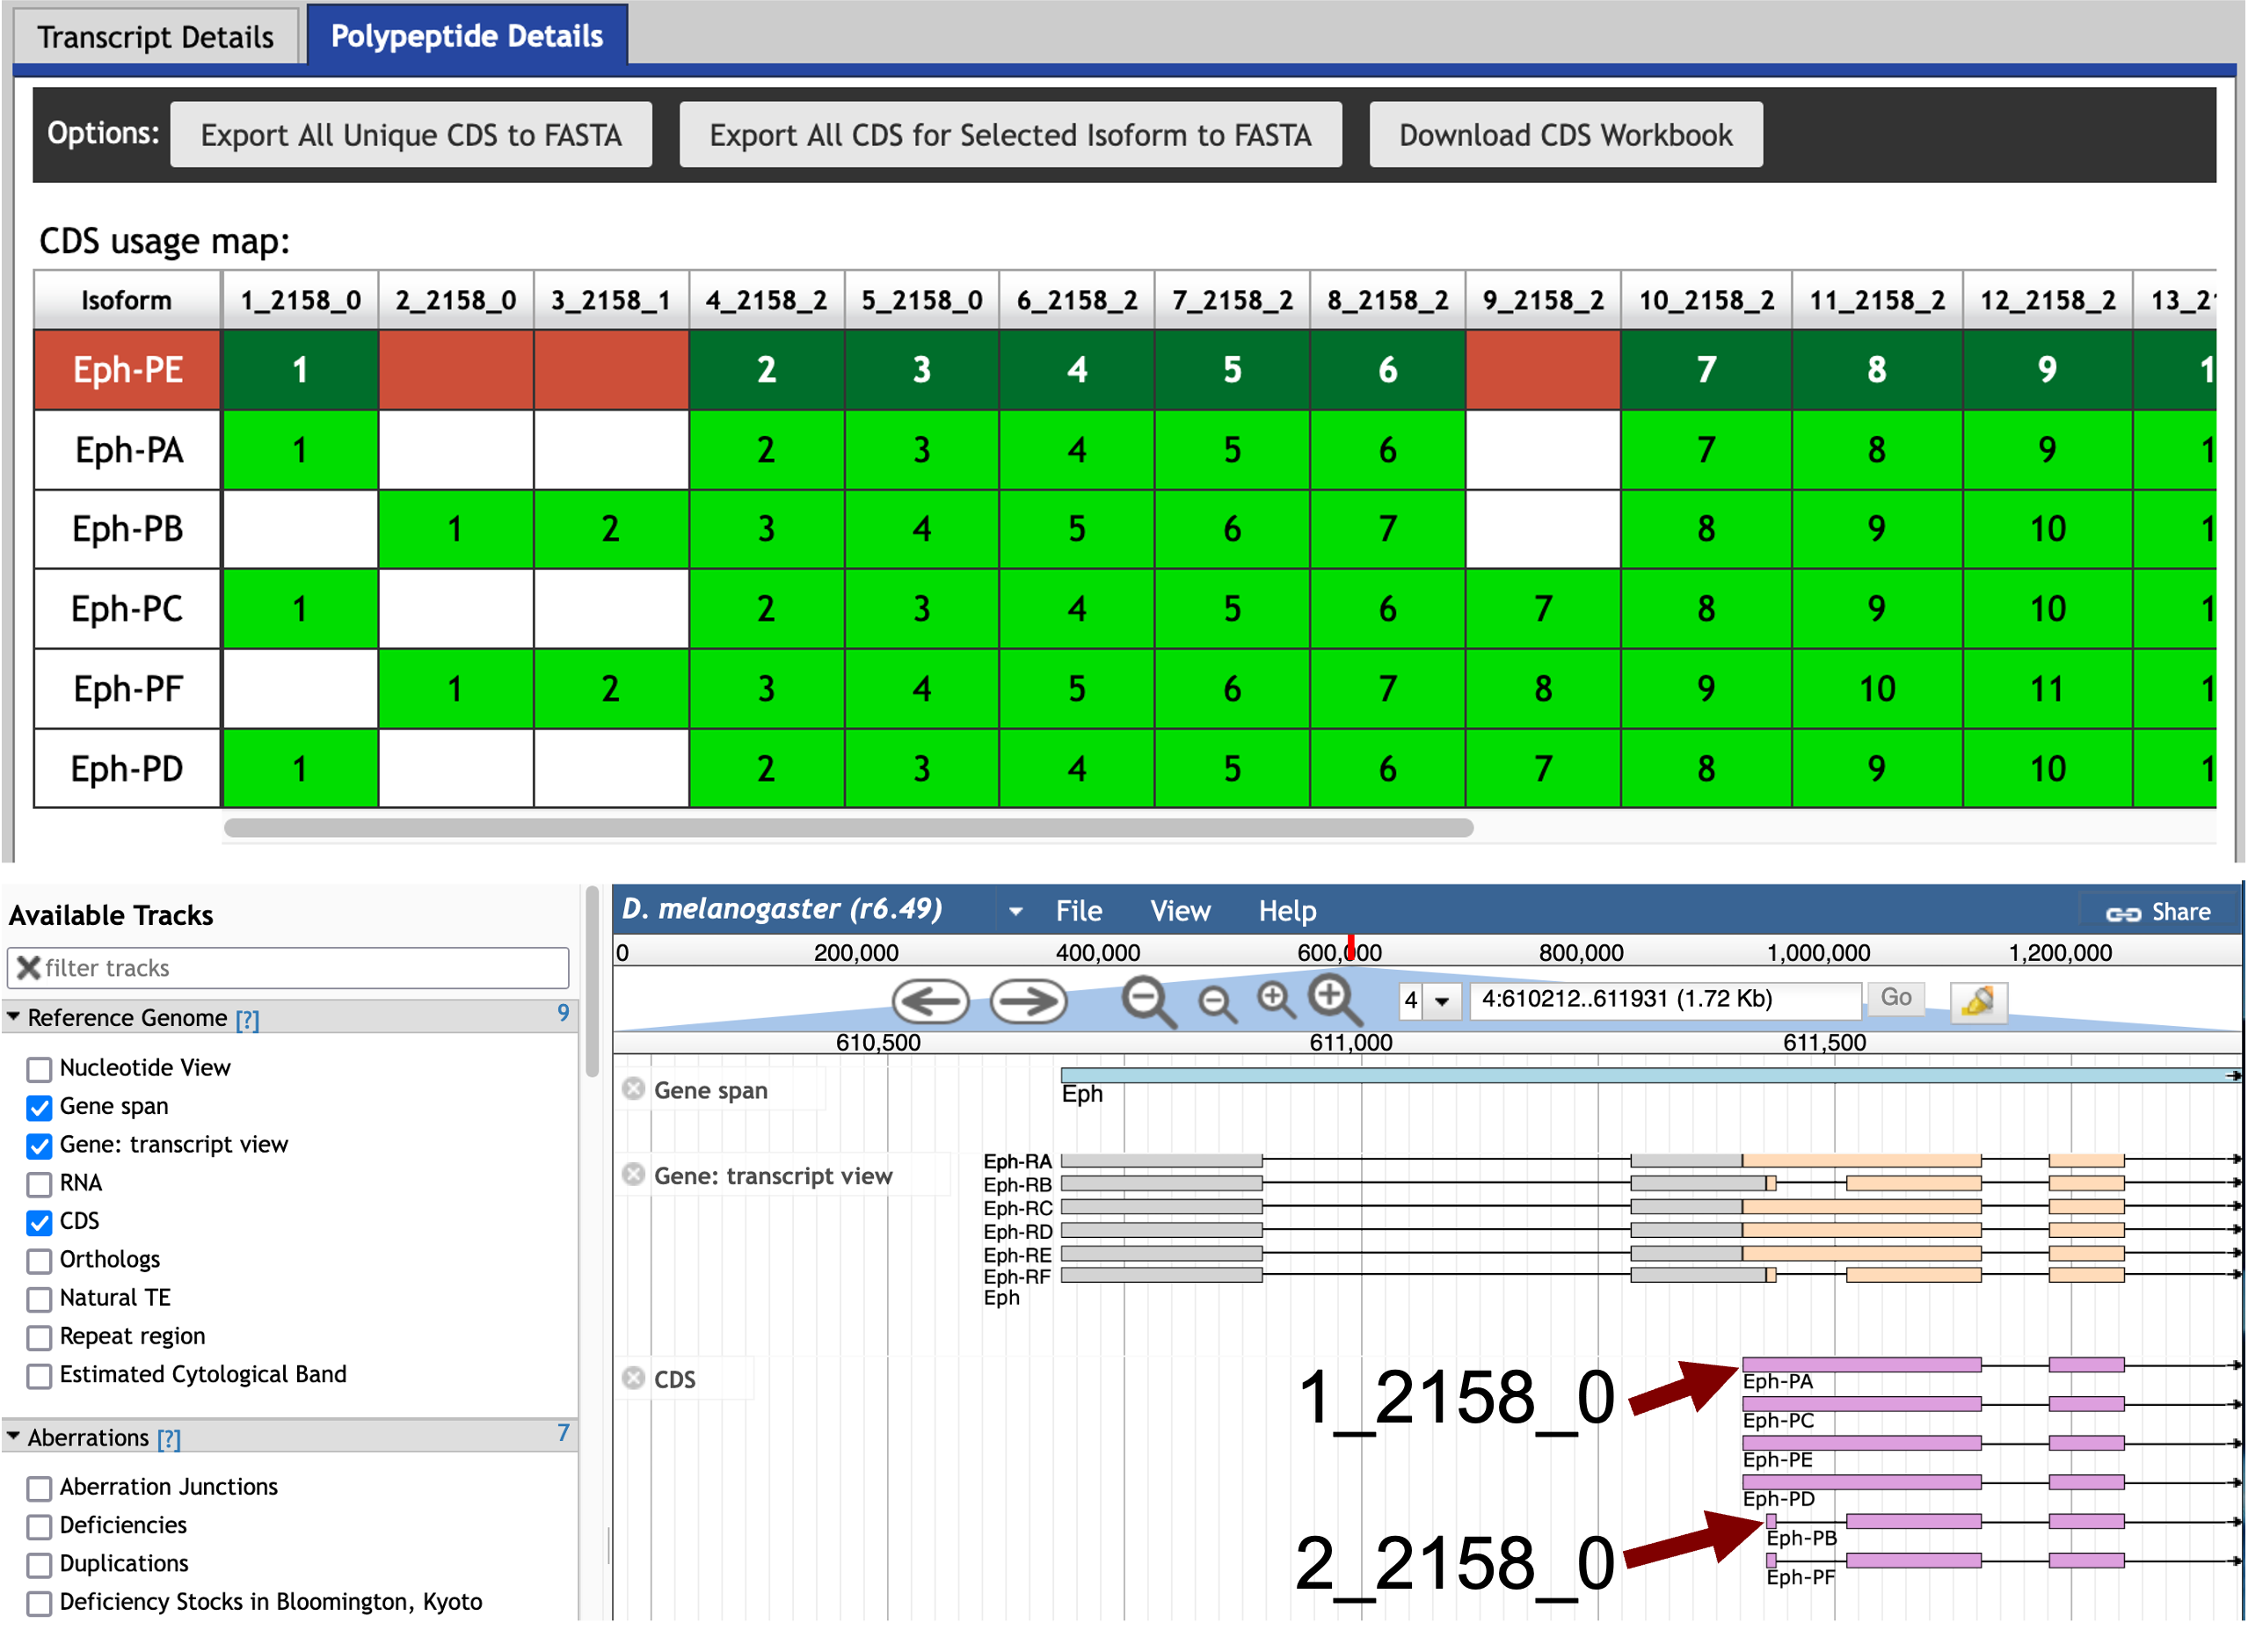
Select the web browser tab with the Gene Record Finder and search for the Eph gene record. The “Polypeptide Details” tab shows that CDS 1_2154_0 is the initial coding exon of the A, C, D, and E isoforms and CDS 2_2154_0 is the initial coding exon of the B and F isoforms (Figure 21, top). Examination of the placement of these CDS’s using FlyBase JBrowse shows that CDS 2_2154_0 is found within the larger CDS 1_2154_0 (Figure 21, Bottom).
|
|
In order to see the locations of the coding exons in JBrowse, you will need to select the checkbox for the “CDS” track under the “Reference Genome” section of the “Available Tracks” panel. |
For the purpose of this walkthrough, we have previously placed CDS 1_2154_0 at 29,131–29,383 in contig35, and the coding exon is on the positive strand. This means that the initial 5' untranslated exon is located upstream of 29,131 in contig35.
Mapping the initial transcribed exon of Eph with blastn
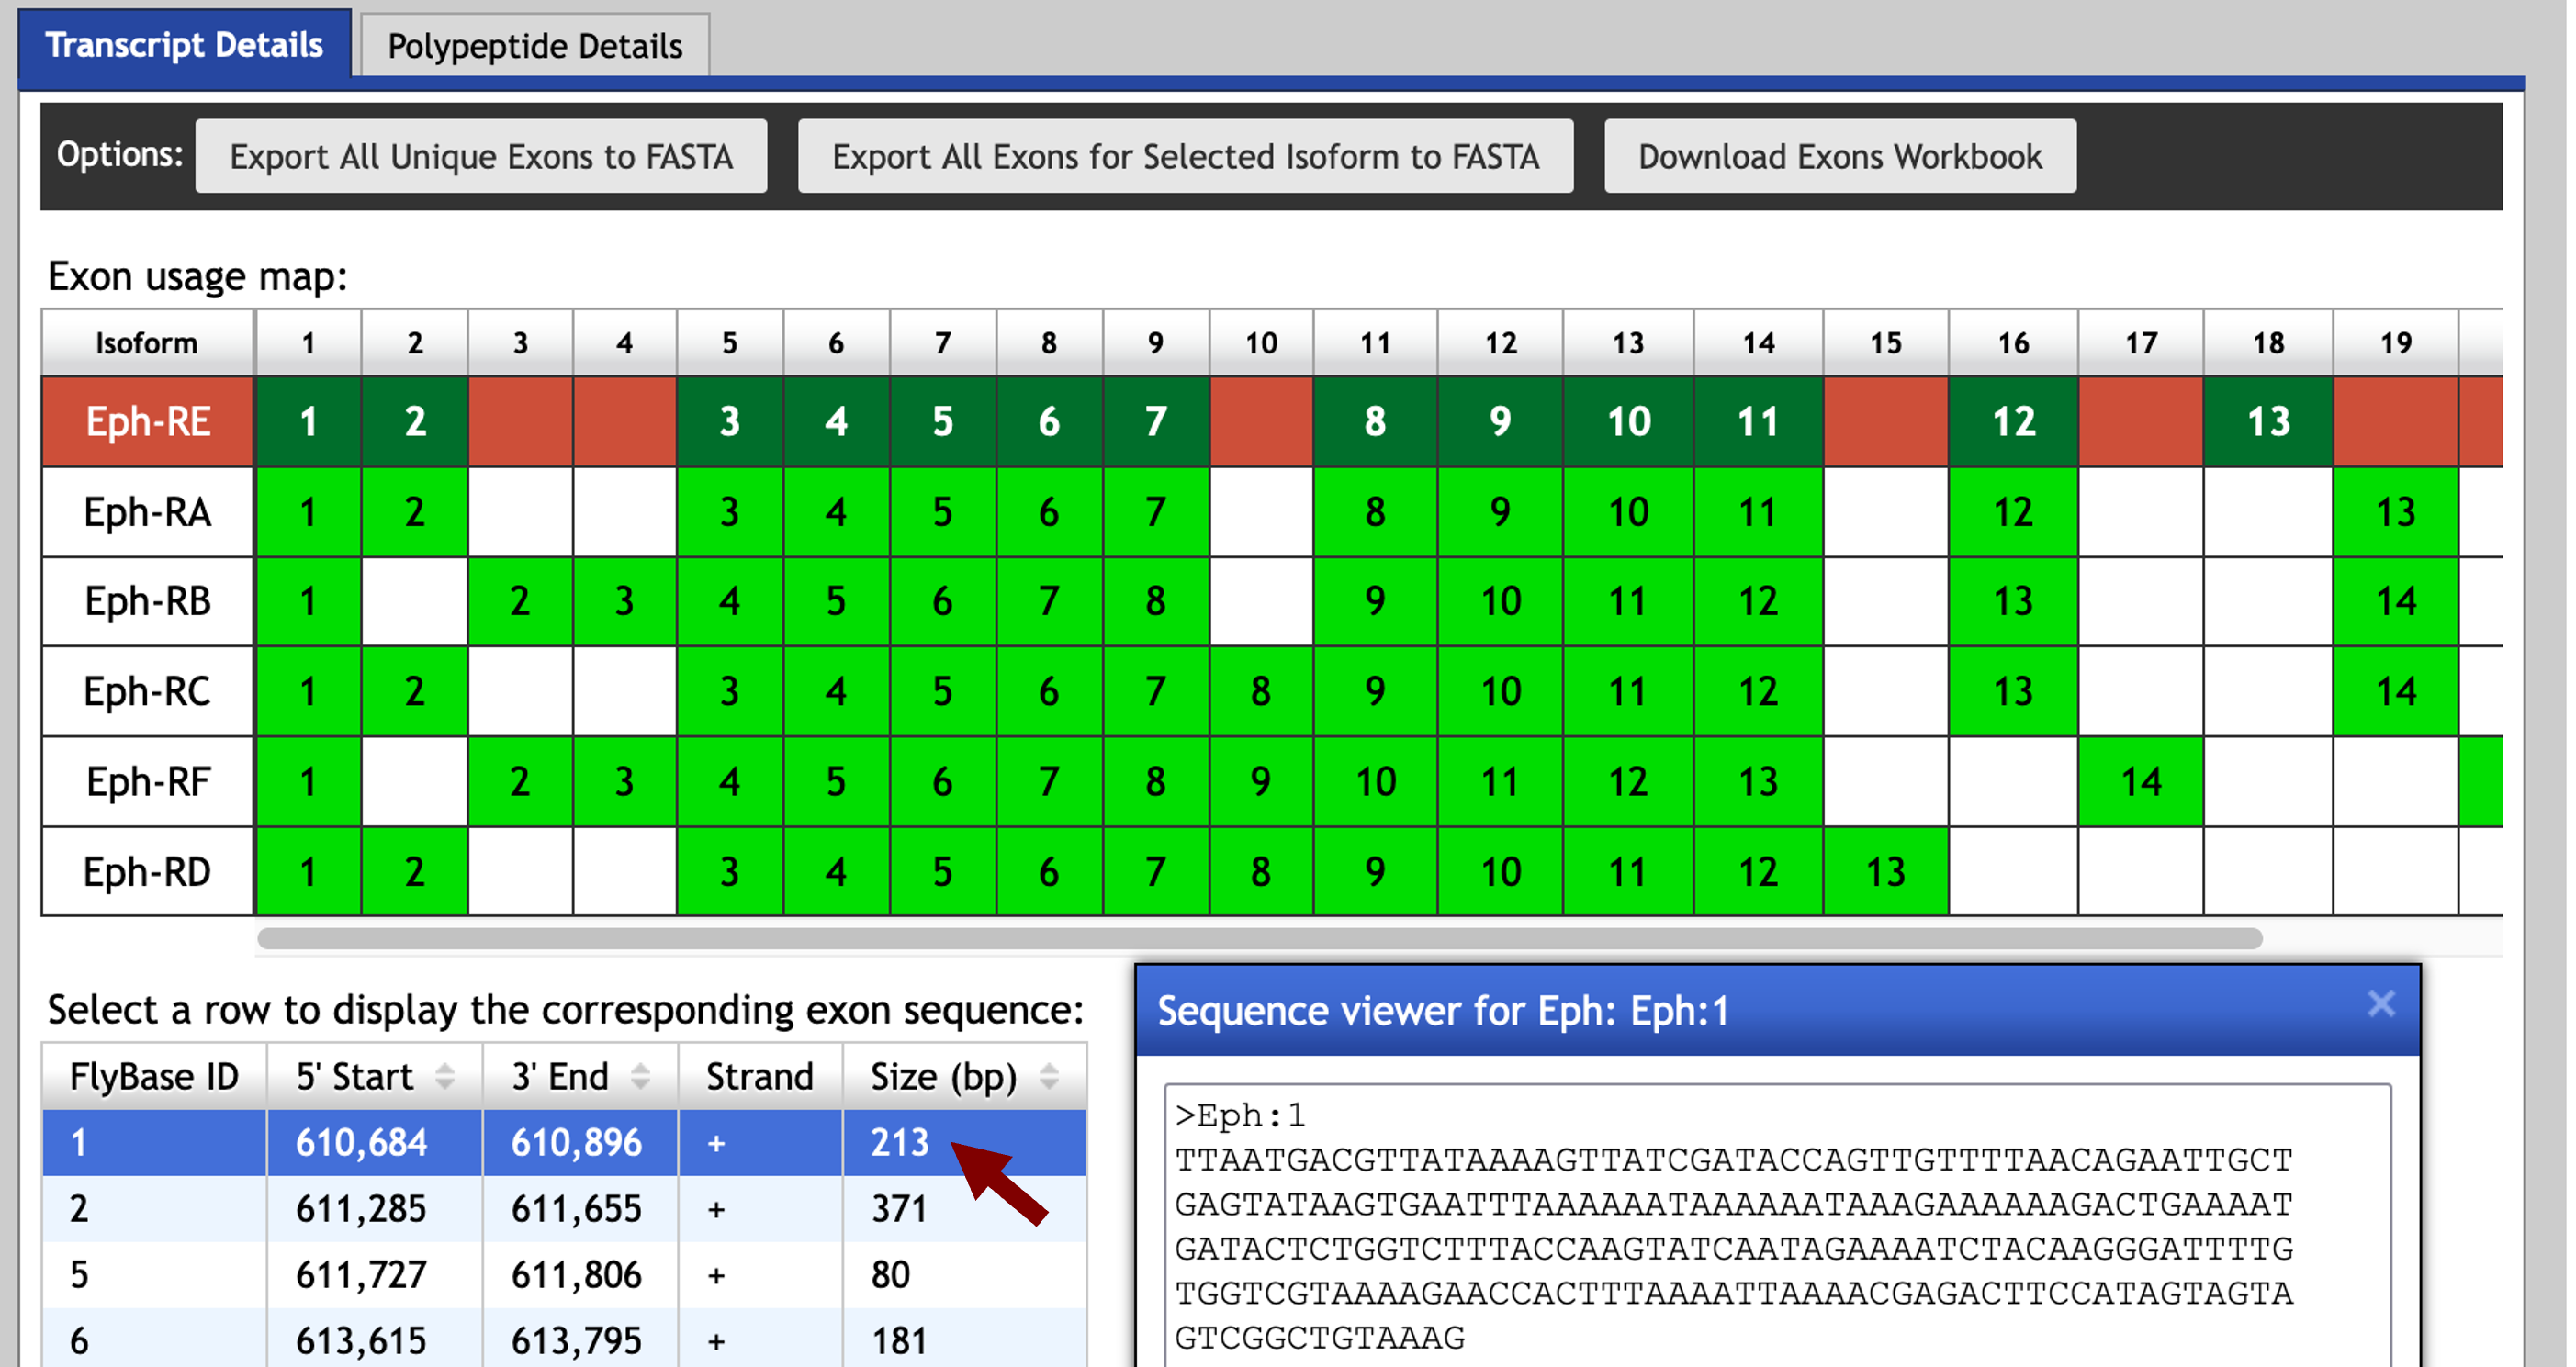
Examination of the “Transcript Details” tab of the Gene Record Finder record for Eph shows that all of the isoforms use the same initial exon (Eph:1). Using the strategy described above, we will try to map this exon against the D. biarmipes contig35 sequence using blastn.
Click on the first row of the exon sequence table (with the FlyBase ID Eph:1). Select the sequence in the Sequence viewer window and copy the sequence onto your clipboard (Figure 22). (For teaching purposes, the Eph:1 sequence is available in the file Eph_exon_1.fasta inside the exercise package.)
Open a new tab on your web browser, navigate to the NCBI BLAST web server and then click on the “Nucleotide BLAST” image under the “Web BLAST” section. The web browser should remember the blastn settings we have set up earlier. Paste the Eph:1 sequence into the “Enter Query Sequence” text box and select the contig35.fasta sequence file in the “Enter Subject Sequence” section. (The contig35.fasta sequence file is available in the exercise package.)
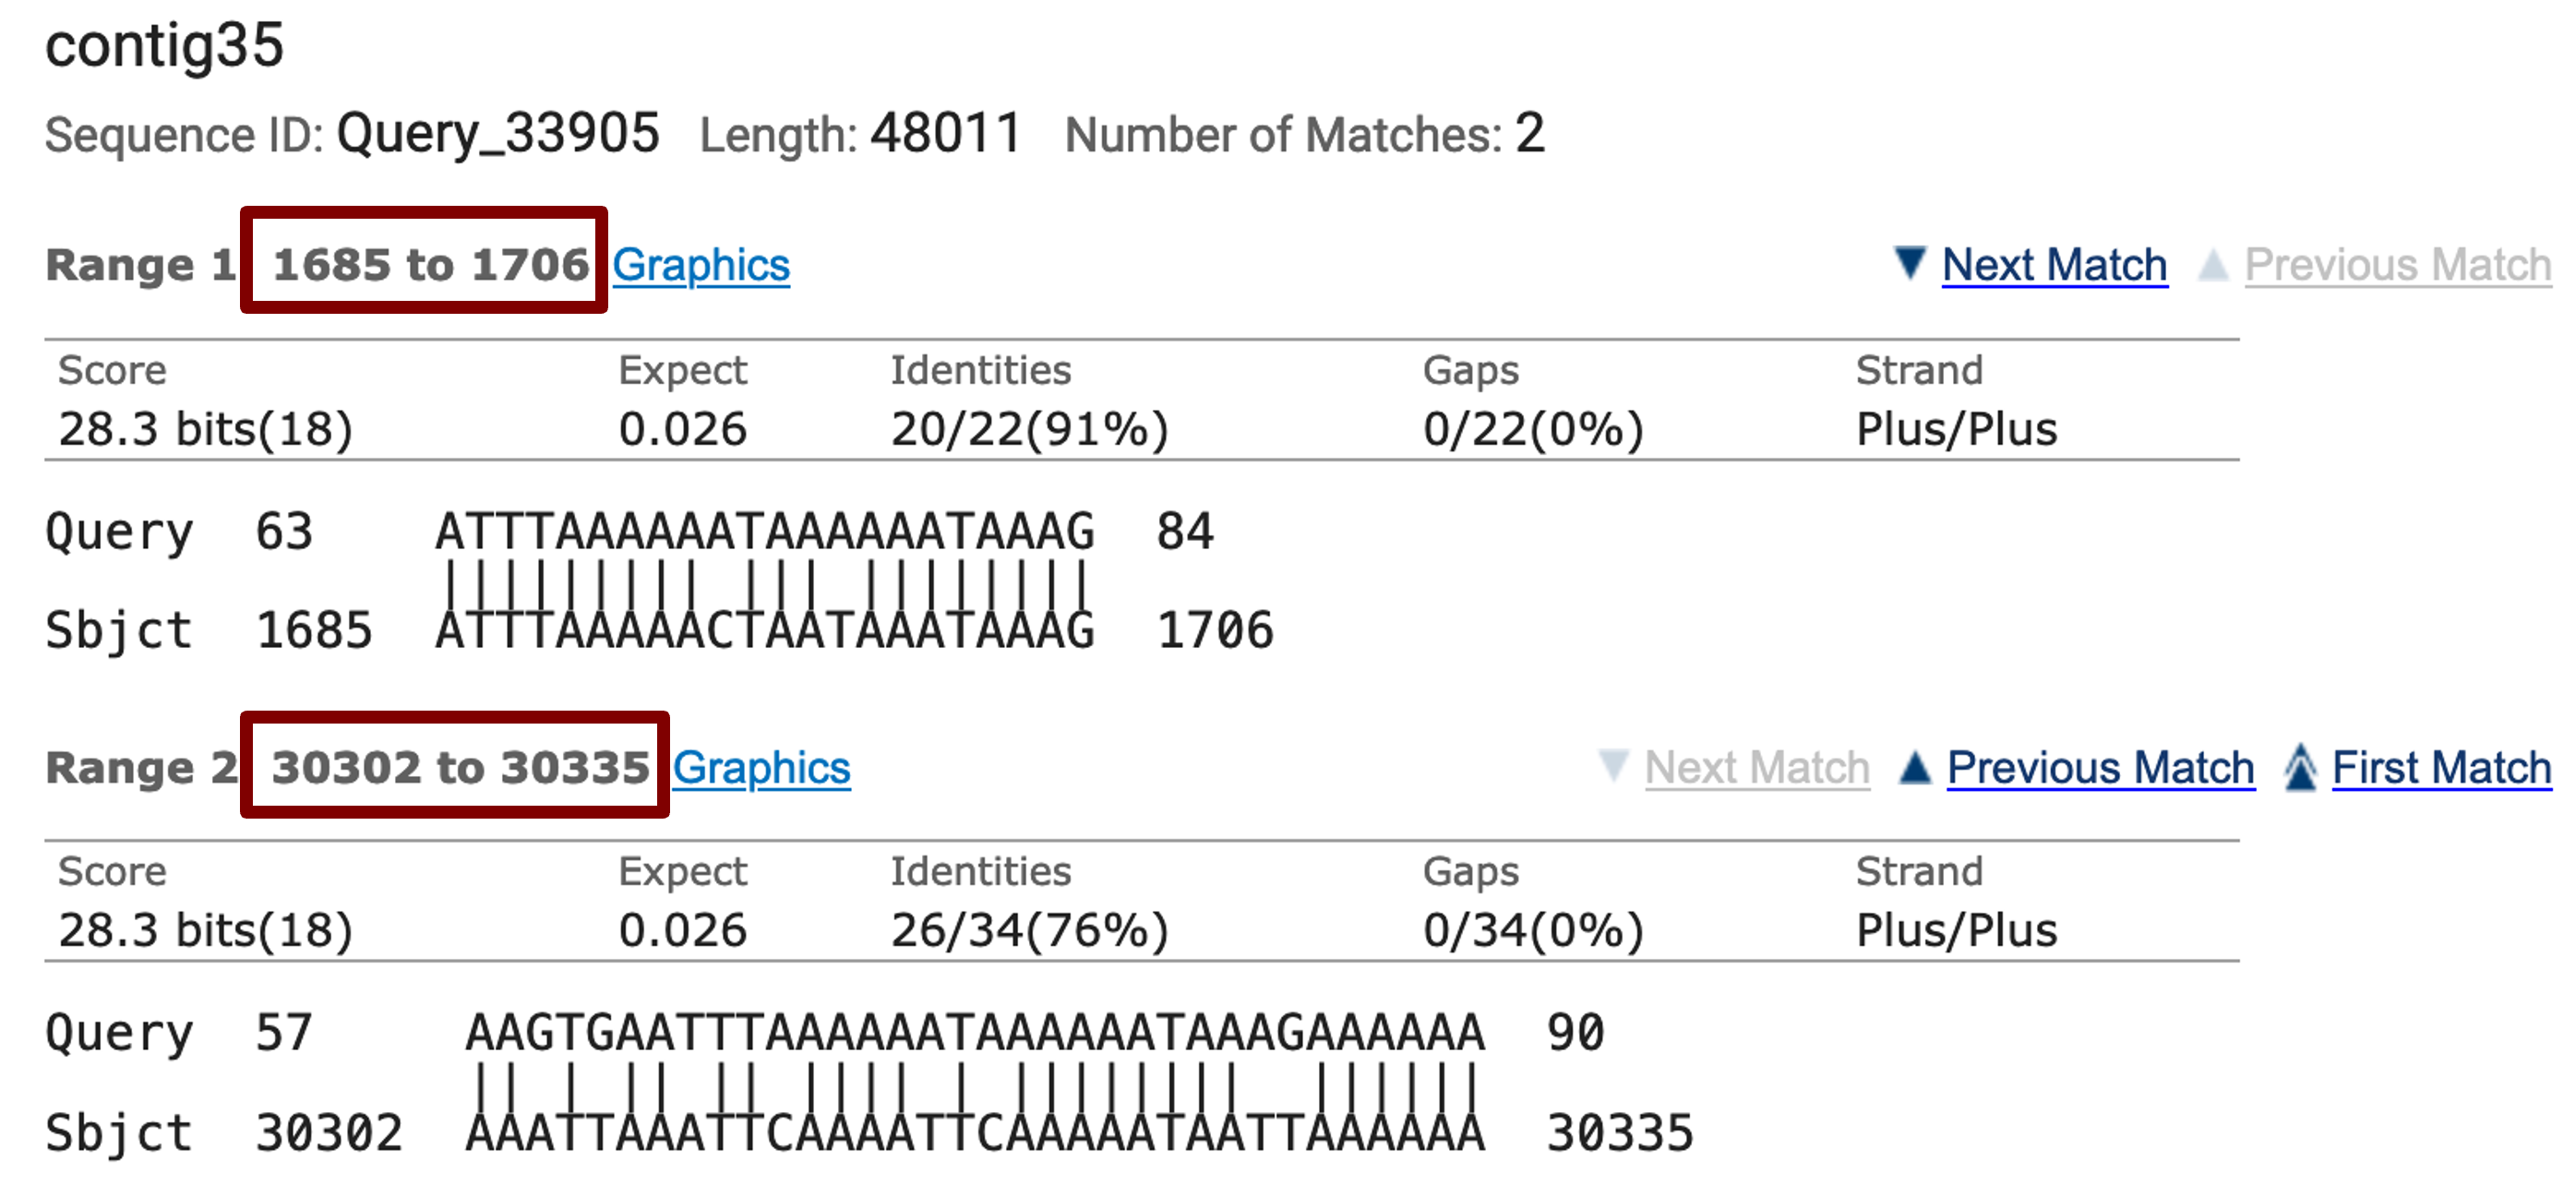
The “Alignments” tab of the blastn search results page shows that blastn detected two matches between the contig35 sequence and the Eph:1 exon (Figure 23). However, the locations of both blastn alignments are inconsistent with the CDS annotations and both also have high E-values (0.026) and low query coverage. Hence we cannot place the exon Eph:1 on contig35 based on the blastn search results.
Using RNA-Seq data to identify the untranslated exon
Because the blastn search failed to identify any regions within contig35 that have significant sequence similarity to the D. melanogaster exon Eph:1, we need to use a different strategy to estimate the location of this untranslated exon. In D. melanogaster, there is a 5' UTR located immediately upstream of CDS 1_2154_0 and 2_2154_0 (Figure 21). Hence we could try to use the RNA-Seq read coverage and the TopHat splice junction predictions in the orthologous region of D. biarmipes (i.e., upstream of 29,131) to estimate the location of exon Eph:1.
Select the web browser tab with the GEP UCSC Genome Browser for D. biarmipes contig35 and click on the “hide all” button. Enter “contig35:28,000-29,500” into the “chromosome range, or search terms” text box. Scroll down to the track configuration section and change the display modes for the tracks listed below, then click on the “refresh” button (Figure 24).
-
Under “Mapping and Sequencing Tracks”
-
Base Position: full
-
-
Under “Gene and Gene Prediction Tracks”
-
D. mel Proteins: pack
-
-
Under “RNA Seq Tracks”
-
RNA-Seq Alignment Summary: show
-
RNA-Seq TopHat: squish
-
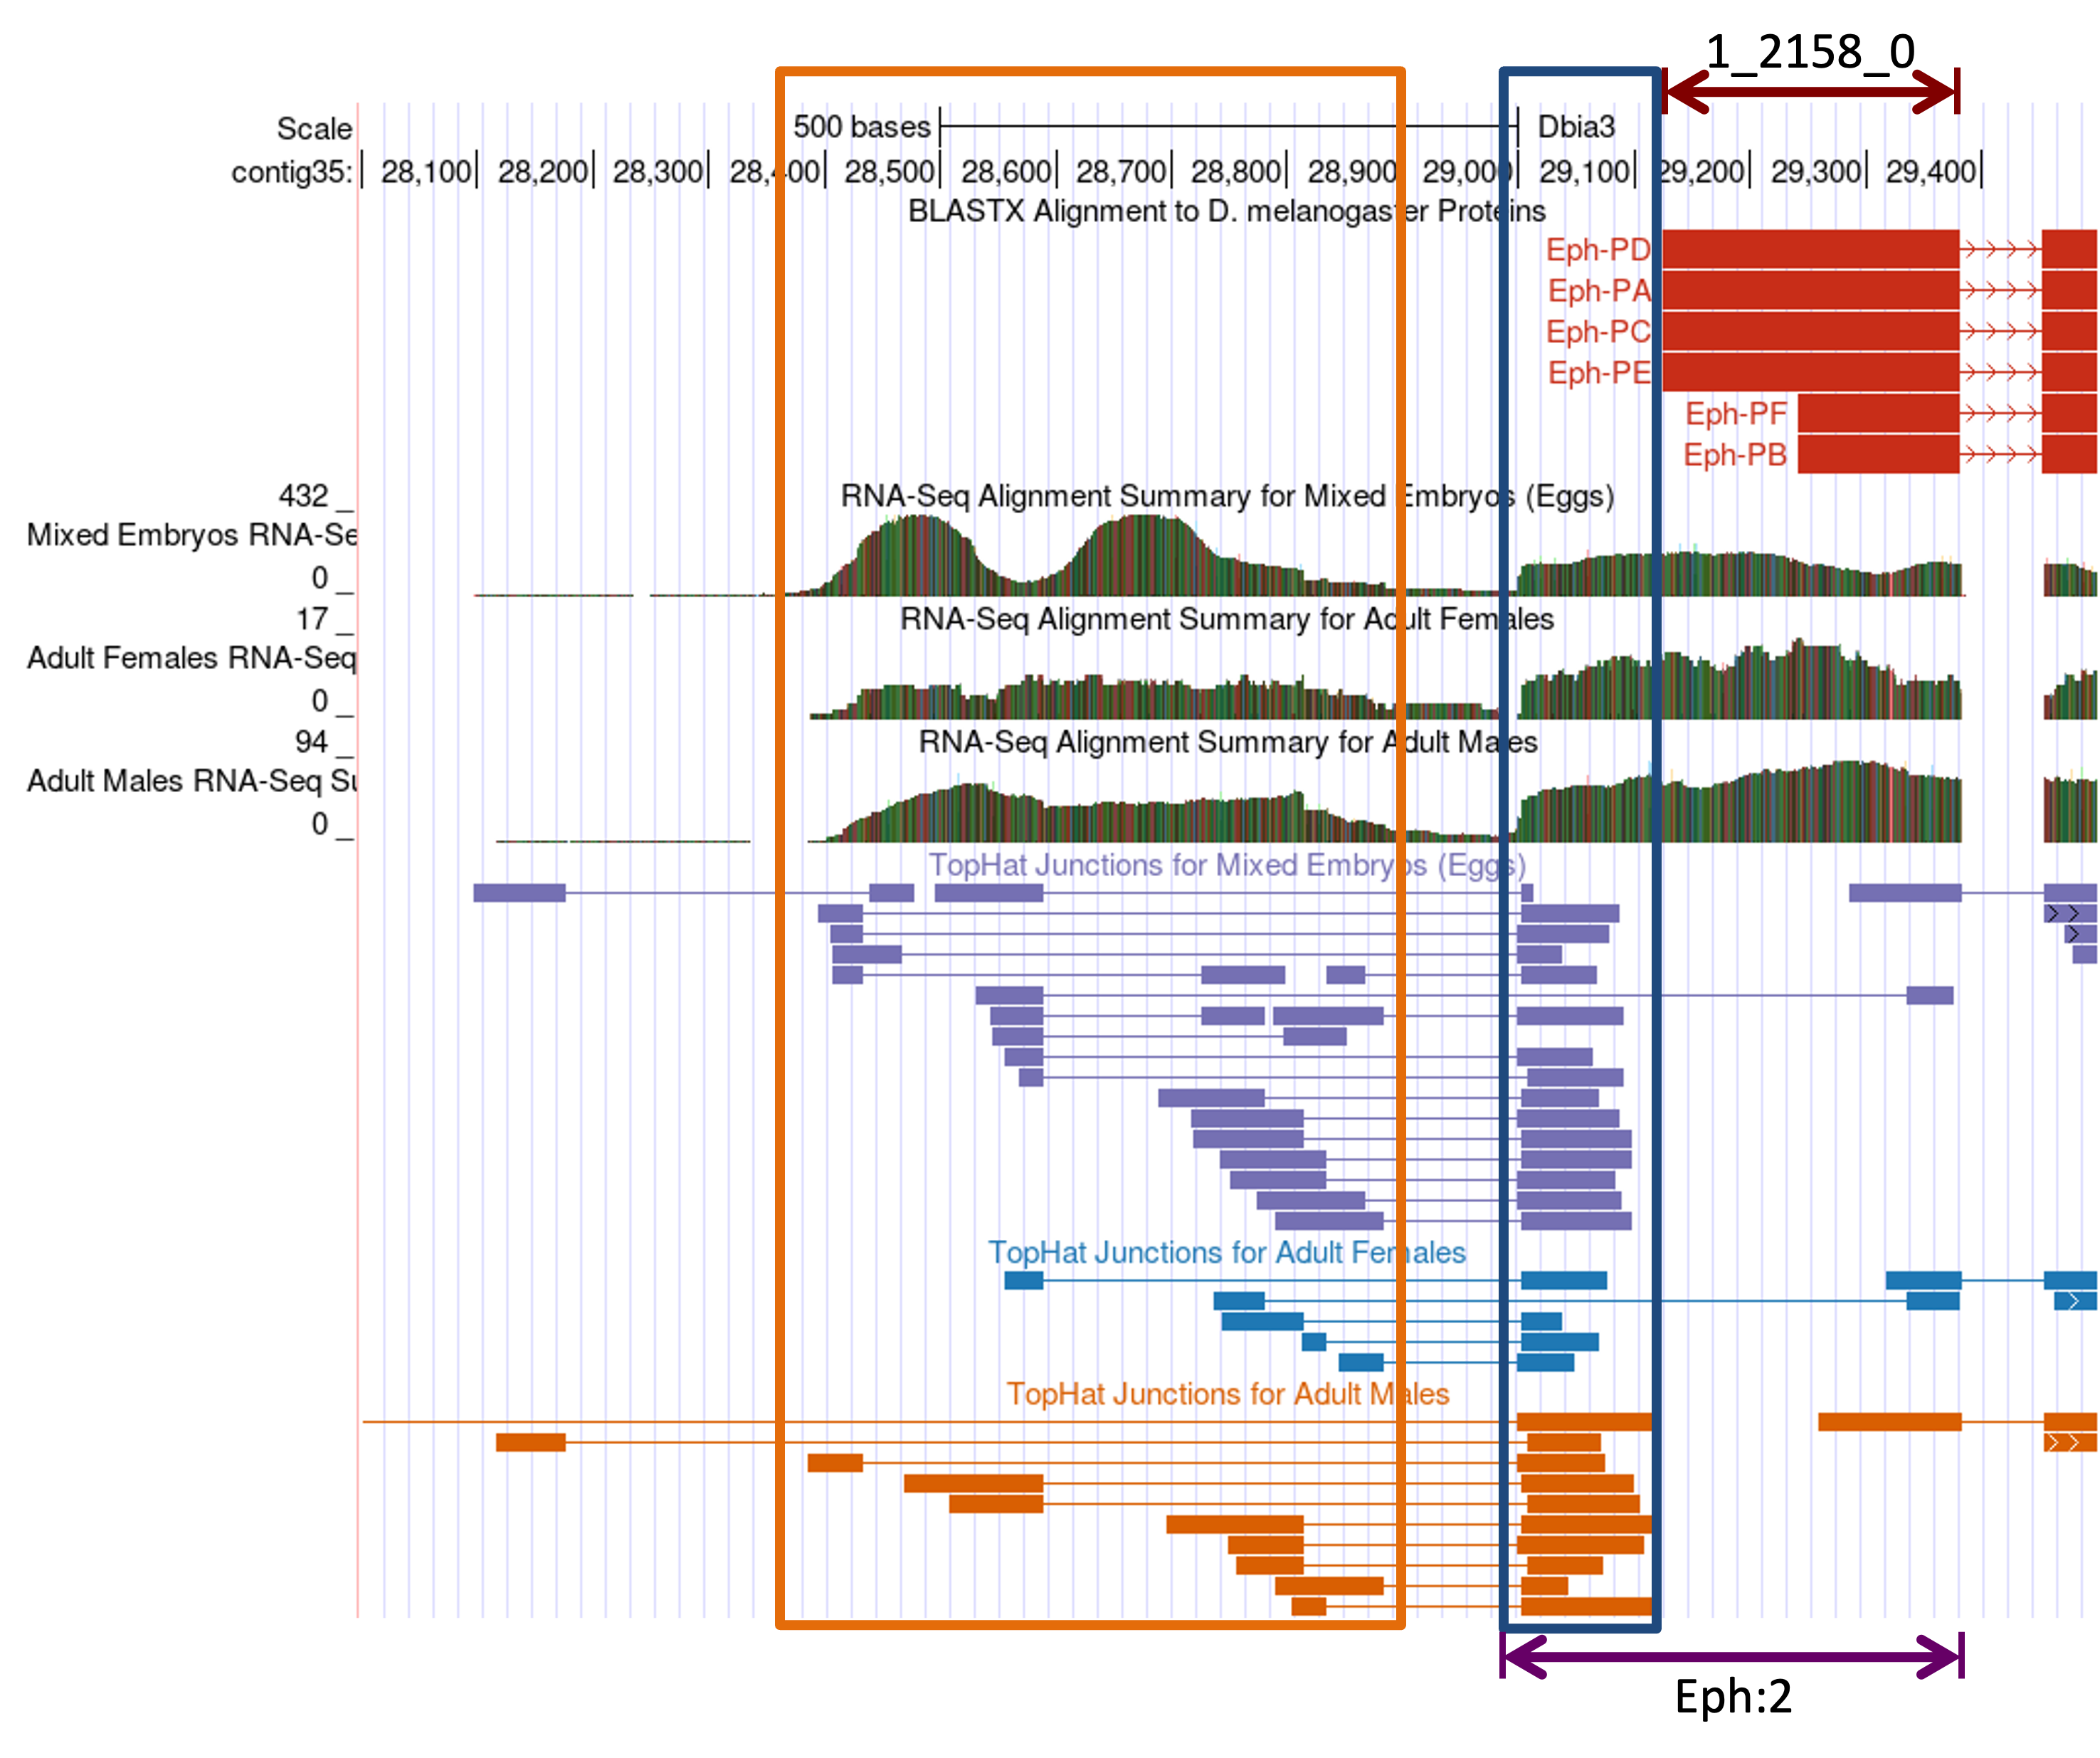
The “D. mel Proteins” track shows that the Eph ortholog in D. biarmipes is on the plus strand and the initial coding exon 1_2154_0 begins at 29,131. (If the “Base Position” track shows the translation for the minus strand, click on the arrow next to the “Base Position” track to complement the sequence.) The “RNA-Seq Alignment Summary” track shows there are RNA-Seq reads that map to the region immediately upstream of 29,131 (i.e., from 28,999–29,130). This region likely corresponds to the untranslated region of exon Eph:2 (Figure 24, blue box).
The TopHat junction tracks show multiple splice junction predictions in this region. For example, there are three potential splice acceptor sites that are supported by TopHat (at 29,006–29,007, 29,001–29,002, and 28,997–28,998; left edge of blue box). All of these potential splice acceptor sites are connected to multiple splice donor sites located further upstream. These upstream regions have high RNA-Seq read coverage (Figure 24, orange box), indicating that these regions are transcribed in D. biarmipes. Based on the RNA-Seq read coverage and the TopHat junctions, we can infer that the region at ~28,400–28,900 likely contains multiple 5' UTRs of Eph in D. biarmipes.
The multiple splice junctions suggested by TopHat in D. biarmipes differ from the FlyBase annotation in D. melanogaster, which shows a single transcribed exon (Eph:1) in all six isoforms. To further investigate this discrepancy, we will examine the D. melanogaster annotation of Eph more closely.
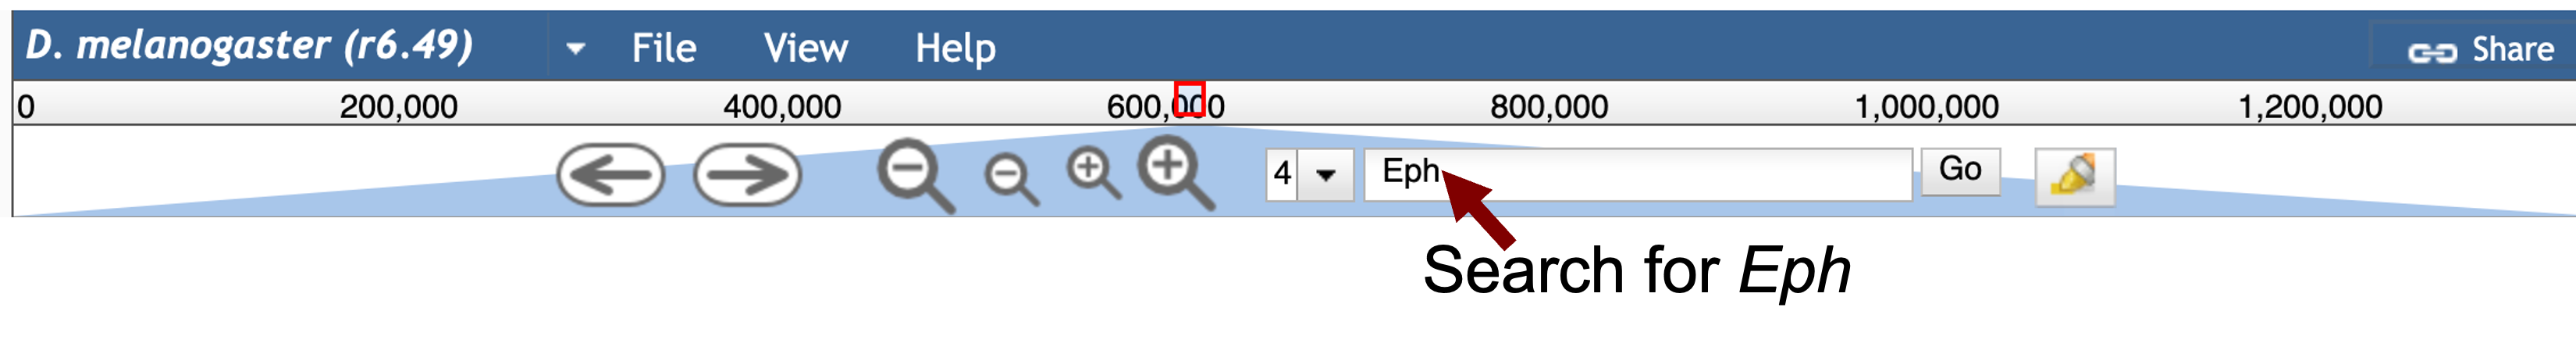
Select the web browser tab for FlyBase JBrowse. Type “Eph” into the “search features, IDs” textbox above the JBrowse image, and then click on the “Go” button. JBrowse will jump to the region “4:608323..624823” (Figure 25).
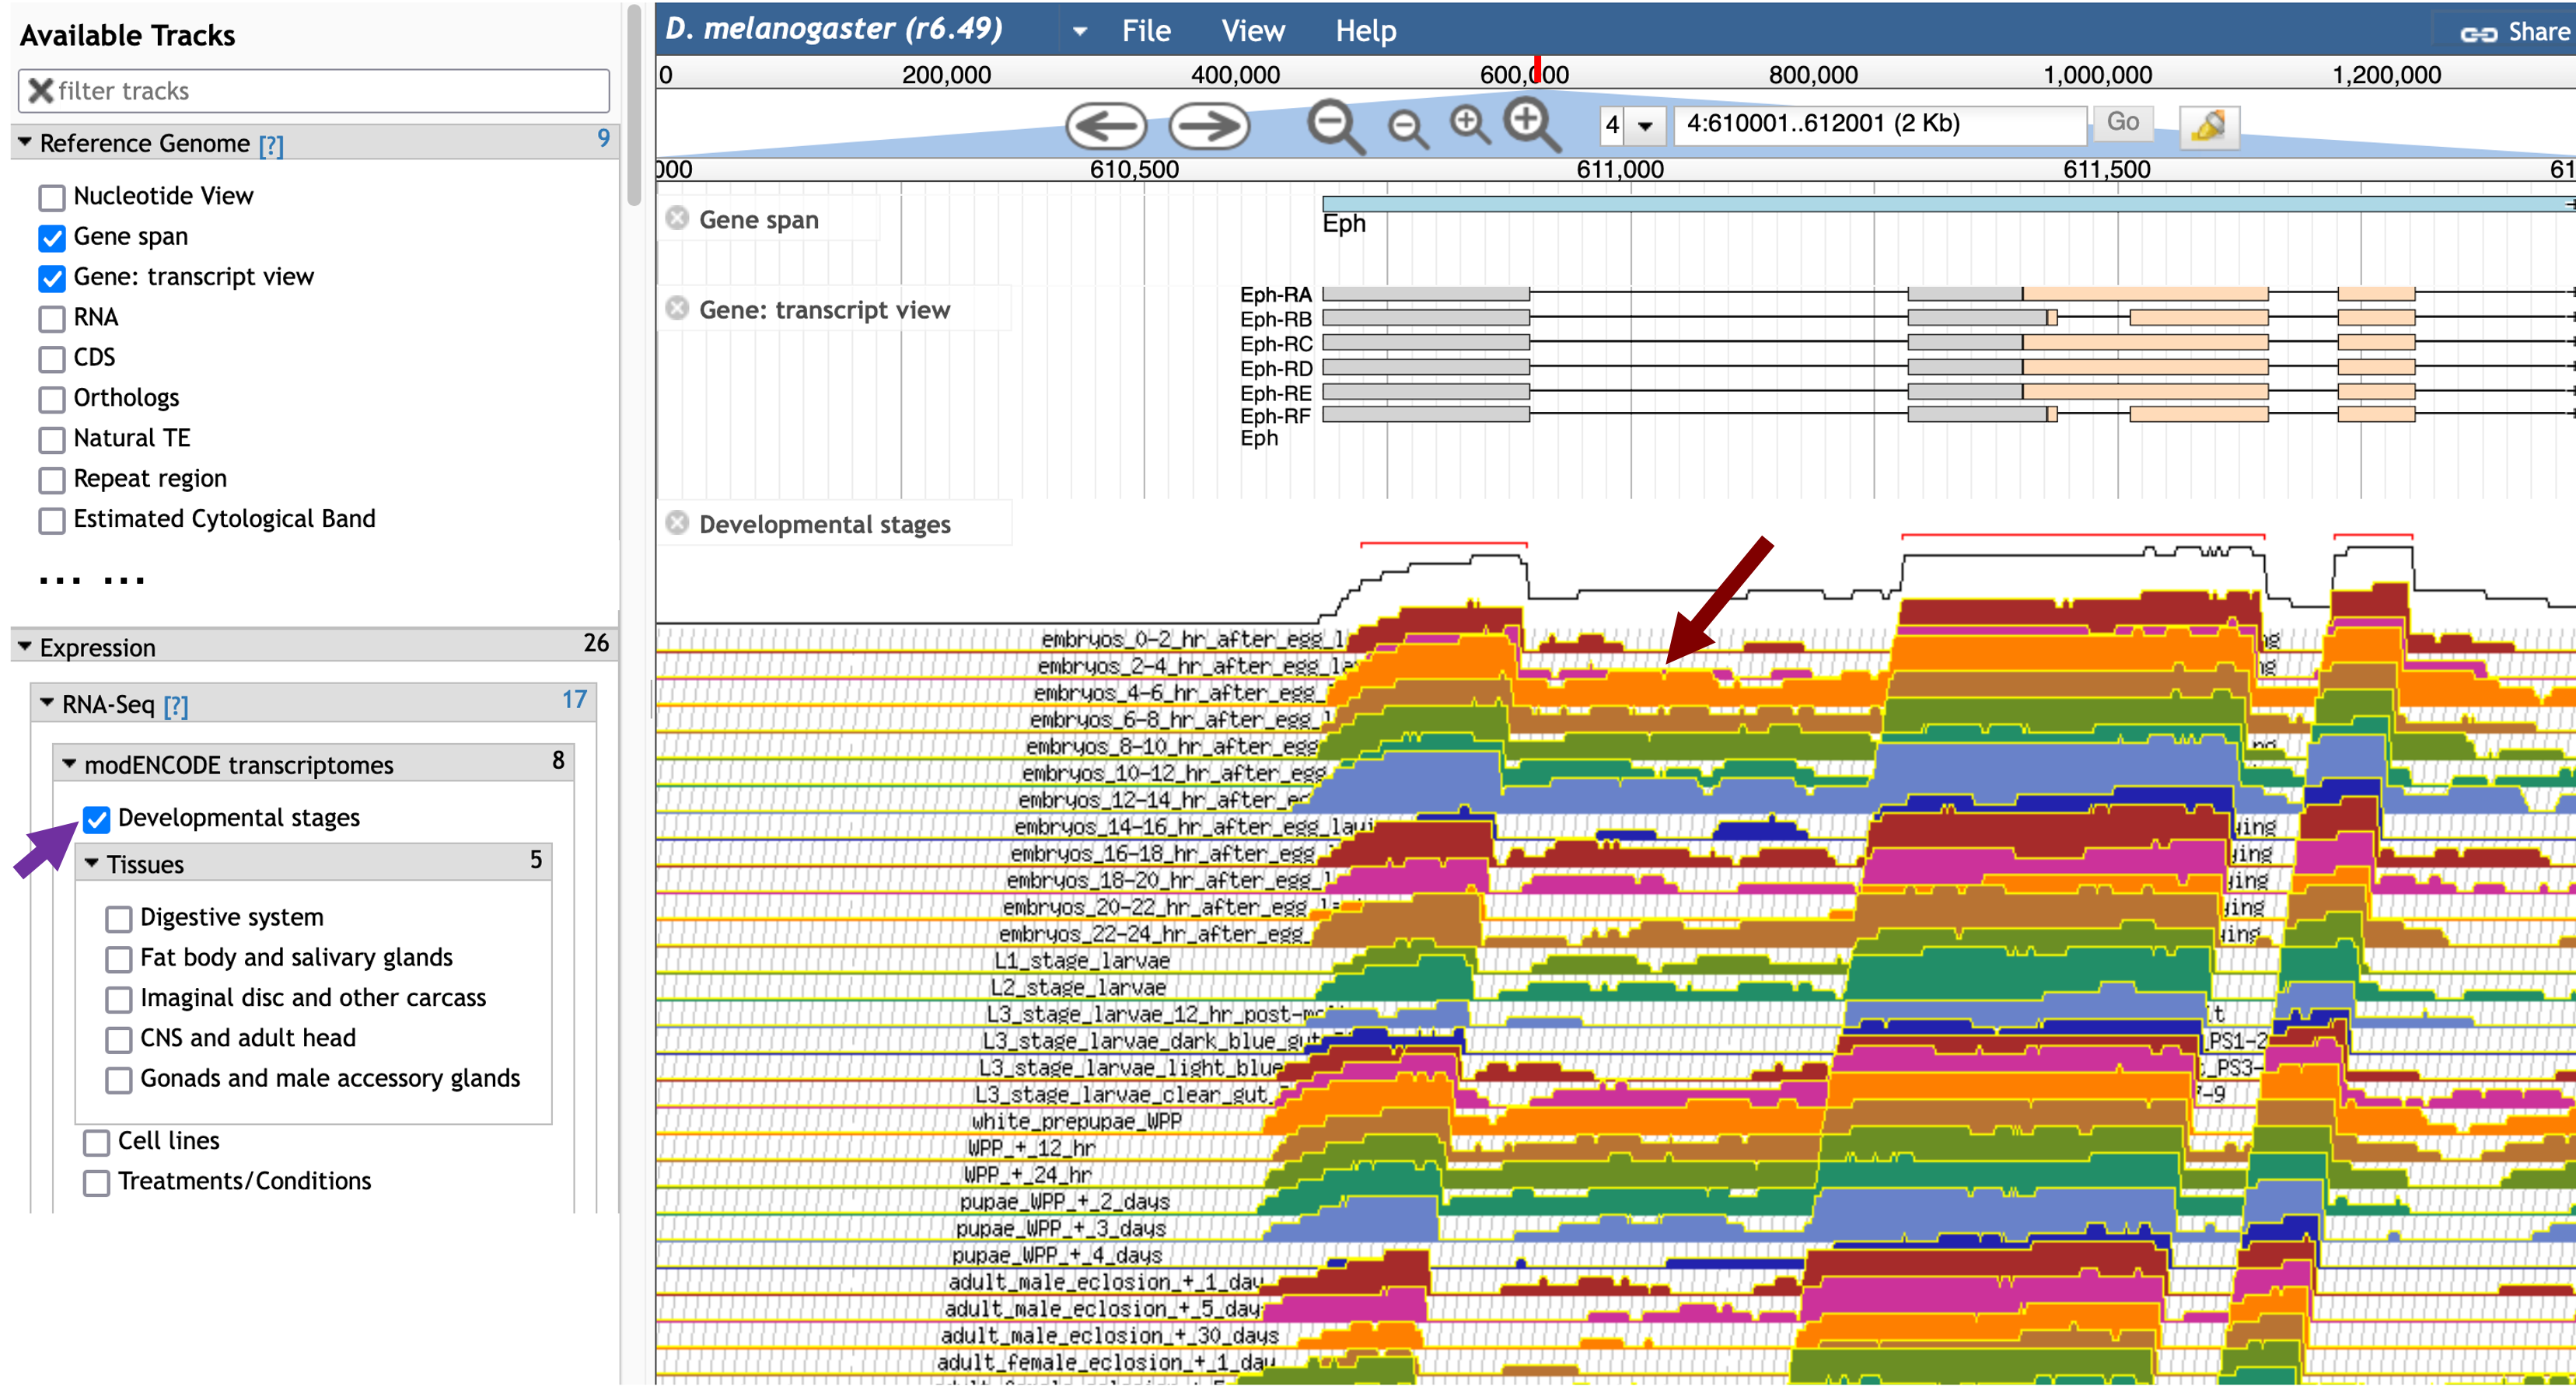
In order to examine the beginning of the Eph gene, enter “4:610,000..612,000” into the “search features, IDs” text box and then click on the “Go” button. To examine the RNA-Seq data from different developmental stages for this region, scroll down to the “Expression” section in the “Available Tracks” panel, and then select the “Developmental stages” checkbox under the “modENCODE transcriptomes” sub-section. This evidence track shows that the first intron of Eph has high RNA-Seq read coverage in some developmental stages (red arrow in Figure 26).
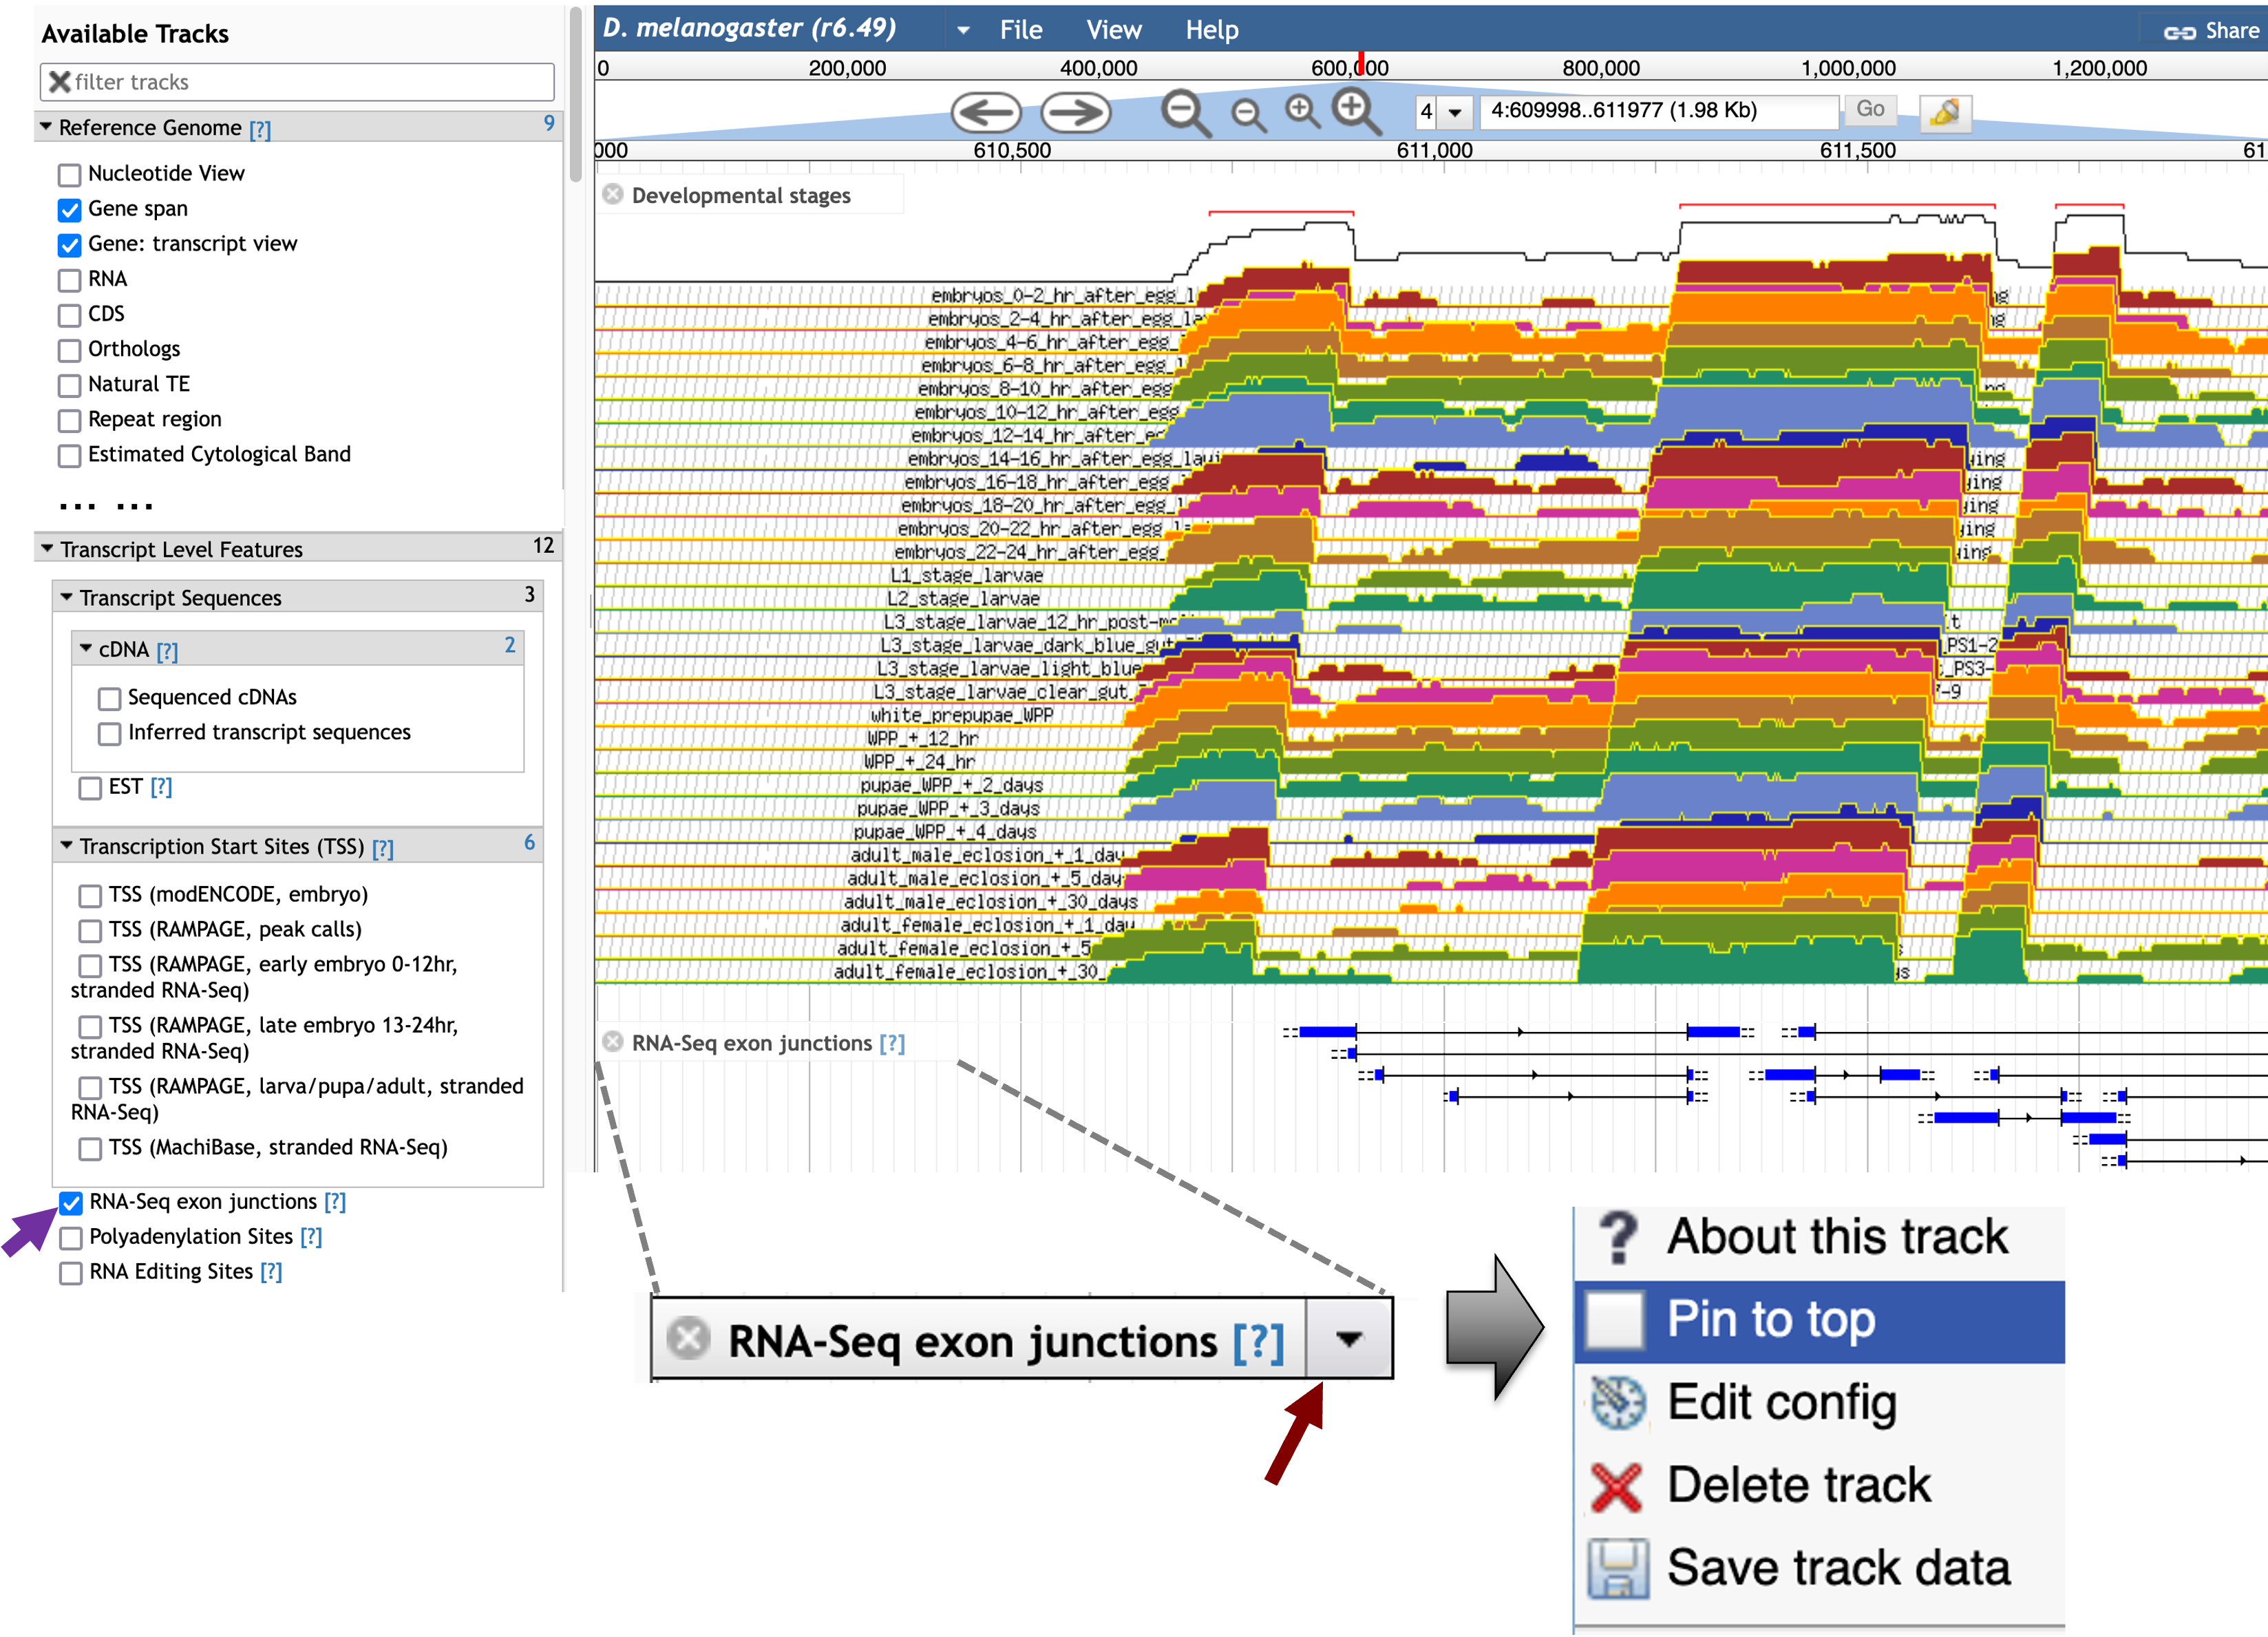
To determine if there are other potential splice junctions within the intron, scroll down to the “Transcript Level Features” section in the “Available Tracks” panel and then select the “RNA-Seq exon junctions” checkbox. The RNA-Seq exon junctions evidence track will appear beneath the “Developmental stages” RNA-Seq evidence tracks.
To facilitate interpretation of the exon junctions, we will pin the “RNA-Seq exon junctions” track to the top of the JBrowse image. Hover over the “RNA-Seq exon junctions” title in the JBrowse image, click on the drop-down menu, and then select the “Pin to top” option to move this evidence track to the top of the JBrowse image (Figure 27).
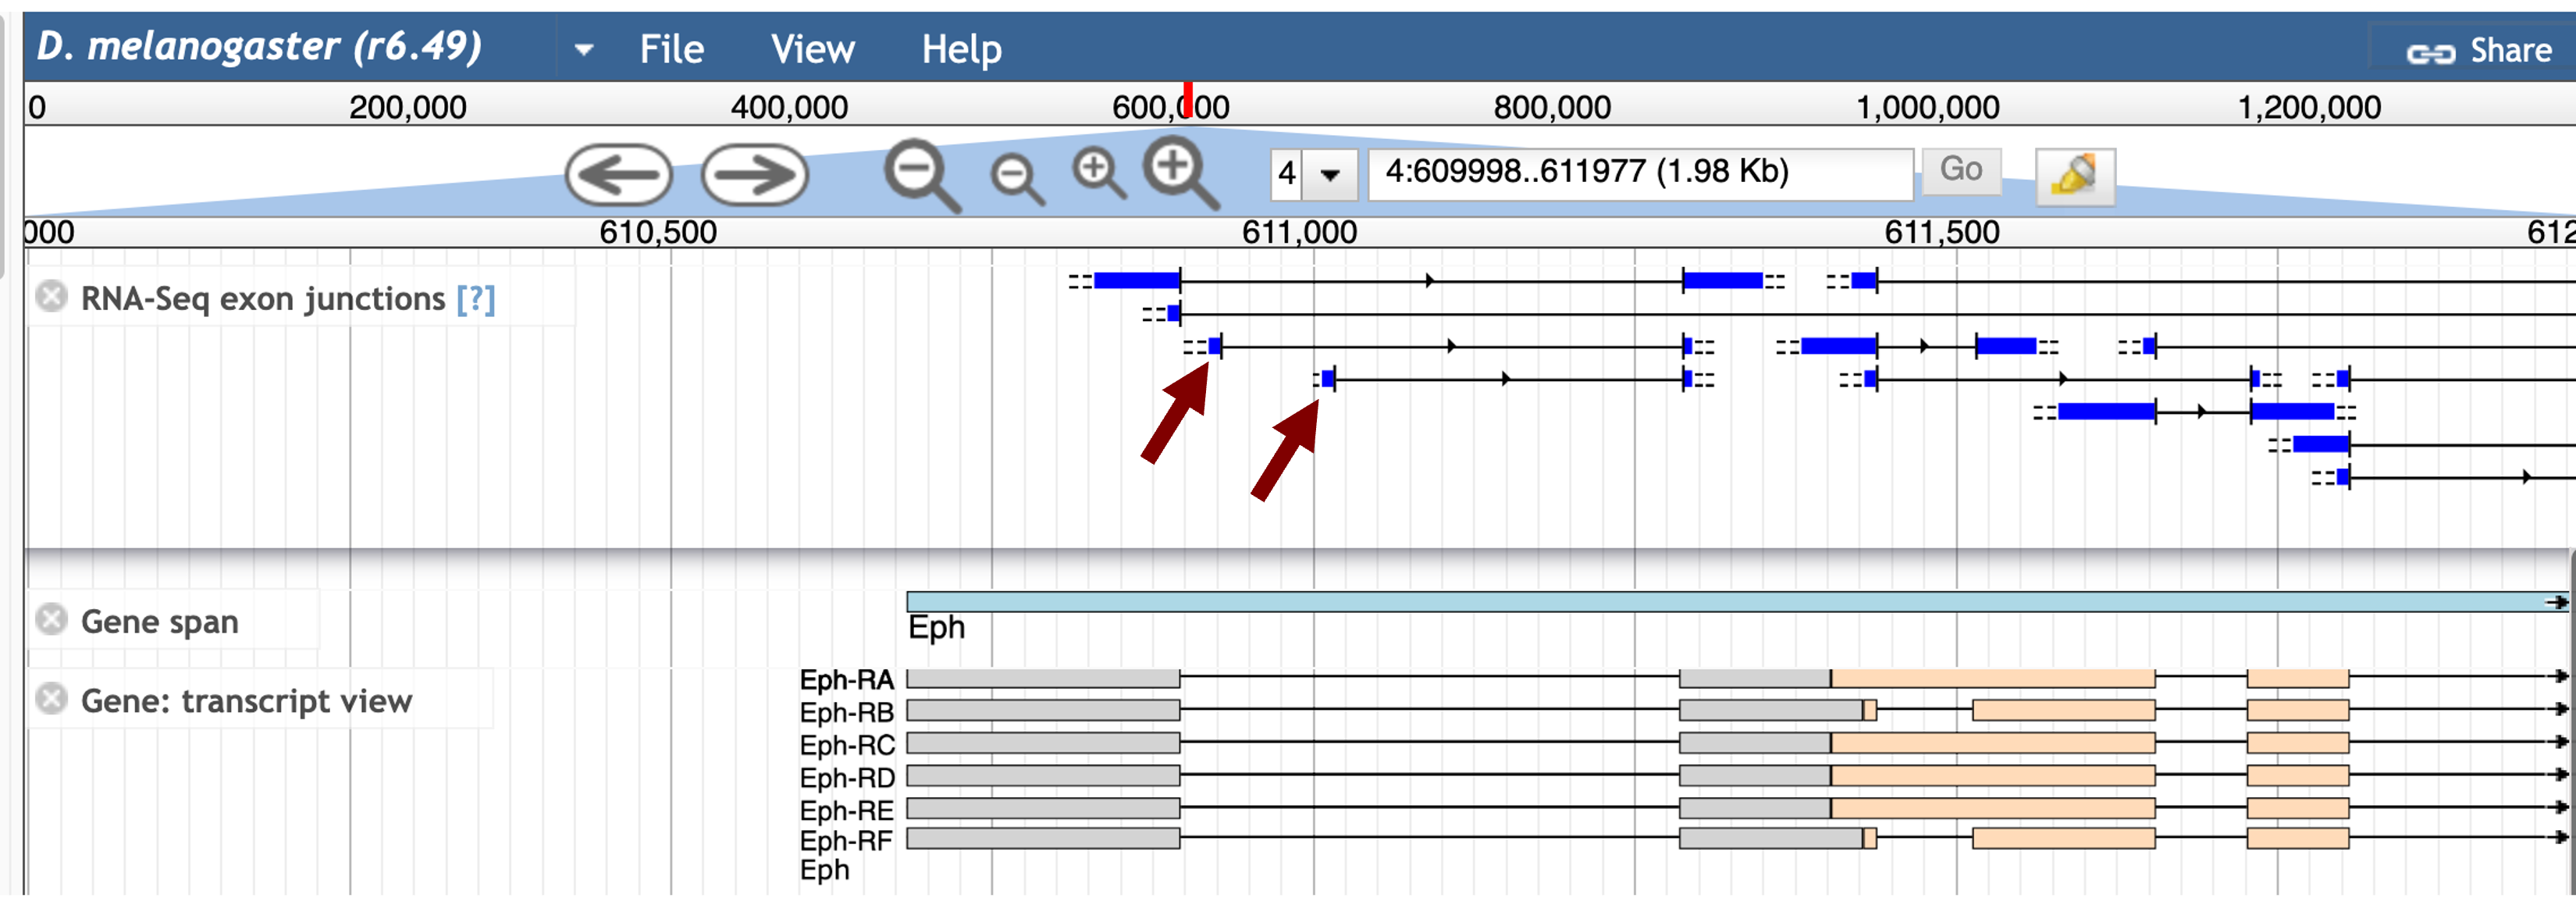
The updated JBrowse view shows two unannotated splice junctions downstream of Eph:1 that are connected to Eph:2 (red arrows in Figure 28).
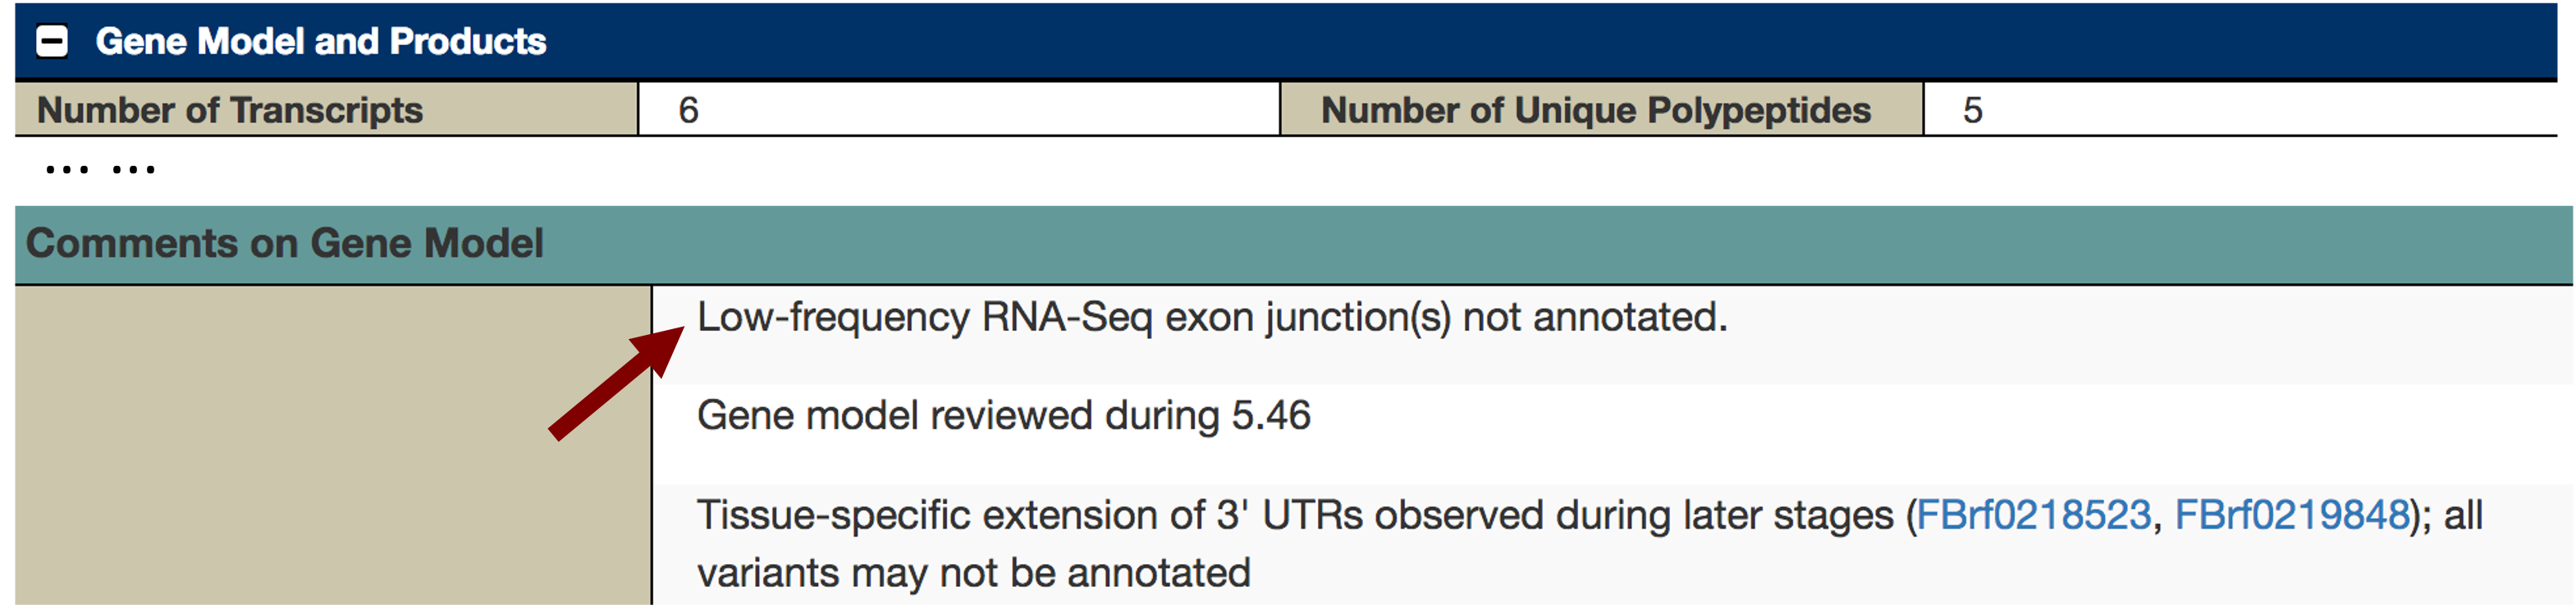
To ascertain why FlyBase did not annotate additional isoforms of Eph based on these RNA-Seq data, we will examine the FlyBase annotation notes for Eph. Click on the Eph feature (light blue rectangle) under the “Gene span” track to access the FlyBase Gene Report for Eph. Scroll down and then click on the “Gene Model and Products” header to expand this section. The “Comments on Gene Model” section includes a note that the annotators at FlyBase did not annotate RNA-Seq junctions that were supported by a small number of spliced RNA-Seq reads (Figure 29). Collectively, the RNA-Seq evidence indicates that there could be additional unannotated isoforms of Eph in both D. melanogaster and D. biarmipes.
Searching for core promoter motifs
The complicated splicing patterns at the 5' end and the presence of multiple annotated TSS in the “TSS (Celniker)” track in D. melanogaster suggest that the region surrounding the 5' end of the Eph gene in D. biarmipes might contain multiple TSSs. The distribution of the core promoter motifs (e.g., Inr) could help demarcate the putative TSS for the Eph ortholog in D. biarmipes.
Go back to the web browser tab with the GEP UCSC Genome Browser for D. biarmipes. Click on the “Short Match” link in the track configuration section. Change the “Display mode” field to “pack” and the “Short (2-30 base) sequence” field to the Inr motif “TCAKTY” and then click “Submit” (Figure 16).
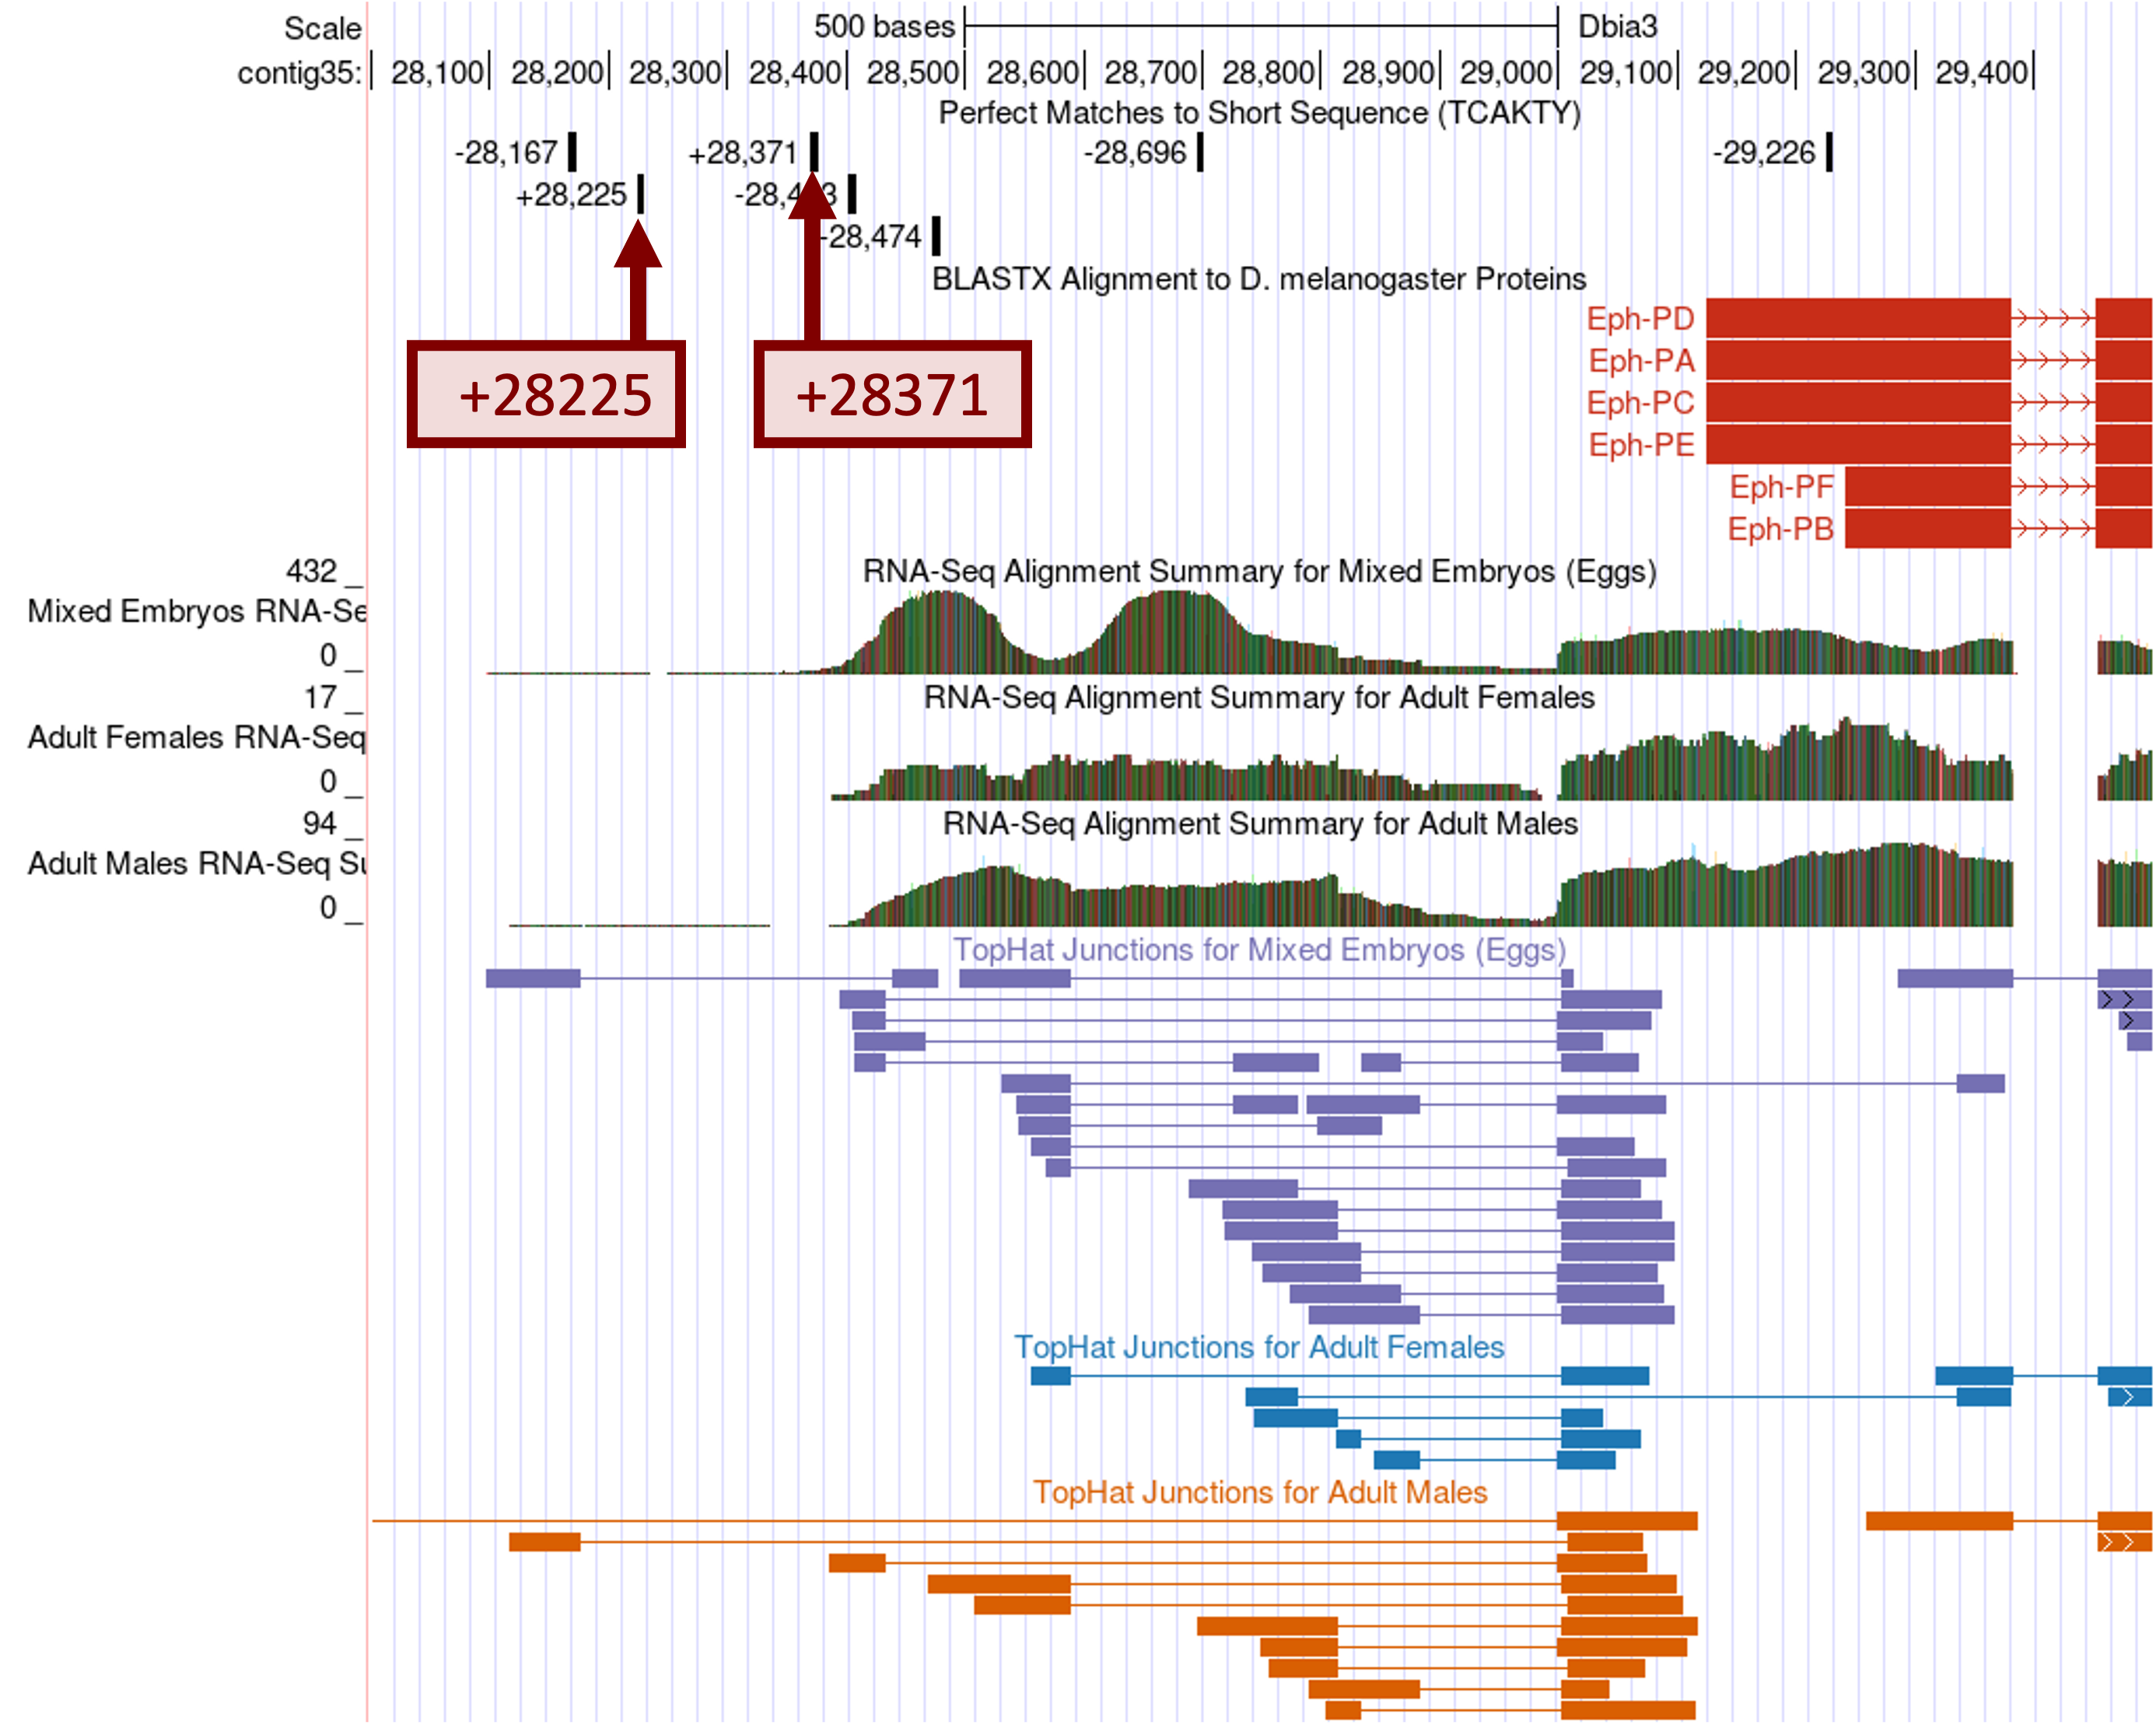
Because the Eph gene is on the positive strand, we will only focus on the subset of motif matches that are on the positive strand. There are two motif matches (at 28,225 and 28,371) that are supported by the D. biarmipes RNA-Seq read coverage and the TopHat junction predictions (Figure 30). [The next positive strand match is located at 26,821 (not shown in Figure 30), but this match is not supported by the RNA-Seq data.] Between these two candidates, the Inr motif at 28,371 is better supported by the D. biarmipes RNA-Seq data because it is located immediately upstream of the region with high RNA-Seq read coverage. As part of the TSS annotation protocol, we should also search for other motifs (Figure 14) that are commonly associated with the core promoters to gather additional support for this hypothesis.
|
|
In this case, none of the other core promoter motifs support this TSS annotation. |
Annotating the putative TSS regions in D. biarmipes
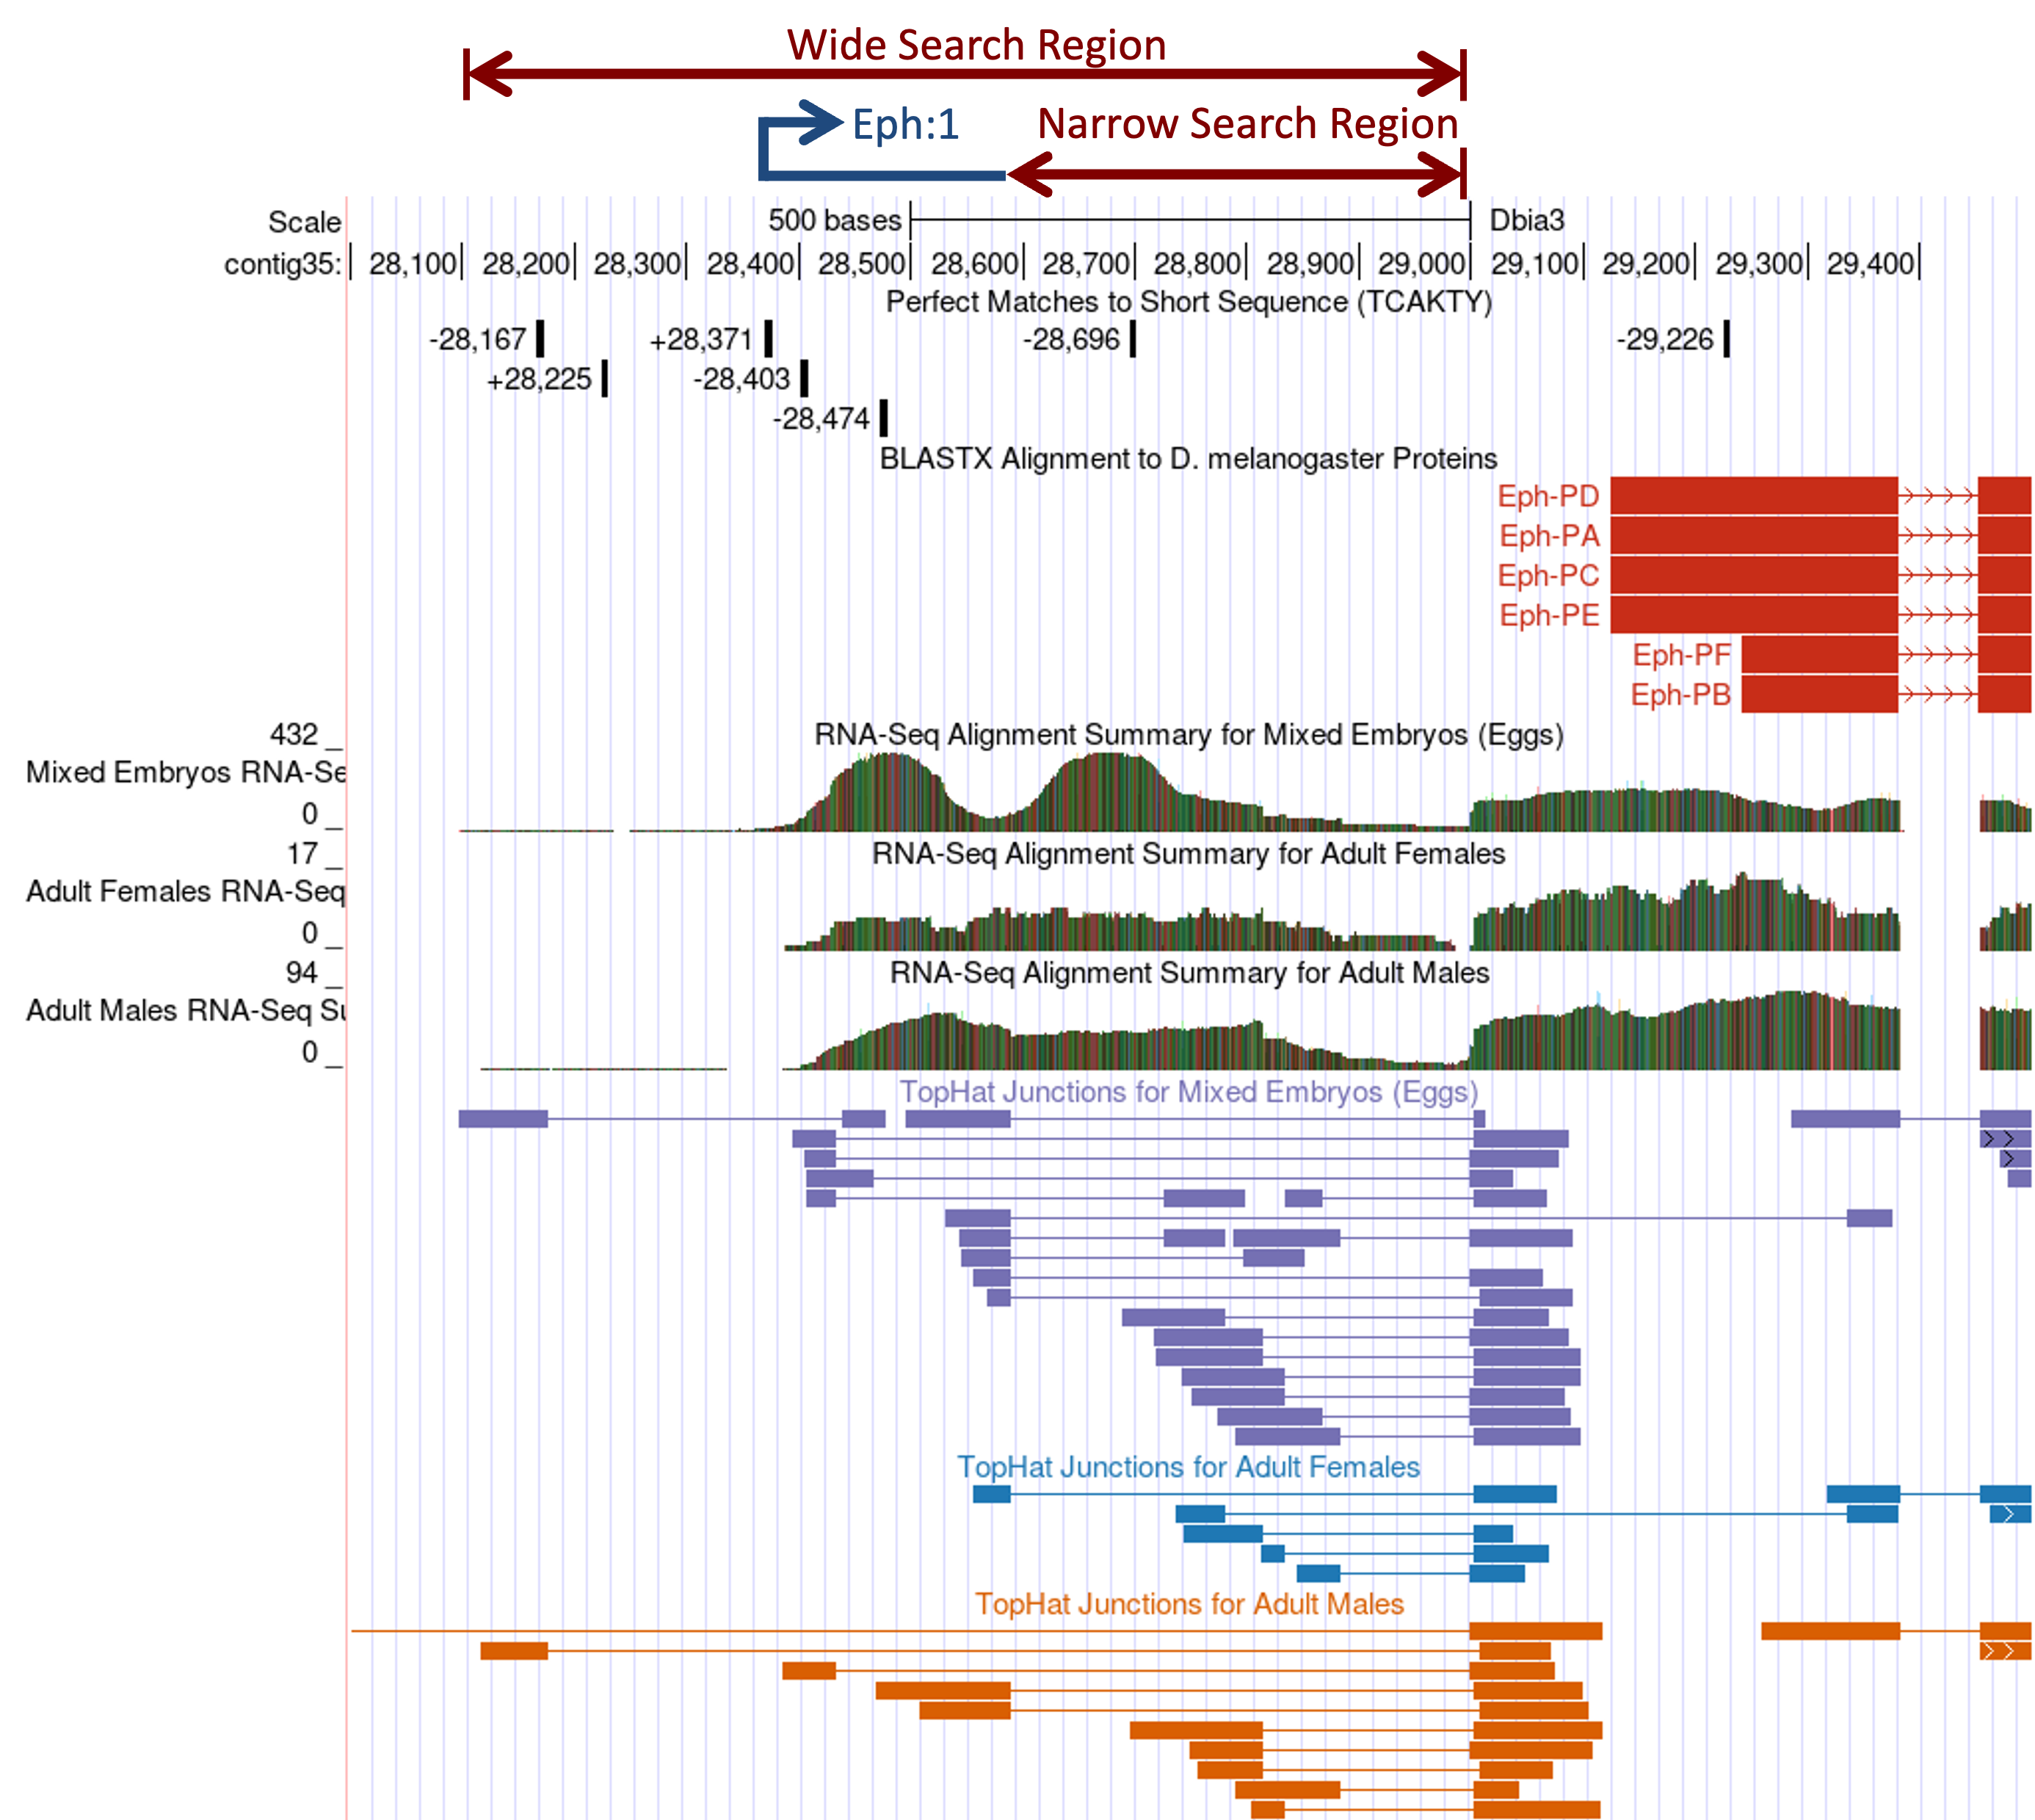
Based on the available RNA-Seq evidence and the results of the promoter core motif search, we can define multiple regions (with different levels of confidence) where the TSS of Eph might be found in D. biarmipes contig35 (Figure 31). We will define the genomic regions that are supported by stronger evidence as the narrow TSS search region. Regions that are supported by weaker evidence will be included as part of the wide TSS search region.
Because the best-supported match to the Inr motif is located at 28,371, the strongest candidate for the TSS is at 28,373 (remember that the Inr motif begins at -2 of the TSS). Based on the location of the Inr motif at 28,371 and the TopHat splice junctions that support the splice donor site at 28,590-28,591, the best candidate for the exon orthologous to the D. melanogaster exon Eph:1 is located at 28,373–28,589. The proposed exon Eph:1 has a total size of 217bp in D. biarmipes compared to 213bp in D. melanogaster. The additional splice junctions located further downstream would correspond to the unannotated exon junctions in D. melanogaster.
The region downstream of the annotated Eph:1 (i.e., 28,590–28,998) has high RNA-Seq read coverage and contains multiple TopHat junctions, indicating that this region is being actively transcribed in D. biarmipes. Because there are no Inr motif instances in this region, we cannot determine if this region contains a TSS for Eph. However, in D. melanogaster, the “TSS (Celniker)” track annotated a single TSS (TSS_Eph_631675) within the first intron of Eph (Figure 19). Consequently, we will annotate 28,590–28,998 as part of the narrow TSS search region that might contain additional TSS (i.e., “Narrow Search Region” in Figure 31).
Similarly, the “TSS (Celniker)” track annotated a single TSS upstream of Eph:1 (TSS_Eph_631270) in D. melanogaster and there is another match to the Inr motif upstream of Eph:1 at 28,225 in contig35. Because this Inr motif instance overlaps with a region with low RNA-Seq read coverage, we will define an additional TSS search region based on the extent of the RNA-Seq read coverage (i.e., 28,098–28,372). Given that this additional region is supported by much weaker evidence, we will include this region as part of the wide TSS search region that spans from the start of the RNA-Seq read coverage to the end of the narrow search region (i.e., 28,098–28,998; “Wide Search Region” in Figure 31).
Conclusions
This walkthrough illustrates how we can use a variety of experimental evidence and bioinformatics tools to produce comparative TSS annotations in D. biarmipes. In the first part of the walkthrough, we used the transcriptome resources (e.g., CAGE, DHS, RAMPAGE) produced by modENCODE and other projects to classify the core promoter of the D. melanogaster gene onecut. We begin our comparative TSS annotation by mapping the first transcribed exon of the D. melanogaster onecut gene to the D. biarmipes contig35 sequence using blastn (with sensitive parameters). We then estimated the location of the TSS for onecut using this blastn alignment and searched for the transcription initiator site (Inr) motif using the Short Match functionality of the UCSC Genome Browser. We found that an Inr motif overlaps with the putative TSS we have identified using blastn, which gives us more confidence that we have correctly identified the TSS for onecut in D. biarmipes. However, examination of the RNA PolII ChIP-Seq, RNA-Seq, and Conservation tracks indicate that there might be additional TSS upstream of the annotated TSS. Hence we also defined a TSS search region where additional TSS of onecut might be found.
The second part of the walkthrough uses the Eph ortholog in D. biarmipes to illustrate some of the additional challenges and ambiguities that are associated with the TSS annotations. Examination of the modENCODE 9-state models, DHS positions and TSS (Celniker) annotations indicate that the Eph gene in D. melanogaster has a broad promoter with multiple TSSs. The blastn search for the ortholog of the first transcribed exon (Eph:1) in D. biarmipes contig35 failed to detect this exon, so we used the RNA-Seq read coverage and the TopHat splice junction patterns to infer the placement of exon Eph:1 in D. biarmipes. The search for the Inr motif enables us to identify the best TSS candidate in this region and to define a narrow and a wide TSS search region where additional TSS for the Eph gene might be found.
Once we have collected the TSS annotations and TSS search regions for multiple Drosophila species, we can search for motifs that are enriched in the promoters of Muller F element genes (e.g., using phylogenetic footprinting). Some of these sequences would correspond to transcription factor binding sites and they could help elucidate how Muller F element genes can function within a heterochromatic environment.
Bibliography
-
[Batut et al., 2013] Batut, P., A. Dobin, C. Plessy, P. Carninci, and T. R. Gingeras, 2013 High-fidelity promoter profiling reveals widespread alternative promoter usage and transposon-driven developmental gene expression. Genome Res. 23: 169–180.
-
[Batut and Gingeras, 2013] Batut, P., and T. R. Gingeras, 2013 RAMPAGE: promoter activity profiling by paired-end sequencing of 5'-complete cDNAs. Curr. Protoc. Mol. Biol. Ed. Frederick M Ausubel Al 104: Unit 25B.11.
-
[Hoskins et al., 2011] Hoskins, R. A., J. M. Landolin, J. B. Brown, J. E. Sandler, H. Takahashi et al., 2011 Genome-wide analysis of promoter architecture in Drosophila melanogaster. Genome Res. 21: 182–192.
-
[Juven-Gershon and Kadonaga, 2010] Juven-Gershon, T., and J. T. Kadonaga, 2010 Regulation of gene expression via the core promoter and the basal transcriptional machinery. Dev. Biol. 339: 225–229.
-
[Kharchenko et al., 2011] Kharchenko, P. V., A. A. Alekseyenko, Y. B. Schwartz, A. Minoda, N. C. Riddle et al., 2011 Comprehensive analysis of the chromatin landscape in Drosophila melanogaster. Nature 471: 480–485.
-
[Ohler et al., 2002] Ohler, U., G. Liao, H. Niemann, and G. M. Rubin, 2002 Computational analysis of core promoters in the Drosophila genome. Genome Biol. 3: RESEARCH0087.
-
[Riddle et al., 2012] Riddle, N. C., Y. L. Jung, T. Gu, A. A. Alekseyenko, D. Asker et al., 2012 Enrichment of HP1a on Drosophila chromosome 4 genes creates an alternate chromatin structure critical for regulation in this heterochromatic domain. PLoS Genet. 8: e1002954.
-
[Thomas et al., 2011] Thomas, S., X-Y. Li, P. J. Sabo, R. Sandstrom, R. E. Thurman et al., 2011 Dynamic reprogramming of chromatin accessibility during Drosophila embryo development. Genome Biol. 12: R43.
-
[Zhang et al., 2008] Zhang, Y., T. Liu, C. A. Meyer, J. Eeckhoute, D. S. Johnson et al., 2008 Model-based analysis of ChIP-Seq (MACS). Genome Biol. 9: R137.