Prerequisites
-
Lecture: Annotation of Drosophila
-
Lecture: RNA-Seq Primer
-
BLAST Walkthrough: An Introduction to NCBI BLAST
Resources
-
The GEP UCSC Genome Browser, Gene Record Finder, and the Gene Model Checker are available under the “Resources & Tools” section of the F Element project page
Introduction
The overall GEP gene annotation strategy for the F Element project is discussed in the “Annotation of Drosophila” presentation. This walkthrough illustrates how you can apply the annotation strategy to construct a gene model on the contig10 project from the Drosophila biarmipes Muller F element [Aug. 2013 (GEP/Dot) assembly]. In this walkthrough, we will discuss the strategies for identifying the putative ortholog using BLAST, determining the gene structure using the Gene Record Finder and FlyBase, mapping the individual coding exons using the “Align two sequences” functionality in BLAST, and verifying the final gene model using the Gene Model Checker. Once we have verified the gene model, we will complete the “Gene Report Form” section of the “F Element Project Annotation Report” in preparation for project submission.
Examine the project region
Open a web browser and navigate to the GEP UCSC Genome Browser. Click on the “Genome Browser” link in the left sidebar to access the Genome Browser Gateway page. Enter “D. biarmipes” into the “Enter species, common name or assembly ID” field. Select “Aug. 2013 (GEP/Dot)” under the “D. biarmipes Assembly” field, and enter “contig10” under the “Position/Search Term” field. Click on the “Go” button (Figure 1).

Because the Genome Browser remembers your previous track display settings, we will hide all the evidence tracks and then turn on the subset of evidence tracks that are required for this walkthrough. Scroll down to the list of buttons below the Genome Browser image and then click on the “hide all” button to hide all the evidence tracks (Figure 2).

Use the drop-down boxes in the track configuration sections to change the display options for the following evidence tracks and then click on the “refresh” button (Figure 3):
-
Under “Mapping and Sequencing Tracks”
-
Base Position: full
-
-
Under “Genes and Gene Prediction Tracks”
-
D. mel Proteins: pack
-
Genscan Genes: pack
-
N-SCAN: pack
-
|
|
For this walkthrough, we will only evaluate the results from two gene predictors (i.e., Genscan and N-SCAN). For your own annotation projects, you should evaluate the predictions from all the gene predictors available through the GEP UCSC Genome Browser. The sample Annotation Report that accompanies this walkthrough (Sample_GEP_Annotation_Report.docx) illustrates the protocol that can be used to investigate an extra coding exon predicted by the SNAP gene prediction contig10-snap.3. |

Interpreting the D. mel Proteins track
The “D. mel Proteins” track shows the results of the blastx alignments of D. melanogaster annotated proteins against the D. biarmipes contig10 genomic sequence. This track shows that contig10 contains three regions with sequence similarity to D. melanogaster genes (i.e., CG33978, CG31997, and Arl4). Each rectangle in the “D. mel Proteins” track corresponds to a region of sequence similarity between the D. melanogaster protein (subject) and the translated genomic sequence of the D. biarmipes contig (query). A line connects multiple blastx matches to the same D. melanogaster protein and the direction of the arrows denotes the orientation of the match.
|
|
Because the "D. mel Proteins" track simply demarcates regions with significant sequence similarity, blastx could have merged multiple exons into a single alignment block, missed a weakly conserved exon, or break a large exon into multiple alignment blocks. Consequently, you should not use this track to infer the gene structure (i.e., number or placement of exons) of the putative ortholog. |
|
|
Each protein-coding gene annotated by FlyBase has an annotation symbol that begins with the prefix "CG" (i.e., Computed Gene). FlyBase also assigns a different gene symbol to genes that have been characterized experimentally. (The gene symbol for a gene that has not been characterized experimentally is the same as its annotation symbol.) For example, the gene symbol for ADP ribosylation factor-like 4 is Arl4 and its annotation symbol is CG2219. All the GEP annotation resources and tools refer to D. melanogaster genes using their FlyBase gene symbols. |
The features on the “D. mel Proteins” track are shown in different colors. To better understand the color scheme, click on the “D. mel Proteins” link in the track configuration section (Figure 4).

We can use the controls at the top section of the “D. mel Proteins Track Settings” page to change the display mode and filter the blastx matches by score (Figure 5). The “Description” section mentions that the color of each feature corresponds to its bit score (i.e., the statistical significance of the match). It also includes a table that shows the range of bit scores for each color (warmer color denotes a more significant match). For example, features with bit scores greater than 500 are in red and features that have bit scores between 200 and 500 are in brown. The “Methods” section shows the list of custom blastx parameters that were used to produce this evidence track.
|
|
See "The Statistics of Sequence Similarity Scores" page on the NCBI website for a more comprehensive explanation of bit scores and E-values. |

Click on the “Submit” button to return to the Genome Browser view of contig10. Based on the color scheme of the “D. mel Proteins” track, we know that the red matches to the three isoforms of G33978 and the A and B isoforms of Arl4 are more statistically significant than the brown matches to the A and B isoforms of CG31997 and the C isoform of Arl4.
Interpreting the gene prediction tracks
The Genome Browser includes results from multiple computational algorithms (e.g., Genscan, N-SCAN) which construct gene models based on different criteria and sources of evidence. Examination of the Genscan and N-SCAN gene prediction tracks show that the two gene predictors disagree on the features that are found in the first 30kb of contig10 (Figure 6). Genscan predicted a single gene that spans the first 30kb of the contig while N-SCAN predicted a smaller gene that spans from 25–30kb.

The “D. mel Proteins” track indicates that the first 10kb of contig10 has significant similarity to CG33978 while the region between 25–30kb has significant sequence similarity to CG31997. Hence the “D. mel Proteins” track is in concordance with the N-SCAN prediction contig10.001.1 (blue arrow in Figure 6) and it suggests that Genscan might have merged two adjacent genes into a single feature (contig10.1, red arrow in Figure 6). Consequently, our subsequent analysis will be based on the N-SCAN prediction contig10.001.1 instead of the Genscan prediction.
|
|
This walkthrough will only investigate the feature at 25–30kb. If this were an actual GEP F Element annotation project, you would need to investigate all three regions with blastx alignments and gene predictions. |
Identify the ortholog
The first step in our investigation of the N-SCAN gene prediction contig10.001.1 is to identify the D. melanogaster ortholog. While the “D. mel Proteins” track provides us with an overview of the interesting features within contig10, we should not rely on this track to assign the ortholog. The “D. mel Proteins” track shows the regions of the contig with significant sequence similarity to D. melanogaster proteins but it does not necessarily mean that the contig region contains the best match to the D. melanogaster protein. In addition, multiple genes could appear at the same region of the contig (e.g., because they contain the same conserved domains). Because the rest of the gene annotation is predicated on the identification of the correct ortholog, we should always perform a blastp search of the features of interest against the collection of D. melanogaster annotated proteins in order to confirm the identity the putative D. melanogaster ortholog.
We will search the predicted protein sequence against the collection of annotated proteins sequences in D. melanogaster using the FlyBase BLAST service. Click on the N-SCAN prediction contig10.001.1 on the Genome Browser and then click on the “Predicted Protein” link to retrieve the protein sequence (Figure 7). Select the protein sequence (including the definition line beginning with the “>” symbol), and copy it onto the clipboard.

Open a new tab and then navigate to FlyBase. Click on the “BLAST” button on the upper left of the main page and then paste the predicted protein sequence into the “Sequence” field. Change the “Database” field to “Annotated proteins (AA)” and verify that the “Program” field is set to “blastp: AA → AA”. Under the “Species” section, verify that the checkbox next to “Drosophila melanogaster” is selected (Figure 8). Click on the “BLAST” button to run the blastp search.

Scroll down to the BLAST Hit Summary table. Examination of this table shows that there are two matches (to the B and A isoforms of CG31997) that are much more statistically significant (i.e., have lower E-values) than the rest of the matches (E-values = 3.29824e-66 versus E-values > 1, Figure 9).

Scroll down to the alignment section so that we can examine the blastp alignment to the B isoform of CG31997 (i.e., CG31997-PB). The first line of the alignment output contains the metadata that are associated with the D. melanogaster protein. For example, the “loc” field denotes the genomic location of this protein in the D. melanogaster assembly (Figure 10). The value before the colon corresponds to the chromosome where the protein is found (i.e., chromosome 4, also known as the Muller F element). Because most genes remain on the same Muller element across the different Drosophila species, the fact that CG31997 is located on the Muller F element in D. melanogaster lends further credence to the hypothesis that the contig10 region surrounding the N-SCAN gene prediction contig10.001.1 contains the putative ortholog of CG31997.

|
|
Because the number of chromosomes changes across the different Drosophila species, Hermann Müller developed a nomenclature (A–F) to describe the chromosome arms that are found in most Drosophila species (Muller, 1940). For example, the Muller F element is the 4th chromosome in D. melanogaster but the 6th chromosome in D. mojavensis. See the Synteny Table page at FlyBase for additional information. |
The blastp alignment for CG31997-PB shows that the end of the predicted protein has high levels of sequence similarity with this D. melanogaster protein. However, the beginning of the alignment shows lower sequence similarity with the D. melanogaster protein and the first three amino acids (MMG) of the N-SCAN prediction (Query) are missing from the alignment (Figure 11). Hence, we need to investigate this region further when we construct the D. biarmipes gene model.

Collectively, the blastp search results indicate that the region surrounding the N-SCAN contig10.001.1 prediction in D. biarmipes contig10 likely contains a putative ortholog of the D. melanogaster gene CG31997. However, because of the high error rates associated with gene predictions, we need to perform additional analyses on the entire genomic region surrounding the gene prediction in order to construct the gene model.
Determine the gene structure
Before we can construct the orthologous gene model, we need to ascertain the gene structure (e.g., the number of isoforms and exons) of the D. melanogaster CG31997 gene using the Gene Record Finder. Open a new tab and navigate to the F Element project page on the GEP website. Click on the “Gene Record Finder” link under the “Resources & Tools” section. Enter “CG31997” into the text box and then click on the “Find Record” button (Figure 12).

|
|
By convention, the symbol for a gene in Drosophila begins with a lowercase letter if the mutant phenotype is first characterized by a recessive allele. The gene symbol begins with an uppercase letter for the wild-type phenotype or if the mutant phenotype is first characterized by a dominant allele. See sections 1.2.2 and 1.2.3 of the genetic nomenclature page at FlyBase for additional details. |
The Gene Record Finder shows that CG31997 has two isoforms (A and B) in D. melanogaster (Figure 13). The CDS usage map (under the “Polypeptide Details” tab) shows that both isoforms have the same set of coding exons (i.e., 1_10701_0, 2_10701_2, and 3_10701_1). (The coding exons are ordered from 5' to 3' from left to right in the CDS usage map.) Hence the differences between these two isoforms are limited to the untranslated regions (UTRs).
To visualize the differences between these two isoforms using FlyBase JBrowse, click on the “View in JBrowse” link under the “Graphical Viewer” column in the “Gene Details” section (Figure 13). (A graphical overview of the two isoforms is also available under the “mRNA Details” section.)

Consistent with the Gene Record Finder record, the JBrowse “RNA” track shows that the coding exons (orange boxes) are the same in the A and B isoforms of CG31997. The difference between the two isoforms is found in the UTRs (grey boxes). Specifically, the 3' UTR of the B isoform overlaps with but is longer than the 3' UTR of the A isoform (Figure 14).
|
|
In Drosophila, the suffix following the gene name corresponds to the name of the isoform. The "-R" suffix corresponds to a RNA record whereas the "-P" suffix corresponds to the protein record. This means that CG31997-RB is the mRNA record and CG31997-PB is the protein record for the B isoform of CG31997. |

Based on parsimony (i.e., minimizing the number of changes compared to D. melanogaster), we expect to find both the A and B isoforms of CG31997 in our D. biarmipes contig10 sequence. For this walkthrough, we will only focus on the annotation of the coding exons. Consequently, we only need to determine the coordinates of the three coding exons (CDS) for one of the isoforms (e.g., isoform B) because the set of coding exons for both the A and B isoforms are the same.
Determine the approximate location of the coding exons
The next step in our analysis is to use each exon in a BLAST search against the contig10 DNA sequence to determine the approximate position of each coding exon of CG31997-PB in our contig10 project. Because the BLAST algorithm does not take the positions of potential splice sites into account when it generates the alignment, BLAST often extends the alignment beyond the coding exon boundary and into the intron. To ameliorate this issue, the GEP annotation protocol recommends mapping each coding exon separately to determine their approximate locations and then further refine the exon boundaries by searching for compatible splice donor and acceptor sites by visual inspection using the GEP UCSC Genome Browser. The ultimate goal of this step is to identify the exact beginning and ending coordinates of each coding exon.
In addition to comparing a query sequence against a collection of subject sequences in a database (e.g., nr, RefSeq), the NCBI BLAST web service also allows us to compare two or more sequences against each other (using the program bl2seq). In order to map the amino acid sequences of each CDS against the contig10 sequence, we must translate the entire contig10 sequence in all six reading frames (i.e., three reading frames in the plus and minus strands, respectively) and then compare each conceptual translation against the CDS sequence. This means that we can use either tblastn or blastx to perform this search (depending on whether we treat the CDS sequence as the query or the subject sequence, respectively). In this walkthrough, we will perform blastx searches using the contig10 genomic sequence as the query and each CDS sequence as the subject.
To set up this blastx search, open a new tab and navigate to the NCBI BLAST website. Click on the “blastx” image under the “Web BLAST” section (Figure 15) and then select the “Align two or more sequences” checkbox.

In order to perform the blastx search, we need to obtain the genomic sequence for contig10. For this walkthrough, the sequence file is available in the exercise package (contig10.fasta). Click on the “Browse…” or the “Choose File” button in the “Enter Query Sequence” section and select the contig10.fasta file. Alternatively, you can obtain the genomic sequence using the “DNA” link (under the “View” menu) on the GEP UCSC Genome Browser (Figure 16), and then copy and paste the sequence into the “Enter Query Sequence” textbox. If you use the latter method, make sure to change the “Position” field to the name of the project (e.g., contig10) in the “Get DNA for” window in order to retrieve the genomic sequence for the entire contig.
|
|
For the GEP annotation projects, the contig sequence file is available in the "src" folder of the annotation package. |

For the subject sequence, we can use the Gene Record Finder to retrieve the amino acid sequence for each CDS. Instead of searching each CDS starting with the first exon, and proceeding from 5' to 3', we recommend searching for sequence similarity using the larger CDS’s first to anchor the gene model. (Many genes in D. melanogaster have small initial CDS, which can be difficult to find.) The size of each CDS is listed in the “Size (aa)” column of the CDS sequence table. In this case, the CDS 3_10701_1 is the largest CDS (with 62aa) among the three CDS’s in CG31997.
Select the “Gene Record Finder” tab in your web browser and click on the row with the FlyBase ID “3_10701_1” in the CDS sequence table, select the sequence in the “Sequence viewer” panel (including the header which begins with a > sign) and copy it onto the clipboard (Figure 17).

Select the NCBI BLAST web browser tab and paste the sequence for CDS 3_10701_1 into the “Enter Subject Sequence” text box (Figure 18). For the query sequence, verify you have either selected the contig10.fasta file under the “Or, upload file” field, or you have pasted the genomic sequence for contig10 into the “Enter Query Sequence” text box.

The default NCBI BLAST parameters are optimized for searching the query sequence against a large collection of sequences in a database. When we are using BLAST to compare only two sequences against each other, we need to change some of these alignment parameters because the default parameters could potentially mask the conserved regions of the coding exon.
Click on the “Algorithm parameters” link to expand this section. Change the “Compositional adjustments” field to “No adjustment” and uncheck the “Low complexity regions” filter under the “Filters and Masking” section. To reduce the number of spurious matches, we will also change the “Expect threshold” to “1e-2” under the “General Parameters” section. Because NCBI BLAST uses different word sizes for database versus bl2seq searches, we should also verify that the “Word size” parameter is set to “3” (Figure 19). Click on the “BLAST” button to run the blastx search.

|
|
Because the E-value of a BLAST hit depends on the length of the alignment, you may need to increase the "Expect threshold" in order to detect sequence similarity to short CDS’s. (Shorter alignments have higher E-values because they are more likely to occur by chance.) |
|
|
By default, NCBI blastp, blastx, and tblastn use a word size of 6 for database searches and a word size of 3 for bl2seq searches. The larger word size improves the performance of BLAST but it might miss matches to short protein sequences with weak sequence similarity. Hence we should verify that the word size parameter (under the "Algorithm parameters" section) is set to 3 when we use BLAST to compare a CDS sequence against the contig sequence. |
The blastx results show only a single match (with E-value 6e-39) to the CDS 3_10701_1 (Figure 20). Click on the “Alignments” tab to view the corresponding blastx alignment. The “Subject” coordinates show that the alignment covers all 62aa of the CDS. The “Query” coordinates correspond to the region within contig10 (i.e., 27,286–27,471) that shows sequence similarity to CDS 3_10701_1 when it is translated in the first reading frame in the positive strand (i.e., frame +1). Hence we can place CDS 3_10701_1 27,286–27,471 on contig10.
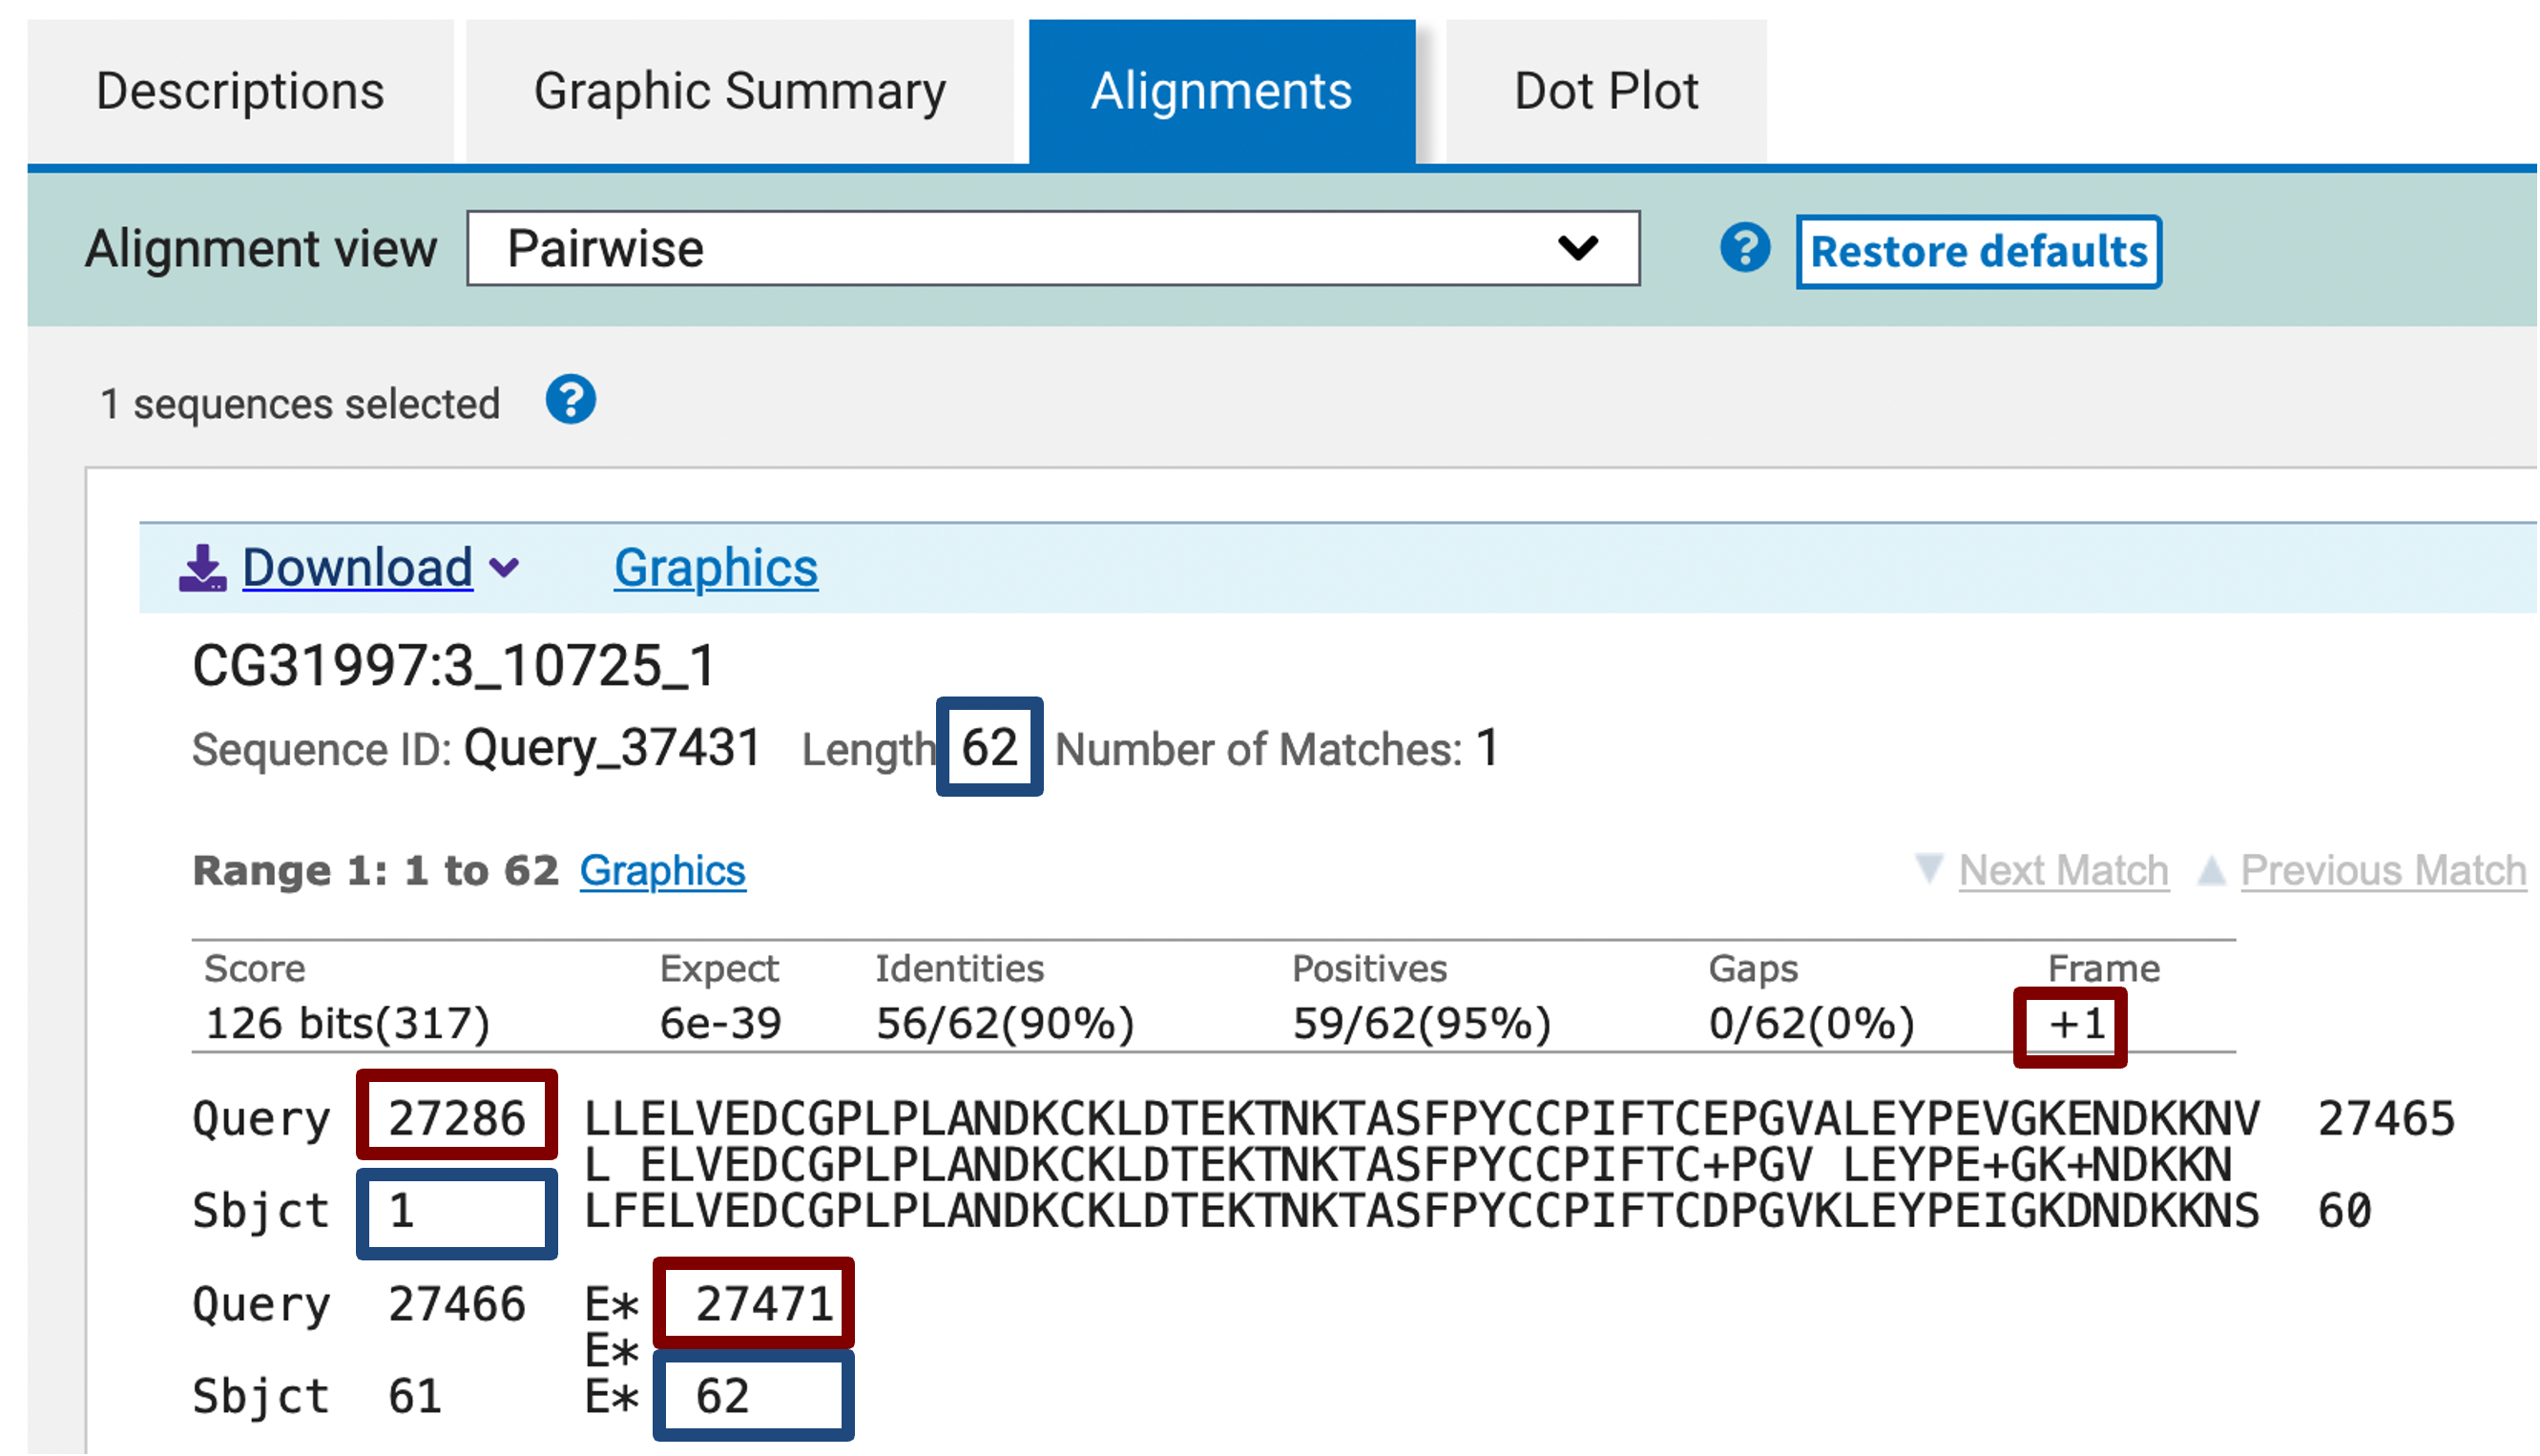
We can apply the same procedure to place the other two CDS’s on contig10. The blastx search of the next largest CDS (1_10701_0) shows only a partial alignment (at 25,685–25,834 in frame +2) with an E-value of 7e-12 (Figure 21). The first two amino acids of the CDS is missing from the alignment and the beginning of the CDS shows lower sequence similarity to contig10 than the end of the CDS. However, this is the only match with an E-value that is less than 1e-2 within contig10.

The blastx search of CDS 2_10701_2 against contig10 placed this CDS at 27,081–27,194 in frame +3. However, the last amino acid of this CDS is missing from the alignment (Figure 22).

The results of the blastx exon-by-exon searches are summarized in the table below:
| FlyBase ID | CDS Size | Query Range | Query Frame | Subject Range |
|---|---|---|---|---|
1_10701_0 |
46 |
25685-25834 |
+2 |
3-46 |
2_10701_2 |
39 |
27081-27194 |
+3 |
1-38 |
3_10701_1 |
62 |
27286-27471 |
+1 |
1-62 |
Examination of the query ranges for the blastx alignments of the three CDS of CG31997 shows that they are collinear: all the CDS’s are placed on the positive strand and the query ranges for the CDS’s are in ascending order. Consequently, despite the amino acids that are missing from the blastx alignments, the exon-by-exon search results support the hypothesis that the putative ortholog of CG31997 is located at 25–28kb of the D. biarmipes contig10.
Using RNA-Seq data to verify the placement of the initial coding exon
While the best blastx alignment placed the initial CDS 1_10701_0 at 25,685-25,834 in contig10, the start codon of this initial CDS is missing from the alignment. In addition, the alignment to the beginning of the CDS shows much weaker sequence similarity to contig10 than the end of the CDS (Figure 21). Consequently, we would have more confidence in the annotation of this CDS if it were supported by RNA expression data.
As part of the modENCODE project, the Baylor College of Medicine Human Genome Sequencing Center (BCM–HGSC) has produced RNA-Seq data for D. biarmipes using the adult males, adult females, and mixed embryos samples. These RNA-Seq reads (100–125bp in length) are derived primarily from processed mRNA (i.e., after the introns have been removed). Hence genomic regions with RNA-Seq read coverage usually correspond to transcribed exons (i.e., include both the translated and untranslated regions).
|
|
See the "RNA-Seq Primer" for an overview on the different types of RNA-Seq data available on the GEP UCSC Genome Browser. |
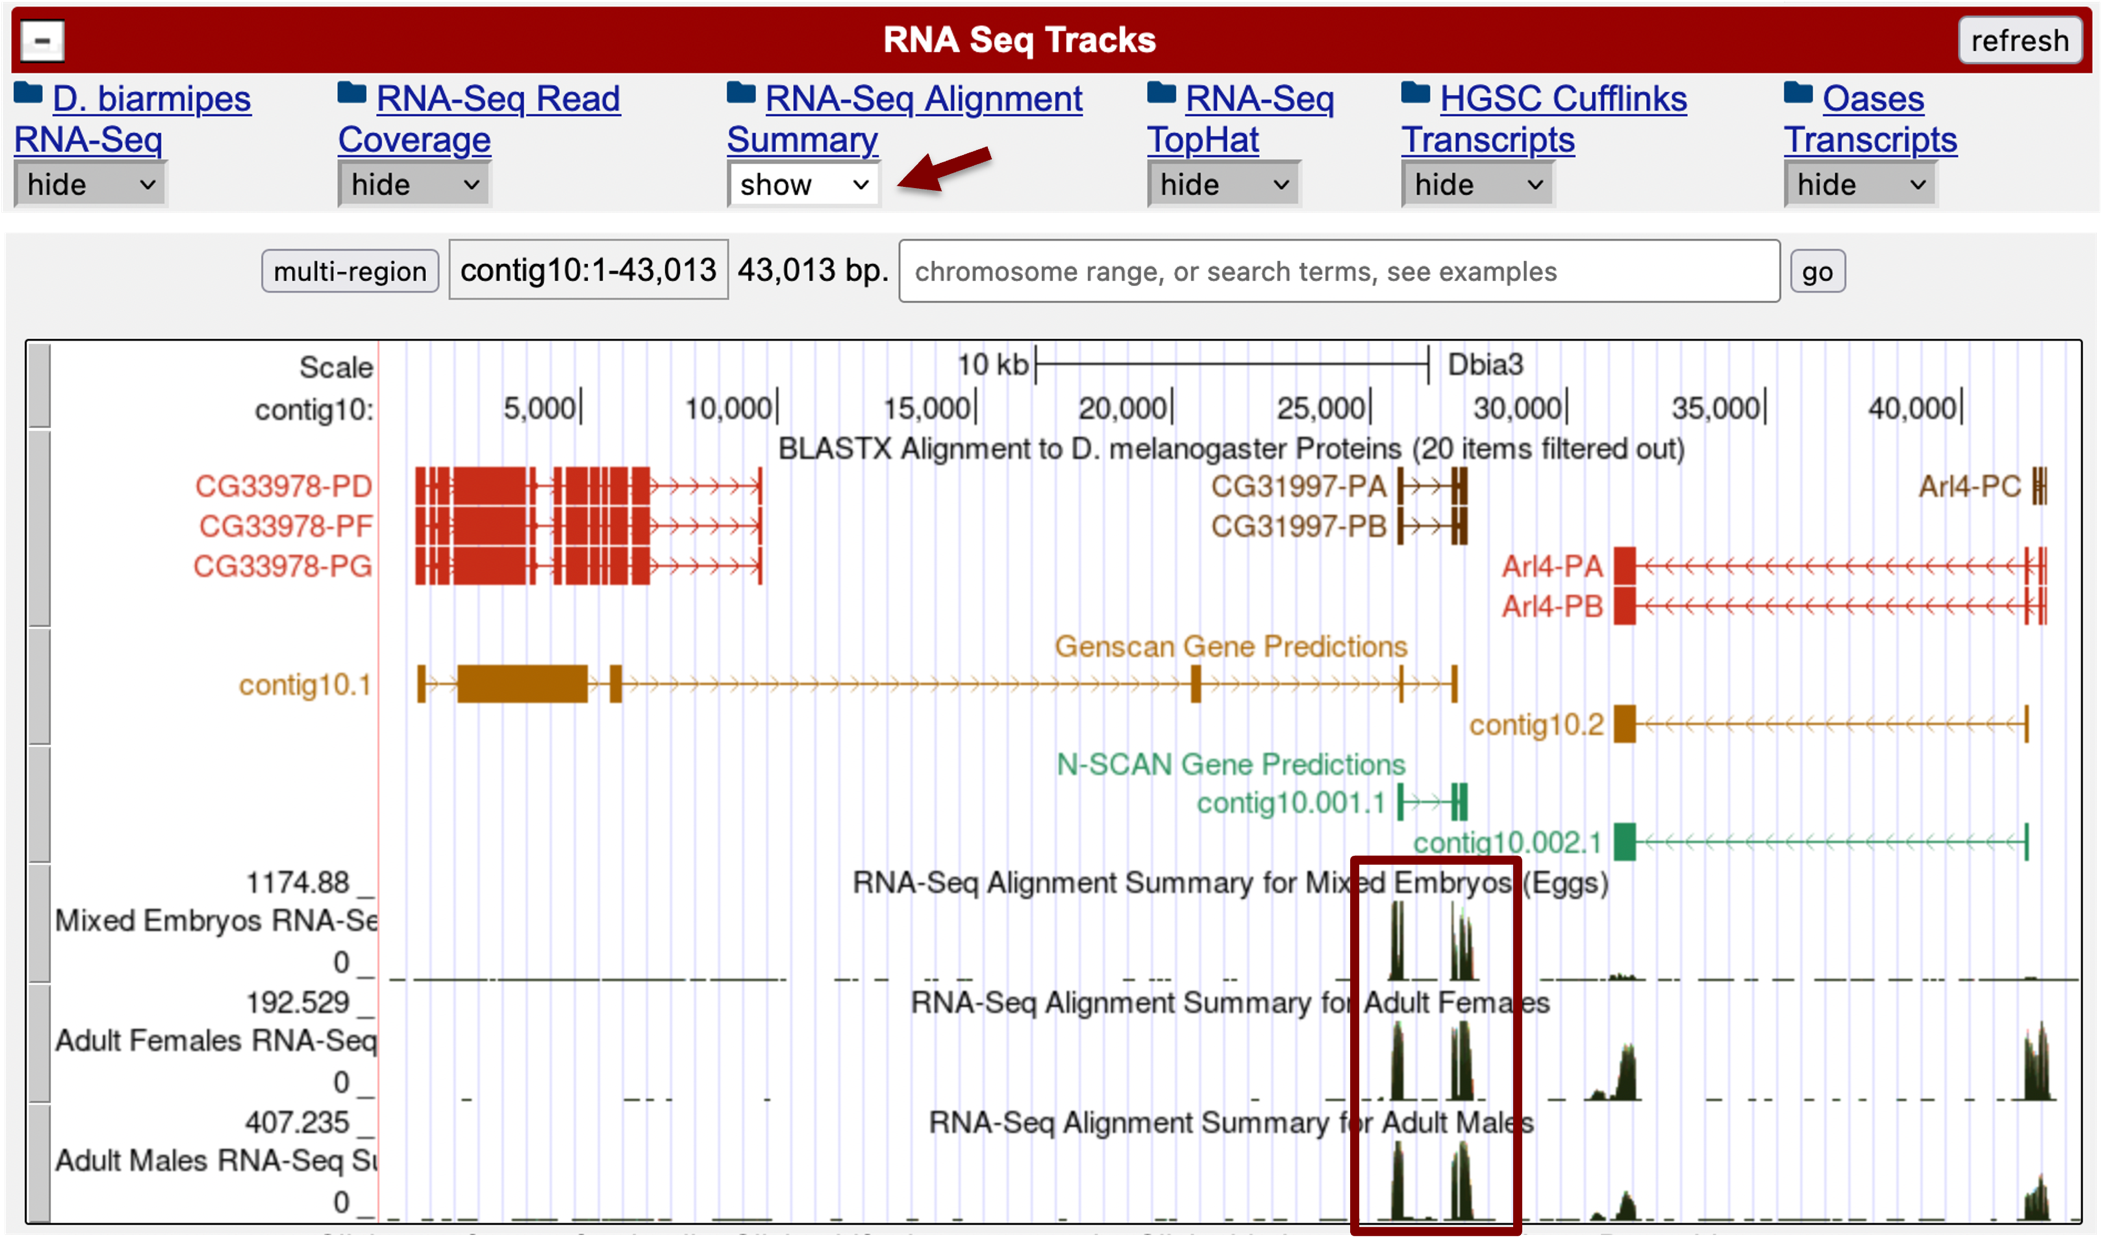
To visualize the RNA-Seq data for D. biarmipes, go back to the web browser tab with the GEP UCSC Genome Browser, change the display mode for the “RNA-Seq Alignment Summary…” track to “show” and then click on the “refresh” button. The three new evidence tracks that appear on the Genome Browser correspond to the three samples where RNA-Seq data are available (i.e., mixed embryos, adult females, and adult males). The height of the histograms within each track corresponds to the number of RNA-Seq reads that have been mapped to each position of the D. biarmipes contig10 sequence. Hence the RNA-Seq summary track shows that CG31997 has the highest level of expression among the three features in contig10 (Figure 23).
|
|
By default, the scale of the "RNA-Seq Alignment Summary" and the "RNA-Seq Read Coverage" tracks will change automatically based on the minimum and maximum read depth within the genomic region you are viewing. |
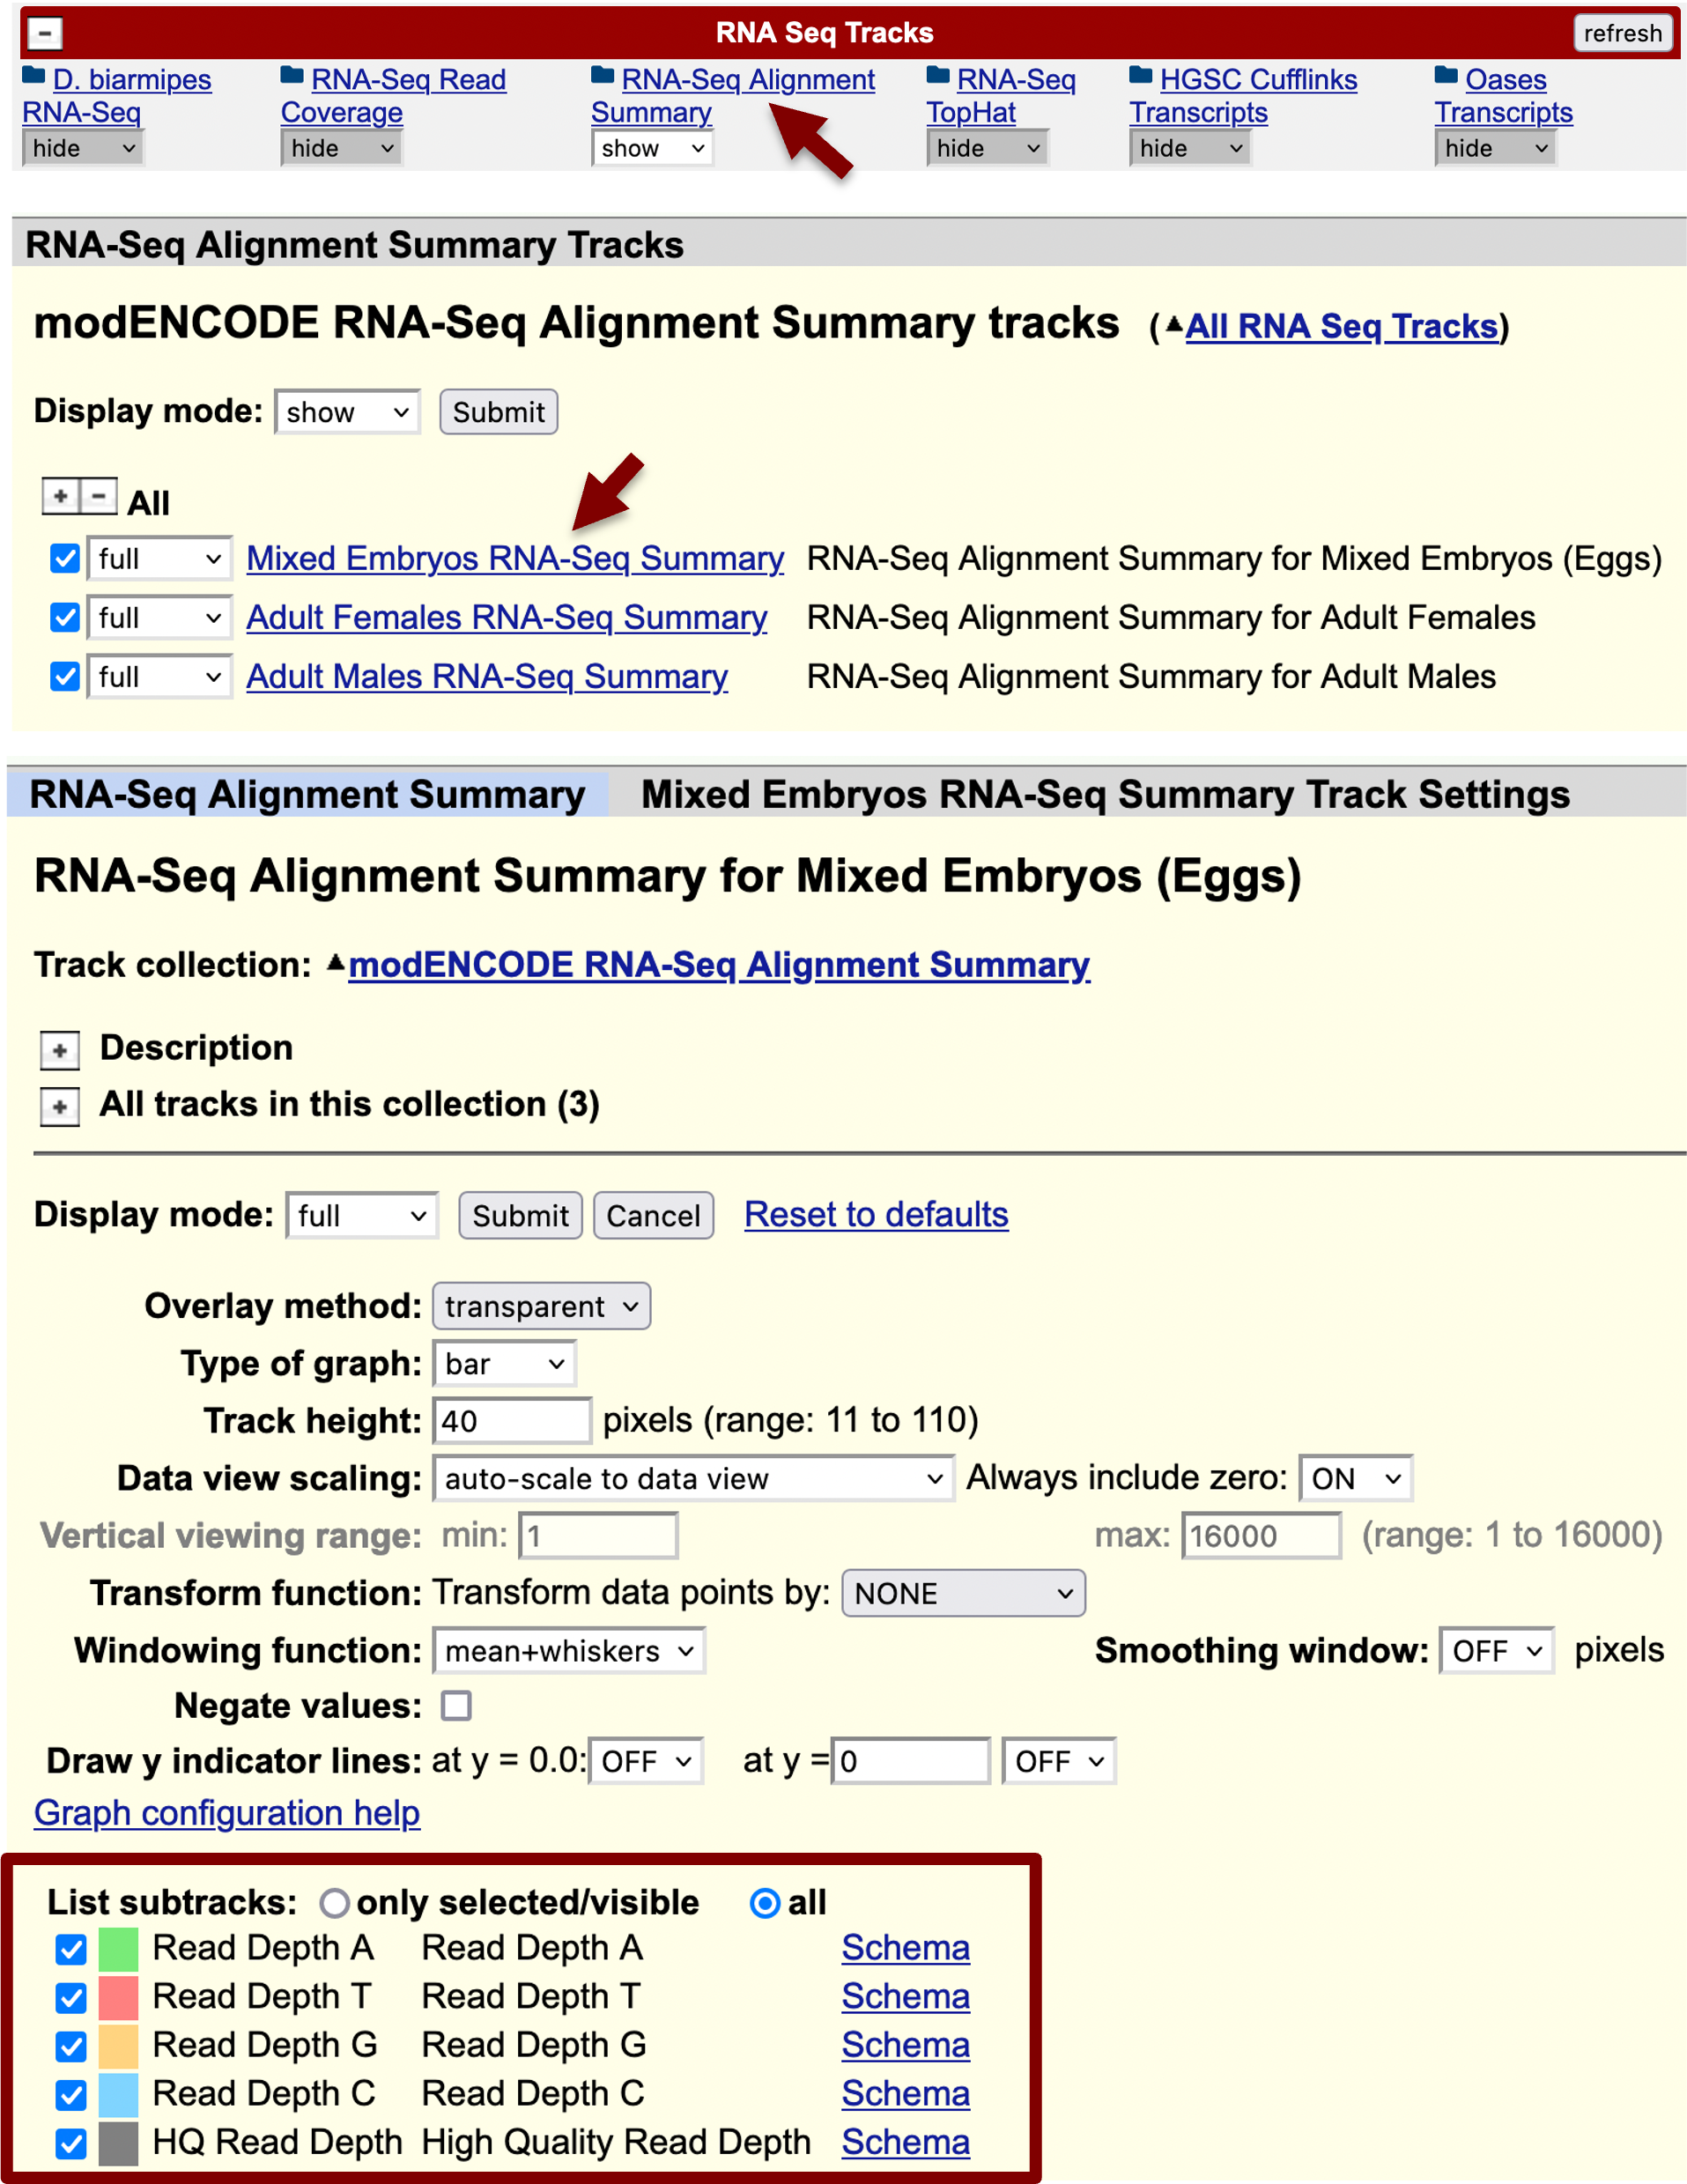
To learn more about the display conventions of the RNA-Seq Alignment Summary tracks, click on the “RNA-Seq Alignment Summary” link under the “RNA Seq Tracks” section and then click on the “Mixed Embryos RNA-Seq Summary” link. Under the “List subtracks” section, we find that the green, red, orange, and blue colors correspond to the read depth of each nucleotide (A, T, G, and C, respectively) while the grey color corresponds to the number of reads that have high mapping quality at each genomic position (Figure 24). We can use the controls on the track settings page to alter the display settings of the Alignment Summary Tracks.
|
|
Regions with high read depth but low mapping quality (bright bases in the Alignment Summary track) are often caused by differences between the RNA-Seq reads and the contig sequence. These discrepancies could be caused by errors in the contig sequence. See the "Sequence Updater User Guide" for additional details on how to identify and report errors in the contig sequence. |
To ascertain if the blastx alignment for CDS 1_10701_0 at 25,685–25,834 is supported by the RNA-Seq data and to determine the location of the start codon, enter “contig10:25685-25834” into the “chromosome range, or search terms” text box and then click on the “go” button. Zoom out 3x so that we can examine the region surrounding the blastx alignment block.
The RNA-Seq Alignment Summary tracks for all three samples show high RNA-Seq read depth within and upstream of the blastx alignment block, consistent with the hypothesis that this region is being transcribed in D. biarmipes. The blastx alignment for CDS 1_10701_0 begins at 25,685 in frame +2. Examination of the “Base Position” track in the Genome Browser shows that there is only a single start codon (green rectangle) upstream of 25,685 (at 25,673–25,675) in frame +2 before the first stop codon (red rectangle) at 25,640–25,642 (Figure 25).
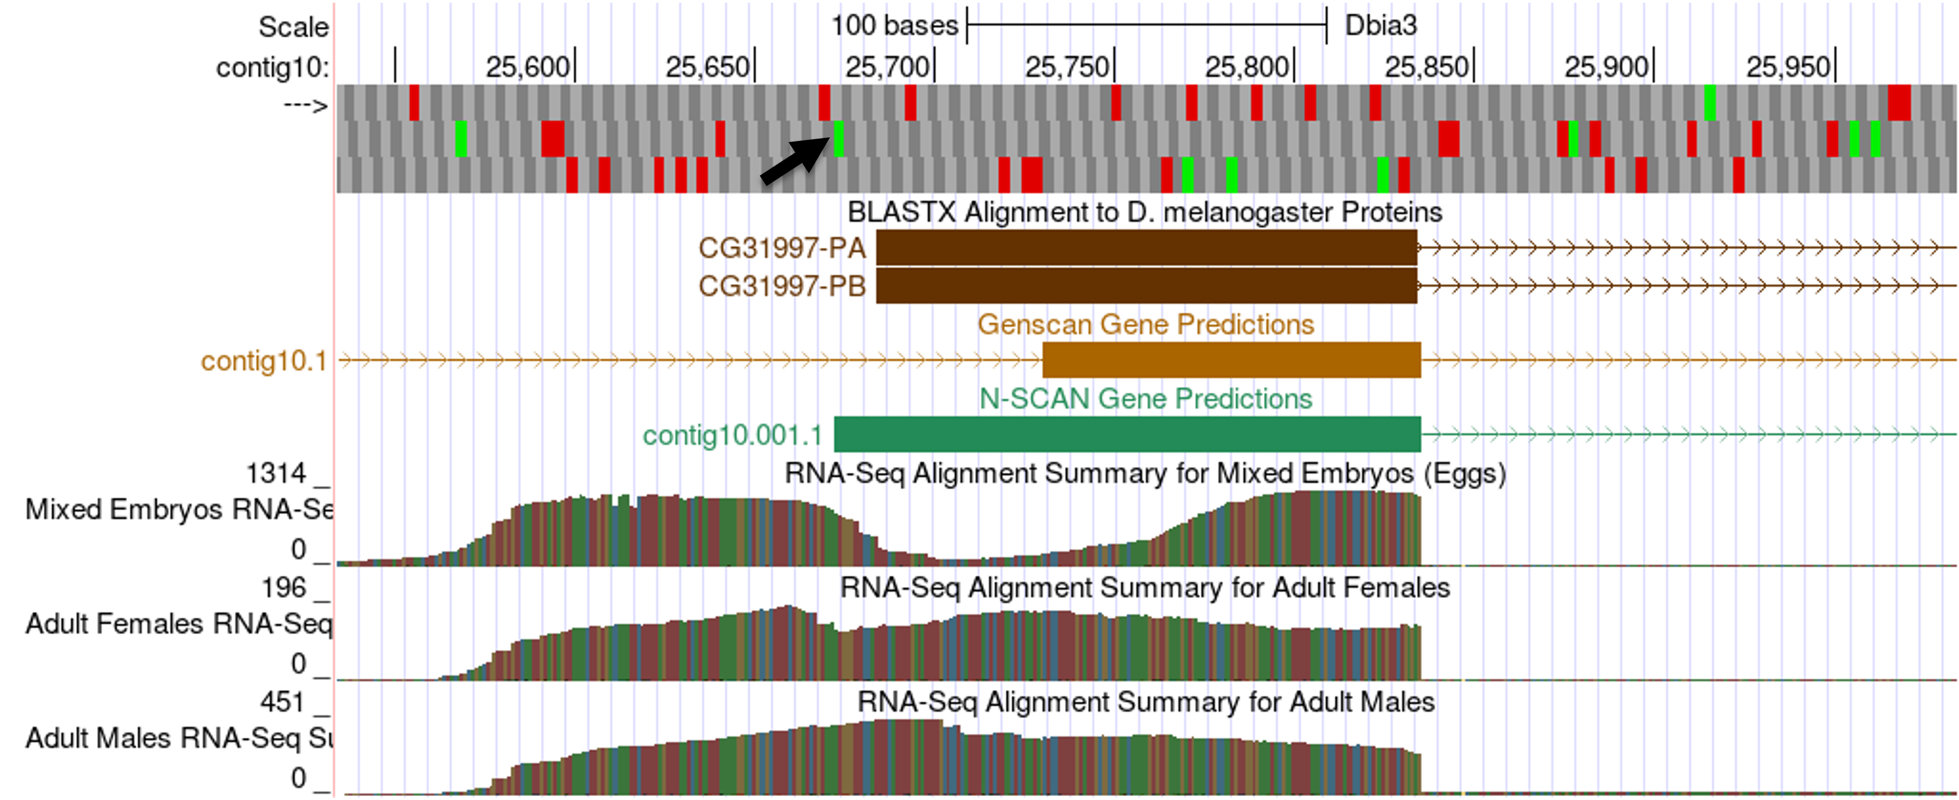
Using this start codon at 25,673–25,675 in our gene model will increase the size of this CDS compared to the orthologous CDS in D. melanogaster. However, this is the only start codon available that would allow us to preserve both isoforms of CG31997 in D. biarmipes. The expansion of this CDS 1_10701_0 relative to the D. melanogaster is also supported by the available RNA-Seq data and the N-SCAN gene prediction. Consistent with the D. melanogaster gene model (Figure 14), the RNA-Seq coverage upstream of the start codon likely corresponds to the 5' UTR.
|
|
See the "Browser-Based Annotation and RNA-Seq Data" exercise for a more detailed discussion of the challenges associated with interpreting RNA-Seq data. |
|
|
While regions with RNA-Seq read coverage is a strong indicator of transcription, we should treat the lack of RNA-Seq coverage as a negative result. For example, a transcript might only be expressed at low levels or at a tissue or developmental time point that have not been sampled by RNA-Seq. |
Identifying splice sites
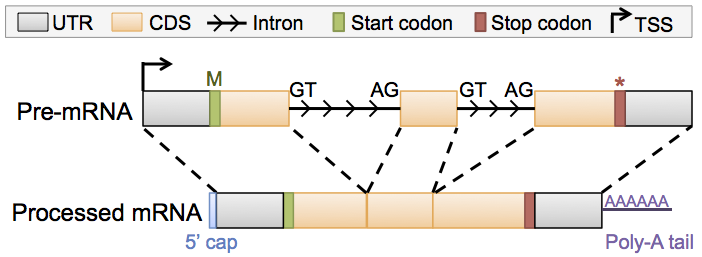
Using the combination of the exon-by-exon blastx alignments and the RNA-Seq data, we can define the span of the coding region for the CG31997-PB ortholog in D. biarmipes contig10 (i.e., 25,673–27,471). The next step of our annotation is to identify the exon boundaries for the three CDS’s in our gene model. For eukaryotic genes with multiple coding exons, introns in the pre-messenger RNA (pre-mRNA) are usually removed by the spliceosome prior to the translation of the mature mRNA into a protein product. (In some cases, introns in the pre-mRNA can also be excised by self-splicing introns that form a ribozyme.) The 5' end of the intron (i.e., splice donor site) usually has the sequence GT (GU in the pre-mRNA) while the 3' end of the intron (i.e., splice acceptor site) usually has the sequence AG (Figure 26).
|
|
In D. melanogaster, approximately 99% of the introns have a GT splice donor site and 1% of the introns have a GC non-canonical splice donor site. Almost all of the introns have an AG splice acceptor site. U12-type introns have an AT splice donor site and an AC splice acceptor site but they are rare in D. melanogaster (found in less than 1% of all unique introns). The GEP comparative annotation protocol posits that all introns have a GT splice donor site and an AG splice acceptor site unless the D. melanogaster gene model uses a non-canonical splice site or the non-canonical splice site is supported by RNA-Seq data. |
Determine the phases of the donor and acceptor splice sites
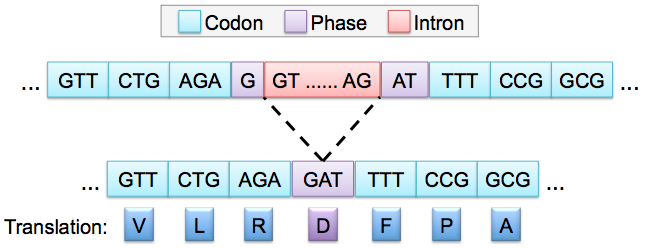
During splicing, introns (which usually begins with a GT and ends with an AG) are removed from the pre-mRNA so that adjacent exons are placed next to each other. This means that the ends of an exon do not necessarily correspond to the ends of the complete codon. The number of nucleotides between the last complete codon and the splice donor site is known as the phase of the splice donor site. Similarly, the number of nucleotides between the splice acceptor site and the first complete codon is known as the phase of splice acceptor site. Because the phases of the splice sites depend on the placement of the complete codon, the phases of the donor and acceptor sites are predicated on the reading frame of each CDS.
In addition, in order to maintain the open reading frame across adjacent CDS’s, the phases of the donor and acceptor sites of adjacent CDS’s must be compatible with each other. Specifically, the sum of the donor and acceptor phases of adjacent CDS’s must either be 0 (i.e., no additional codon) or 3 (i.e., a complete codon). The use of incompatible splice donor and acceptor sites will introduce a frame shift into the translation of the CDS following the splice acceptor site.
Because the blastx alignment for the initial CDS (1_10701_0) of CG31997-PB terminates at 25,834 and the alignment includes the last amino acid of this CDS (Figure 21), we expect to find the splice donor site for this CDS at around position 25,834 of contig10.
To examine this region more closely in the Genome Browser, enter “contig10:25834” into the “chromosome range, or search terms” text box and then click on the “go” button. Zoom out 10x and then zoom out another 3x to examine the 30bp surrounding this position. The GT splice donor site closest to 25,834 is located at 25,836–25,837. This splice donor site is in phase 2 relative to frame +1, in phase 1 relative to frame +2, and in phase 0 relative to frame +3 (Figure 27).
However, because the reading frame of this CDS is dictated by the blastx alignment (i.e., frame +2, Figure 21), the splice donor site at 25,836–25,837 is in phase 1. This means that the splice acceptor site of the adjacent CDS must be in phase 2 in order to maintain the open reading frame.
The GEP annotation strategy prefers the gene model that minimizes the number of changes compared to D. melanogaster (i.e., the most parsimonious gene model). Because the total change in the size of the coding region depends on the positions of both the splice donor and acceptor sites, we should identify the locations of alternate splice donor site candidates in the region surrounding the blastx alignments. We can then select the pair of compatible splice donor and acceptor sites that is best supported by the available expression data and computational predictions while also minimizing the change in the total size of the coding region compared to D. melanogaster.
In principle, we can search for potential splice donor site candidates up to the end of the first in-frame stop codon (i.e., 25,843). For CDS 1_10701_0, the closest phase 0 splice donor site relative to frame +2 is located at 25,826–25,827 while the closest splice donor site in phase 2 is located at 25840–25841 (Figure 28).

In order to ascertain which of the three potential splice donor sites is the best candidate, we need to determine the phase of the splice acceptor site for the next CDS. Because the blastx alignment shows that the first amino acid of the next CDS (2_10701_2) aligns to contig10 at 27,081-27,083 in frame +3 (Figure 22), we will examine this region more closely using the Genome Browser to determine the phase of the best acceptor site.
Enter “contig10:27081” into the “chromosome range, or search terms” text box and then click on the “go” button. Zoom out 10x and then zoom out another 3x to examine the 30bp region surrounding this position. There is only a single splice acceptor site (at 27,077–27,078) within this region and this splice acceptor site is in phase 2 relative to frame +3 (Figure 29). Gene predictions from Genscan and N-SCAN as well as the RNA-Seq read coverage all support this potential splice acceptor site.
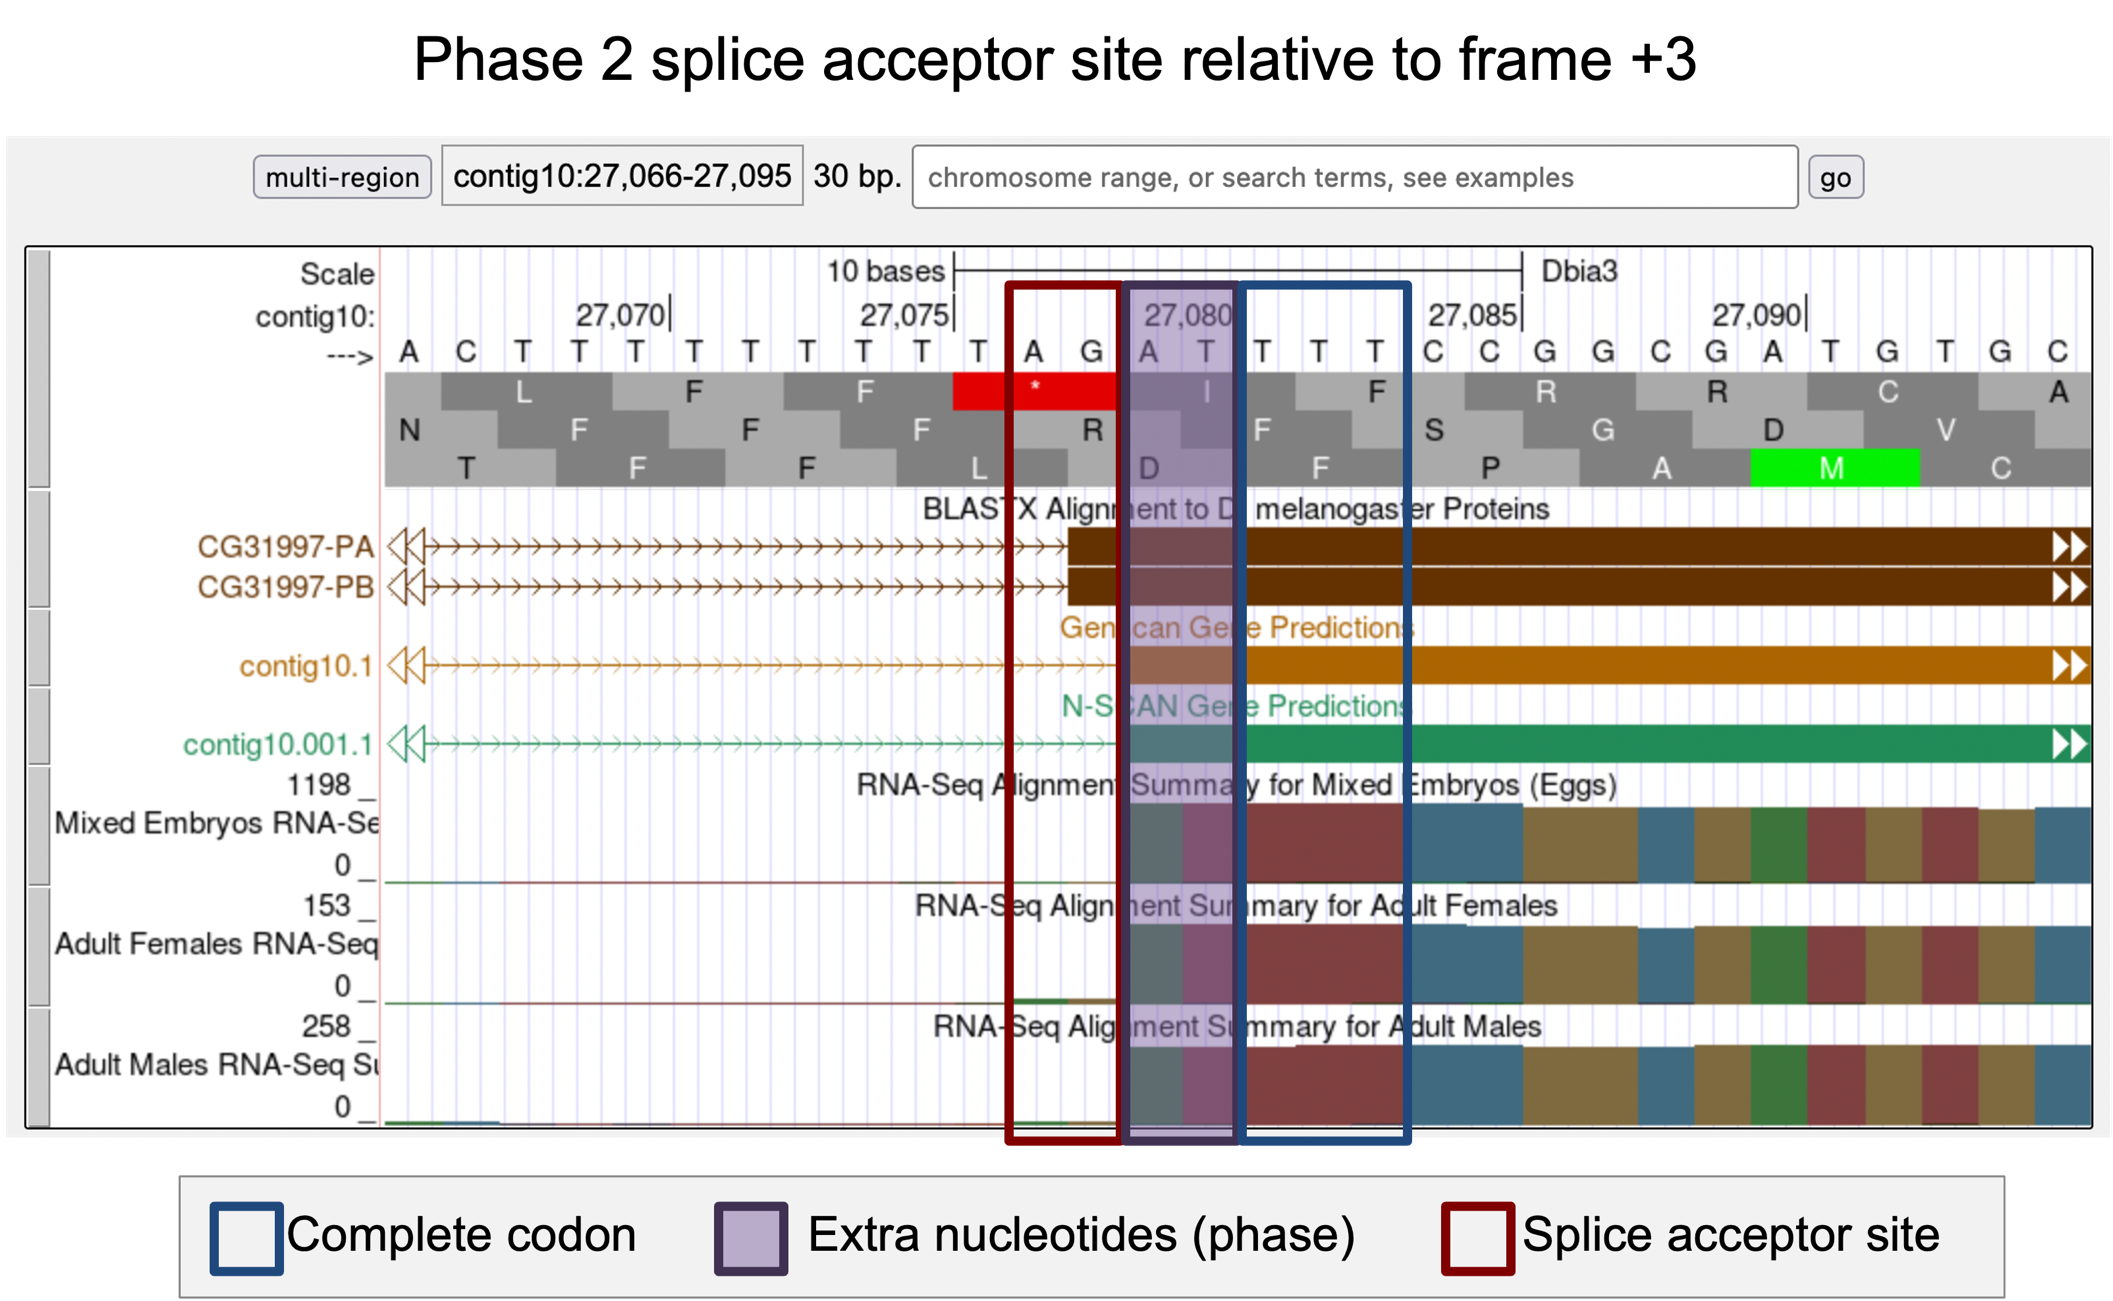
This phase 2 splice acceptor site is compatible with the phase 1 donor site at 25,836–25,837 that we have identified earlier for CDS 1_10701_0. The extra nucleotides (i.e., G + AT) near the splice sites will form an additional amino acid (D, Figure 30). Collectively, our analysis suggests that the CDS 1_10701_0 ends at 25,835 with a phase 1 splice donor site and CDS 2_10701_2 begins at 27,079 with a phase 2 splice acceptor site.
Verifying splice junctions using TopHat predictions
In addition to sequence similarity to the D. melanogaster CDS’s that have been detected by blastx, this splice junction is supported by Genscan, N-SCAN as well as the coverage of RNA-Seq reads in the mixed embryos, adult females, and adult males samples. We can gather additional evidence to support this splice junction using the RNA-Seq analysis tool called TopHat.
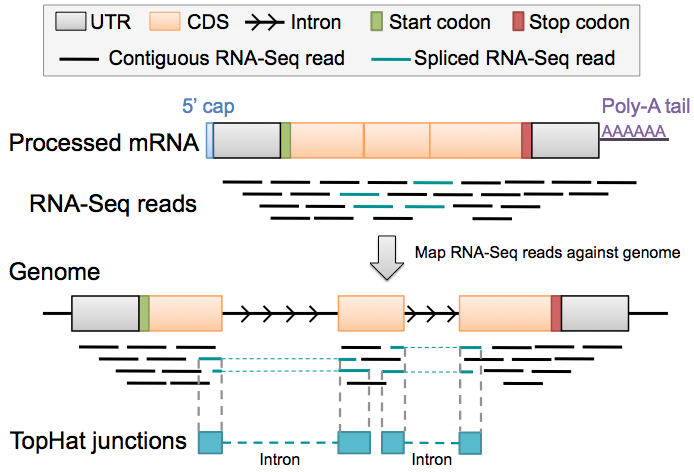
Because the RNA-Seq reads are derived primarily from processed mRNAs (where the introns have been removed), the subset of RNA-Seq reads that span multiple exons (i.e., spliced RNA-Seq reads) can provide us with additional evidence for a splice junction. When we map a spliced RNA-Seq read against the genome, part of the spliced read will map to one exon while the rest of the read will map to another exon. The region between these two alignment blocks would correspond to the intron. Splice site prediction tools such as TopHat and regtools can recognize this distinct mapping pattern of spliced RNA-Seq reads in order to infer the possible locations of the splice junction (Figure 31).
|
|
The width of the boxes in the "RNA-Seq TopHat" track corresponds to the extent of the spliced RNA-Seq reads that support the splice junction (grey dotted lines in Figure 31). The most important part of a TopHat prediction in the "RNA-Seq TopHat" track is the line that connects the two boxes because it corresponds to the intron inferred by TopHat. |
To view the TopHat splice junction predictions for the first intron of CG31997, scroll down to the “RNA Seq Tracks” section and change the display mode for the “RNA-Seq TopHat” track to “pack” (Figure 32, top). Enter “contig10:25673-27194” into the “chromosome range, or search terms” text box and then click “go” so that we can visualize the genomic region between the first and second coding exons.
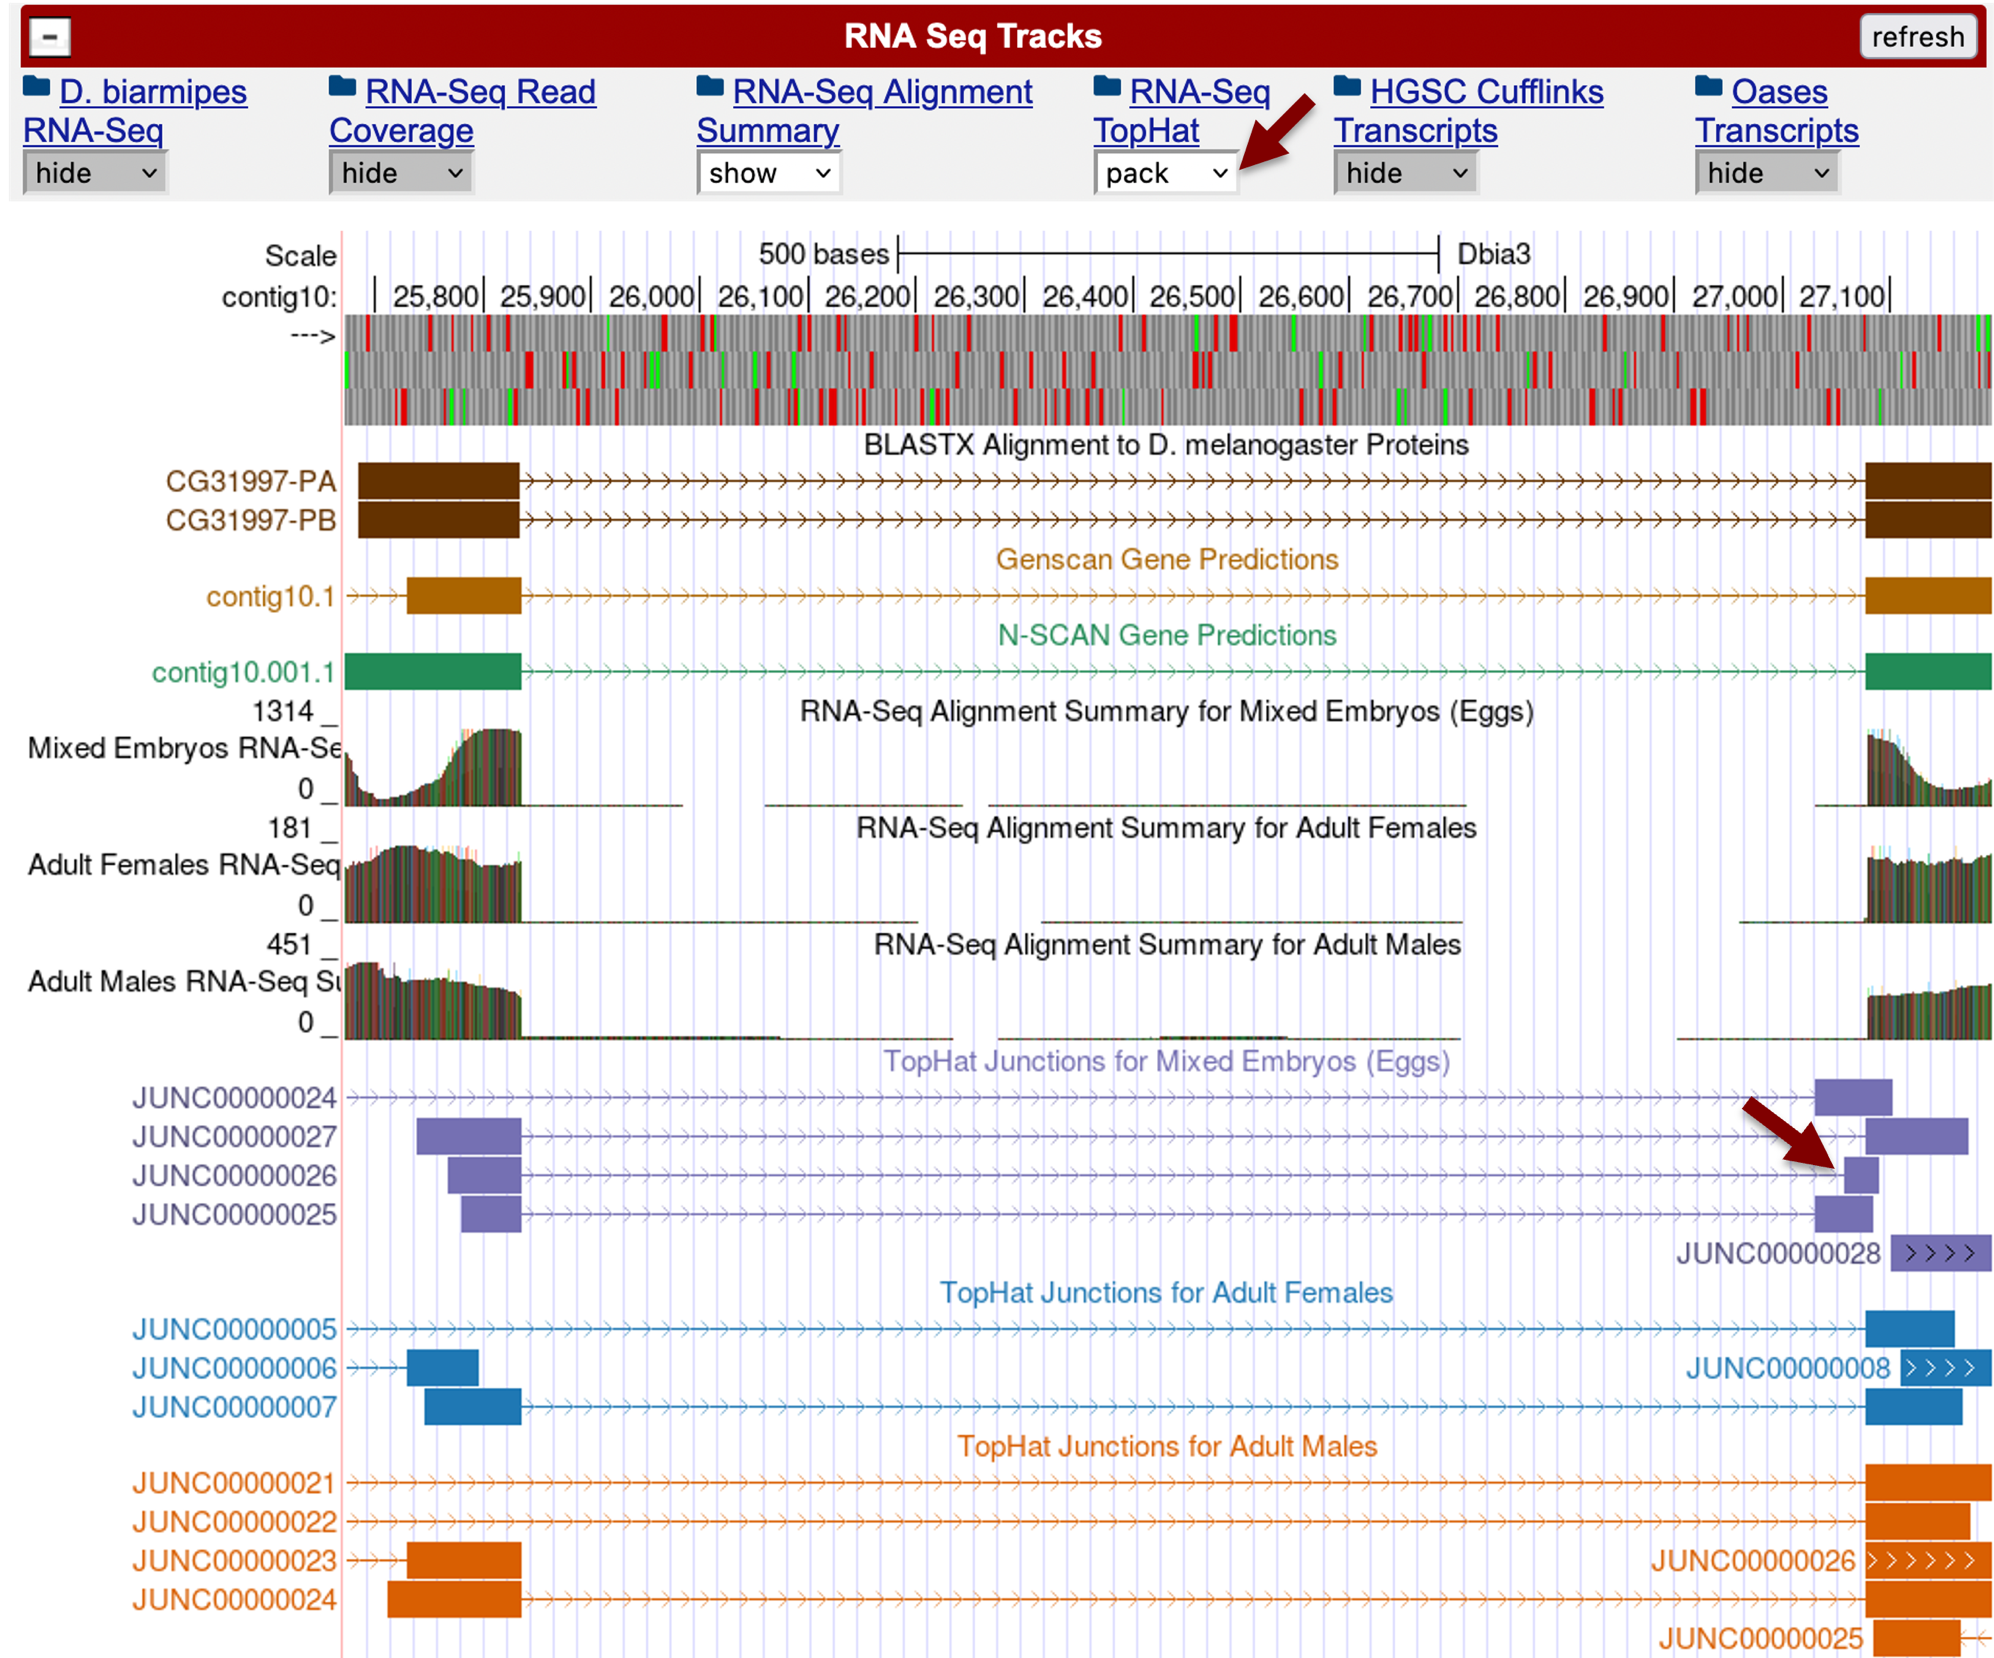
Examination of the features in the “TopHat junctions for Mixed Embryos” shows that the TopHat splice junction prediction JUNC00000027 is consistent with our annotated splice acceptor site for CDS 2_10701_2 at 27,077–27,078. However, TopHat also predicted two additional splice acceptor sites (i.e., JUNC00000025 and JUNC00000026) further upstream (red arrow in Figure 32, bottom). Hence we need to examine these splice junctions to determine if they are valid splice acceptor sites.
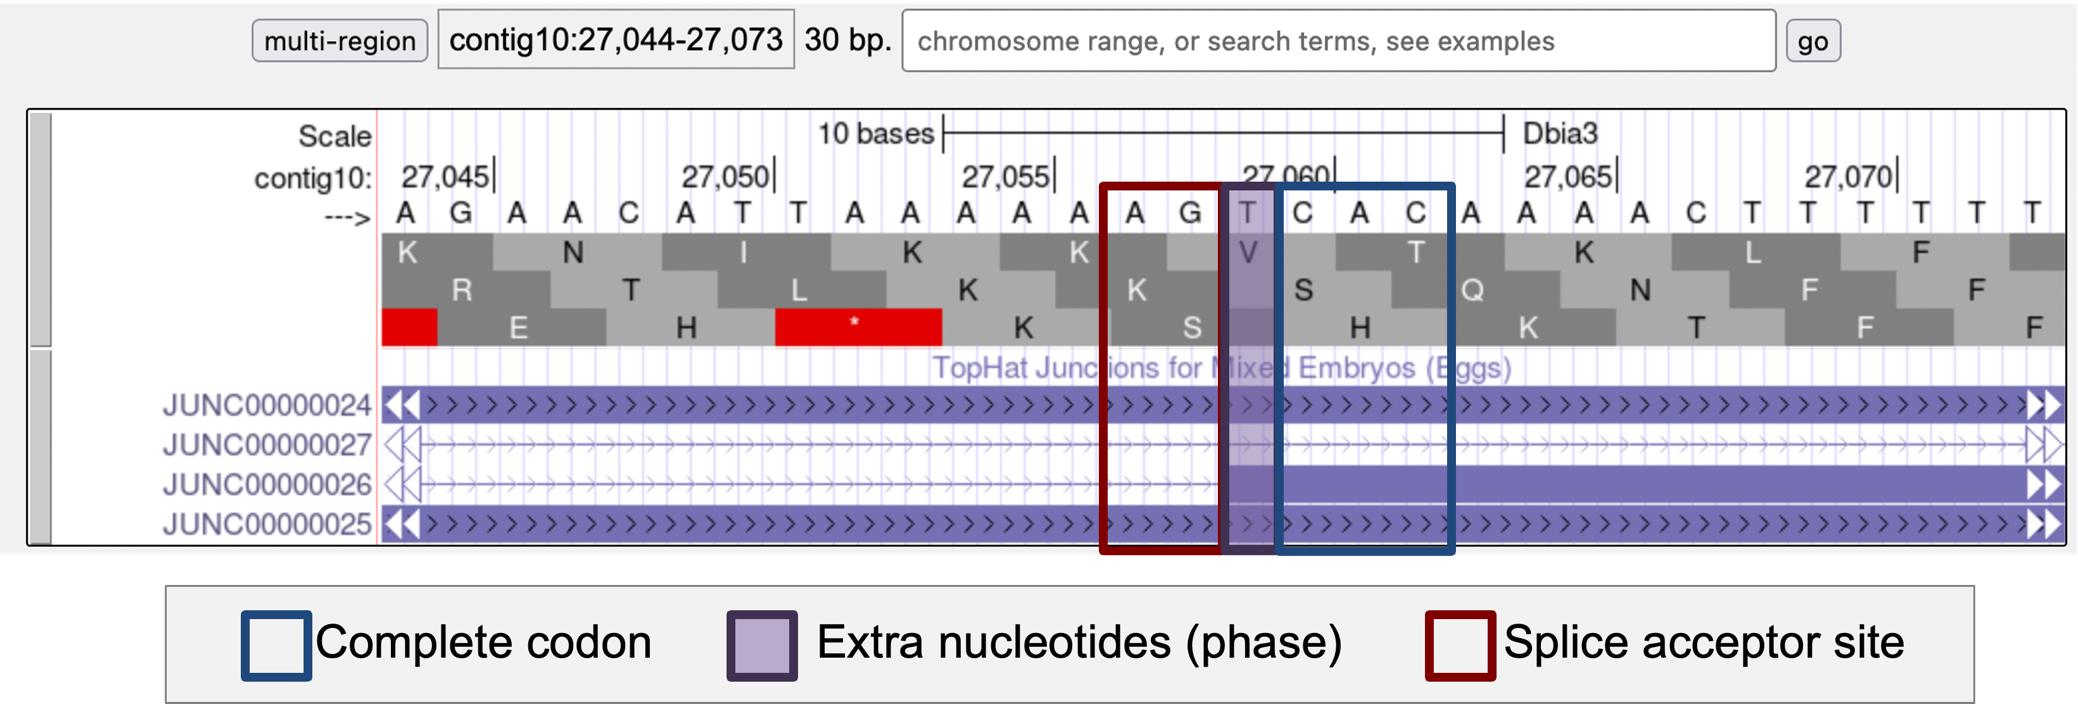
Enter “contig10:27,020-27,090” into the “chromosome range, or search terms” text box and then click on the “go” button. Because the blastx CDS alignment for CDS 2_10701_2 is in frame +3, we can reject the splice acceptor candidate suggested by JUNC00000025 at 27,029–27,030 because it is located upstream of two in-frame stop codons (at 27,042–27,044 and 27,051–27,053, respectively) in frame +3 (Figure 33). The splice junction JUNC00000024 has the same splice acceptor site as JUNC00000025 but it is connected to a splice donor site at 25,484–25,485 (upstream of CDS 1_10701_0). We can apply the same rationale (i.e., presence of in frame stop codons) to reject this candidate as a potential splice junction for CDS 1_10701_0.

While the splice acceptor site suggested by the TopHat junction JUNC00000026 at 27,057–27,058 is located before the two stop codons, this splice acceptor site is in phase 1 relative to frame +3, which means it is incompatible with the phase 1 donor site for the previous CDS 1_10701_0 (Figure 34).
Investigate the additional TopHat splice junction predictions
One possible explanation for these additional splice junctions predicted by TopHat is that there could be additional novel isoforms of CG31997 in D. biarmipes where the region upstream of CDS 2_10701_2 and the exons located further upstream are part of the 5' untranslated region (5' UTR). Specifically, CDS 2_10701_2 contains a methionine at 27,090–27,092 that could correspond to the start codon for these novel isoforms. The region between the splice acceptor sites predicted by TopHat and this start codon would be part of the 5' UTR. Similarly, CDS 1_10701_0 would be another part of the 5' UTR for these novel isoforms.
However, because these proposed isoforms do not exist in D. melanogaster, we need to have strong RNA-Seq evidence in D. biarmipes that supports the additional splice junctions. The score of each TopHat junction prediction corresponds to the number of spliced RNA-Seq reads that supports the prediction. Hence we can use this score to assess the level of confidence that are associated with each TopHat prediction.
Click on the TopHat junction “JUNC00000027” in the “TopHat Junctions for Mixed Embryos (Eggs)” track. We find that this junction has a score of 1187, indicating that this splice junction is supported by 1,187 spliced RNA-Seq reads (Figure 35, left). Go back to the previous page and then click on the TopHat junction “JUNC00000025”. We find that this junction only has a score of 2 (Figure 35, middle). Hence the junction JUNC00000025 is only supported by two spliced RNA-Seq reads. Similarly, we find that the splice junction JUNC00000026 has a score of 1 (Figure 35, right), which means that it is only supported by a single spliced RNA-Seq read. Consequently, we have high levels of confidence in the JUNC00000027 TopHat prediction and low confidence in the JUNC00000025 and JUNC00000026 splice junction predictions.

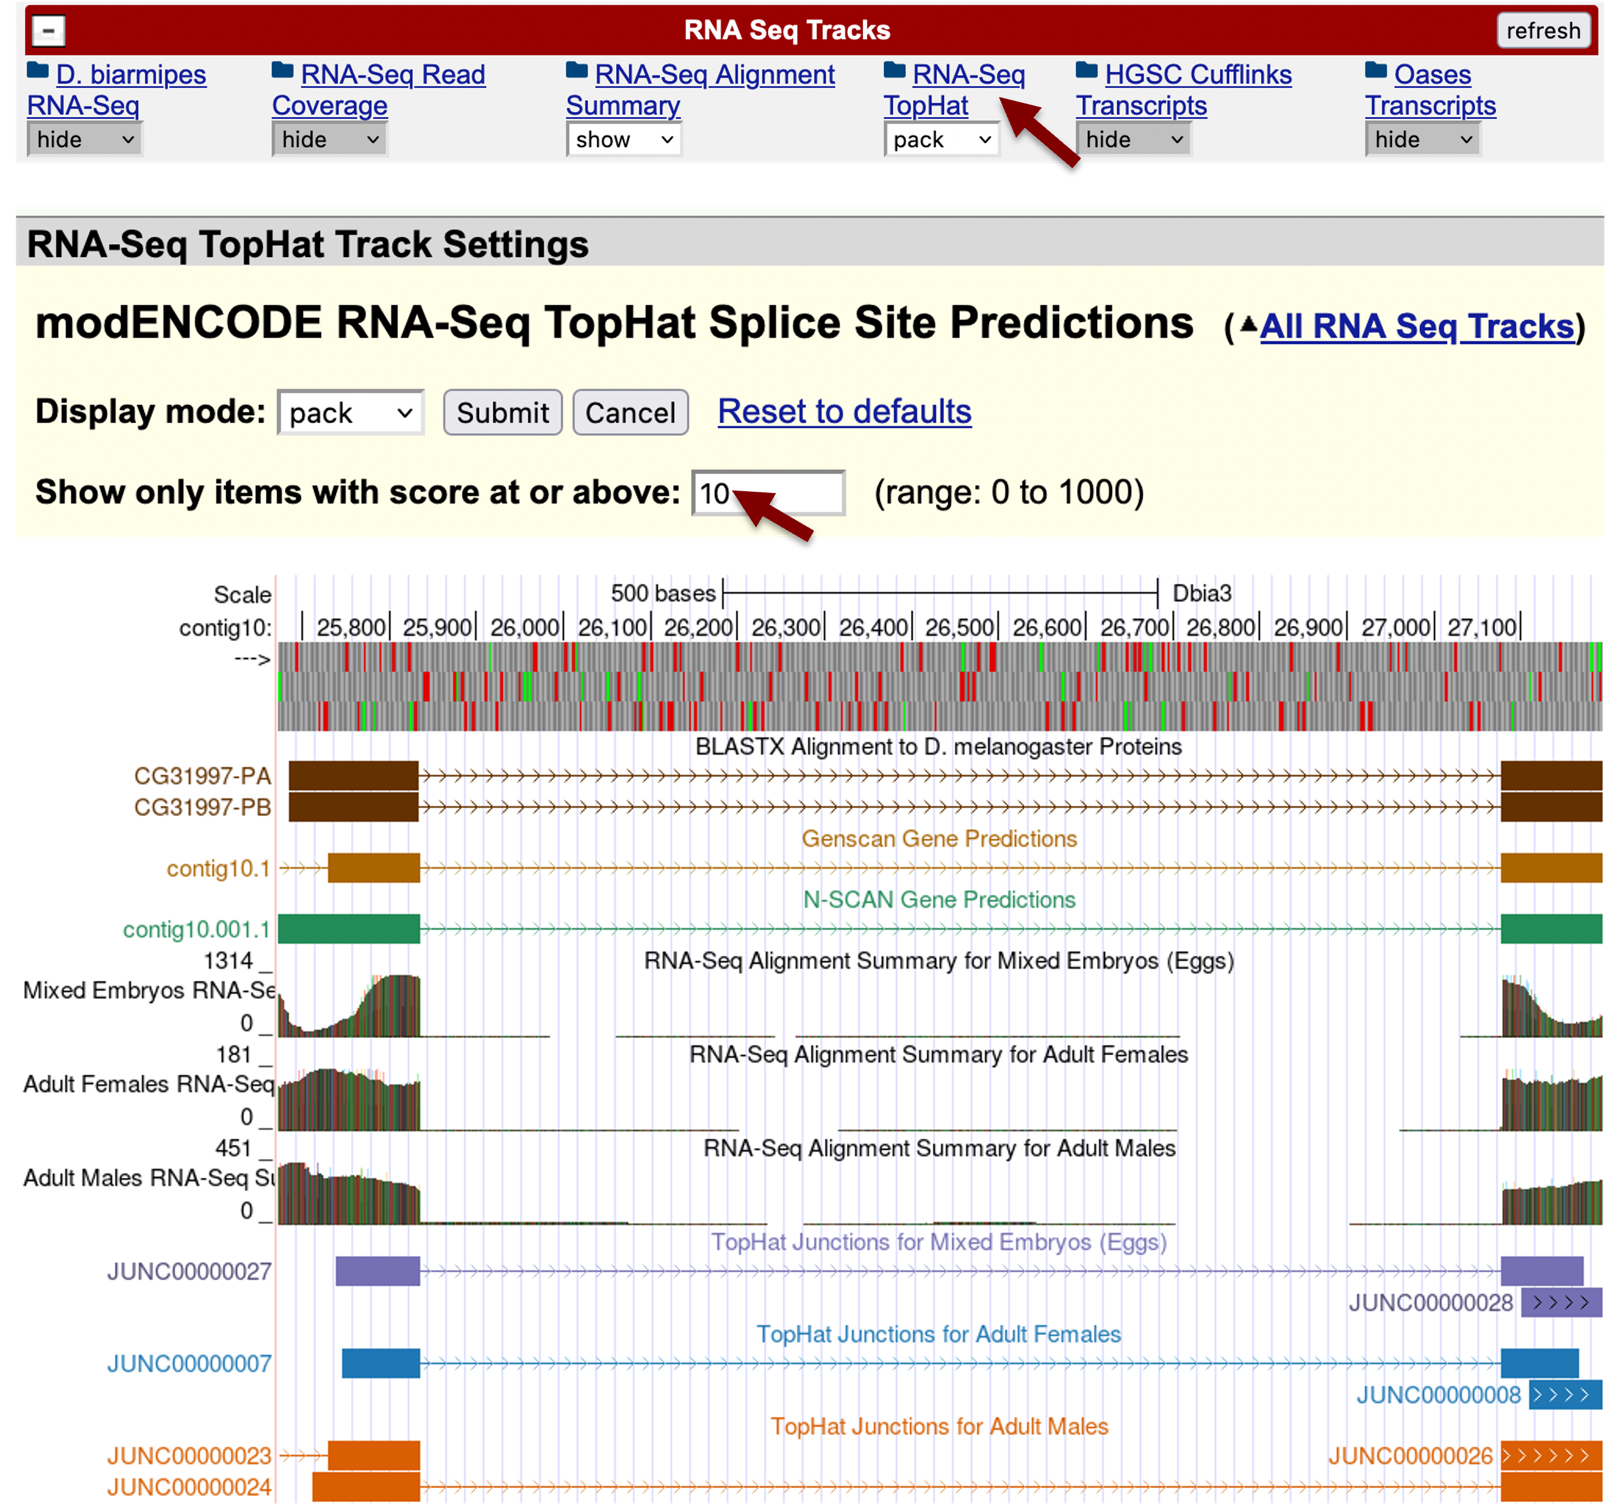
We can configure the settings for the “RNA-Seq TopHat” track to filter out TopHat splice junction predictions that are only supported by a small number of spliced RNA-Seq reads. Scroll down to the “RNA Seq Tracks” section and click on the “RNA-Seq TopHat” link. Change the “Show only items with score at or above” to “10” and then click on the “Submit” button. This will filter out all the TopHat junctions that are supported by nine or fewer RNA-Seq reads.
Enter “contig10:25,673-27,194” into the “chromosome range, or search terms” text box and then click on the “go” button so that we can examine the genomic region surrounding the splice junction between CDS 1_10701_0 and 2_10701_2. After applying the score filter, we find that there is only one splice junction prediction in each of the three samples (Figure 36).
Note that there is a trade-off between sensitivity and specificity when evaluating RNA-Seq data. RNA-Seq reads could be placed incorrectly in the assembly (e.g., because of base calling errors, repetitive sequences in the genome). Although rare, splicing errors also occur. Hence we are generally skeptical of splice junctions that are only supported by a small number of RNA-Seq reads. However, rare transcripts or genes expressed only at low levels would also show low RNA-Seq read coverage. Consequently, we cannot a priori determine the appropriate cutoff scores for the TopHat splice junction predictions.
The annotators at FlyBase also encounter the same trade-off with the RNA-Seq data when they create gene models in D. melanogaster. For example, the FlyBase gene report for CG31997 includes a note in the “Comments on Gene Model” section (under “Gene Model and Products”) indicating that the D. melanogaster gene models do not account for all of the RNA-Seq junctions that are only supported by a small number of spliced RNA-Seq reads (Figure 37).

|
|
The GEP annotation strategy is based on parsimony (i.e., minimizing the number of changes compared to D. melanogaster). Our initial hypothesis is that the same set of isoforms in D. melanogaster also exists in the D. biarmipes ortholog. We will only postulate novel isoforms based on multiple lines of evidence: high RNA-Seq coverage, strong TopHat predictions, sequence conservation with other closely related Drosophila species (e.g., D. takahashii), and computational gene predictions. |
Collectively, our analysis of the TopHat splice junctions support the placement of the splice donor site at 25,836–25,837 for CDS 1_10701_0 and the splice acceptor site at 27,077–27,078 for CDS 2_10701_2 contig10. The TopHat results indicate that there might be additional splice acceptor sites for CDS 2_10701_2. However, because these splice junctions are only supported by a small number of spliced RNA-Seq reads, there is insufficient evidence to propose novel isoforms of CG31997 in D. biarmipes.
Annotating the remaining splice sites
We can apply the strategy described above to annotate the splice donor site for CDS 2_10701_2 and the splice acceptor site for CDS 3_10701_1. The blastx alignment for CDS 2_10701_2 spans from 27081-27194 in frame +3 but the last amino acid of this CDS is missing from the alignment (Figure 22). Hence, we would expect to find the splice donor site at around 27,197 (i.e., 27194+3). Enter “contig10:27,197” into the “chromosome range, or search terms” text box and then click on the “go” button. Zoom out 10x and then zoom out another 3x.
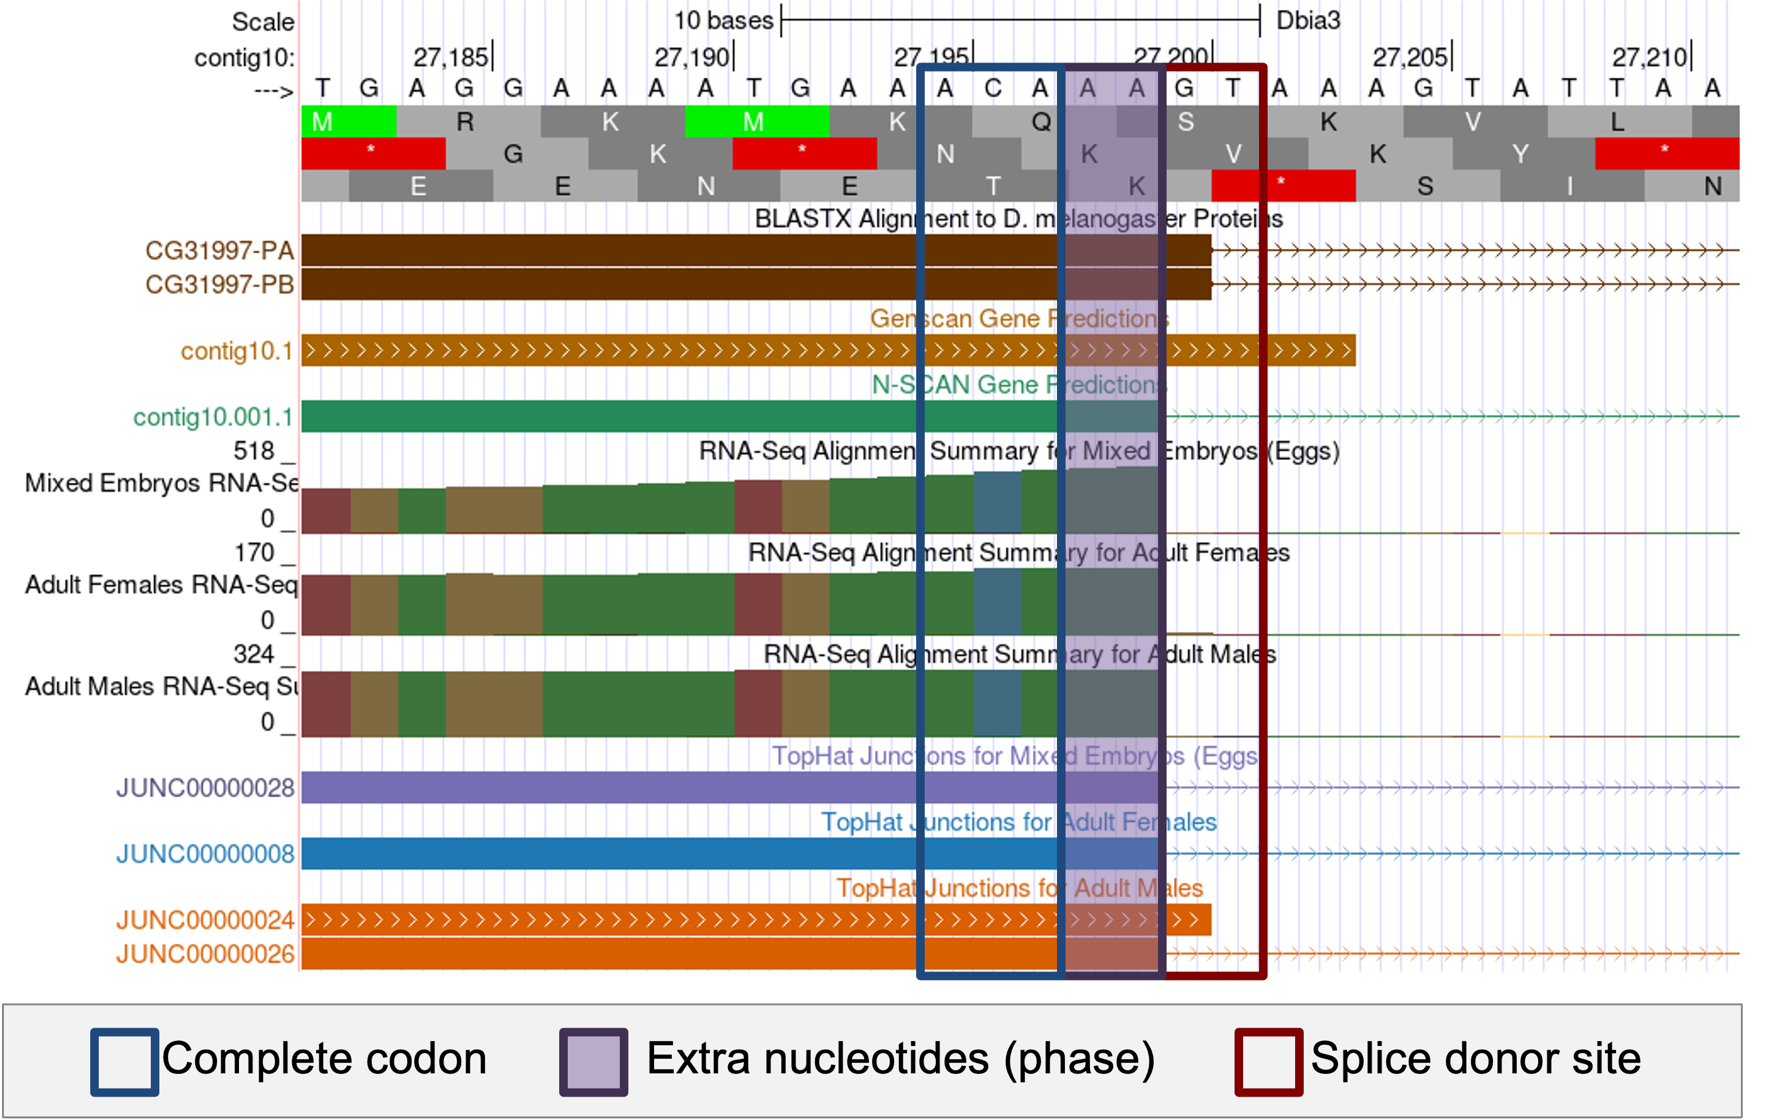
Examination of this region in the Genome Browser shows that there is only a single splice donor site (at 27,200–27,201) prior to the first in frame stop codon in frame +3. This phase 2 splice donor site is supported by the RNA-Seq Alignment Summary tracks, the RNA-Seq TopHat tracks as well as the N-SCAN gene prediction (Figure 38). This also means that the splice acceptor site for CDS 3_10701_1 must be in phase 1.
Because the blastx alignment for CDS 3_10701_1 begins at 27,286 in frame +1 (Figure 20), we will search for a phase 1 splice acceptor site near this position. Enter “contig10:27,286” into the “chromosome range, or search terms” text box and then click on the “go” button. Zoom out 10x and then zoom out another 3x. The acceptor site at 27,283–27,284 is in phase 1 relative to frame +1 and it is supported by the D. biarmipes RNA-Seq data and the N-SCAN gene prediction (Figure 39).
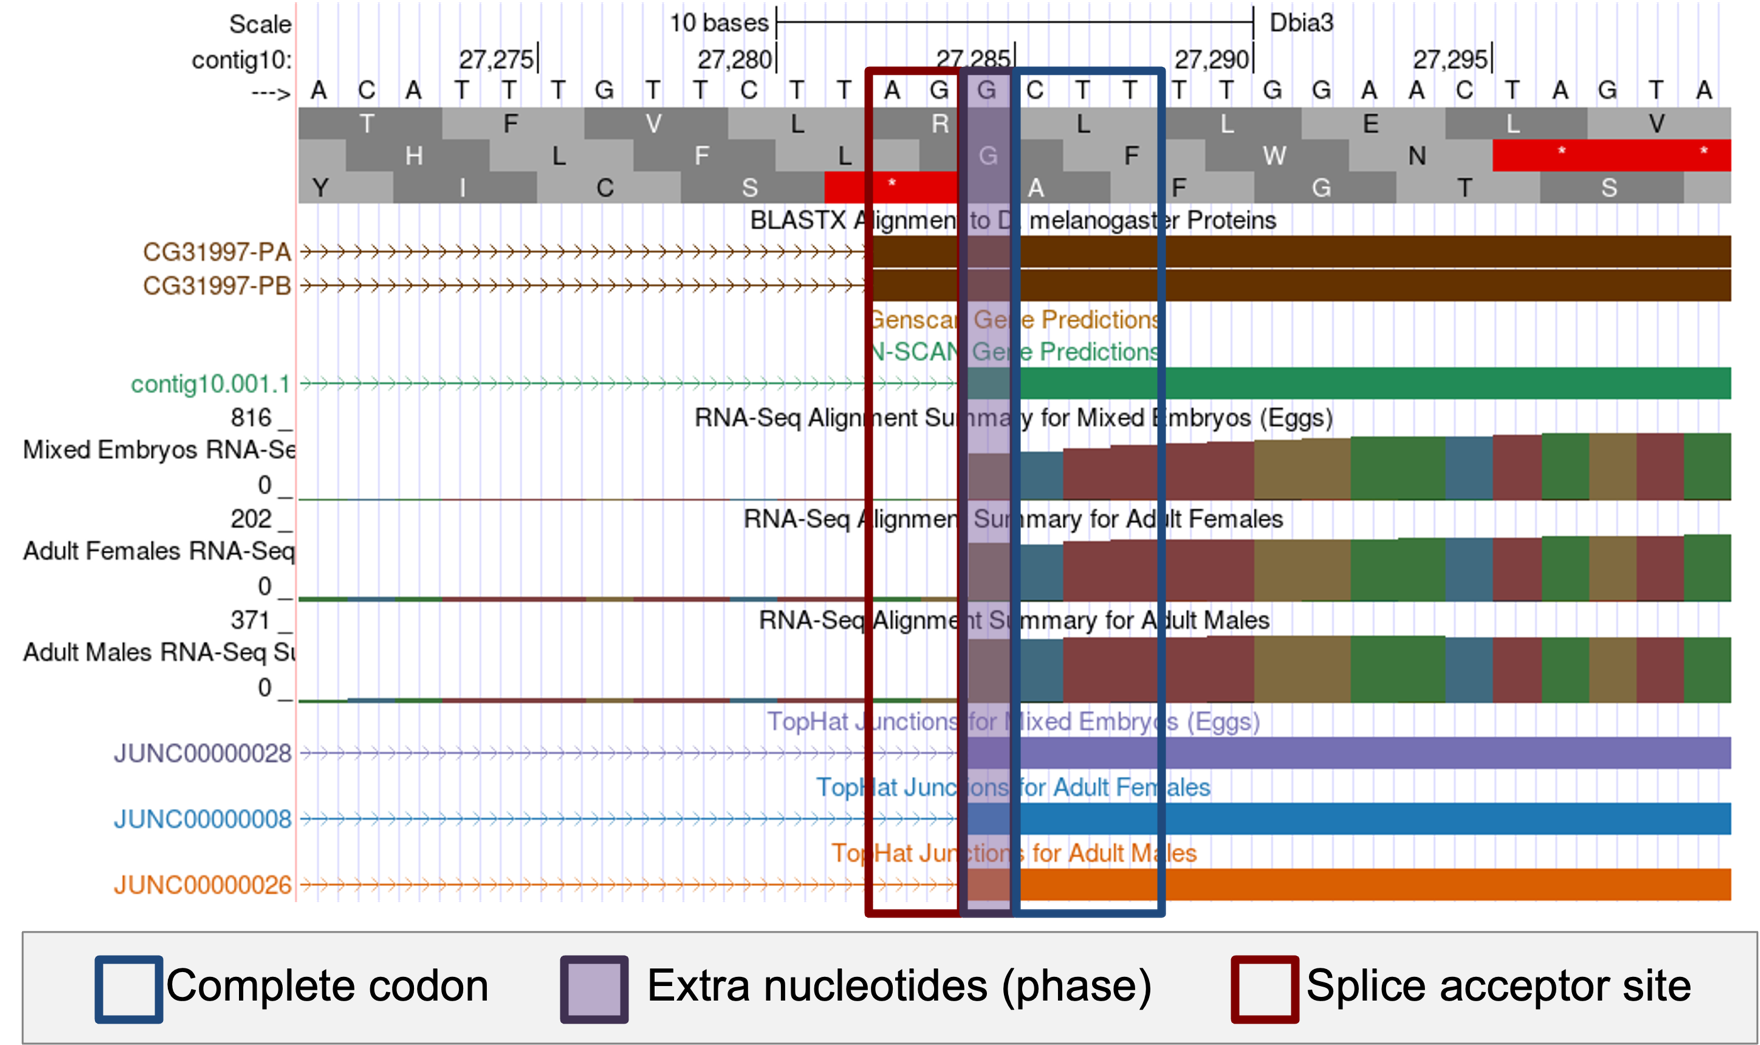
Based on the available evidence, we will annotate the end of the CDS 2_10701_2 at 27,199 and the start of the CDS 3_10701_1 at 27,285.
Verifying the gene model using the Gene Model Checker
Our analysis of the exon-by-exon blastx alignments and the evidence tracks on the GEP UCSC Genome Browser allow us to precisely define the start and end positions of each of the three coding exons of CG31997-PB. To verify that our proposed gene model satisfies the basic biological constraints (e.g., begins with a start codon, has compatible splice sites, ends with a stop codon), we will check our gene model coordinates using the Gene Model Checker.
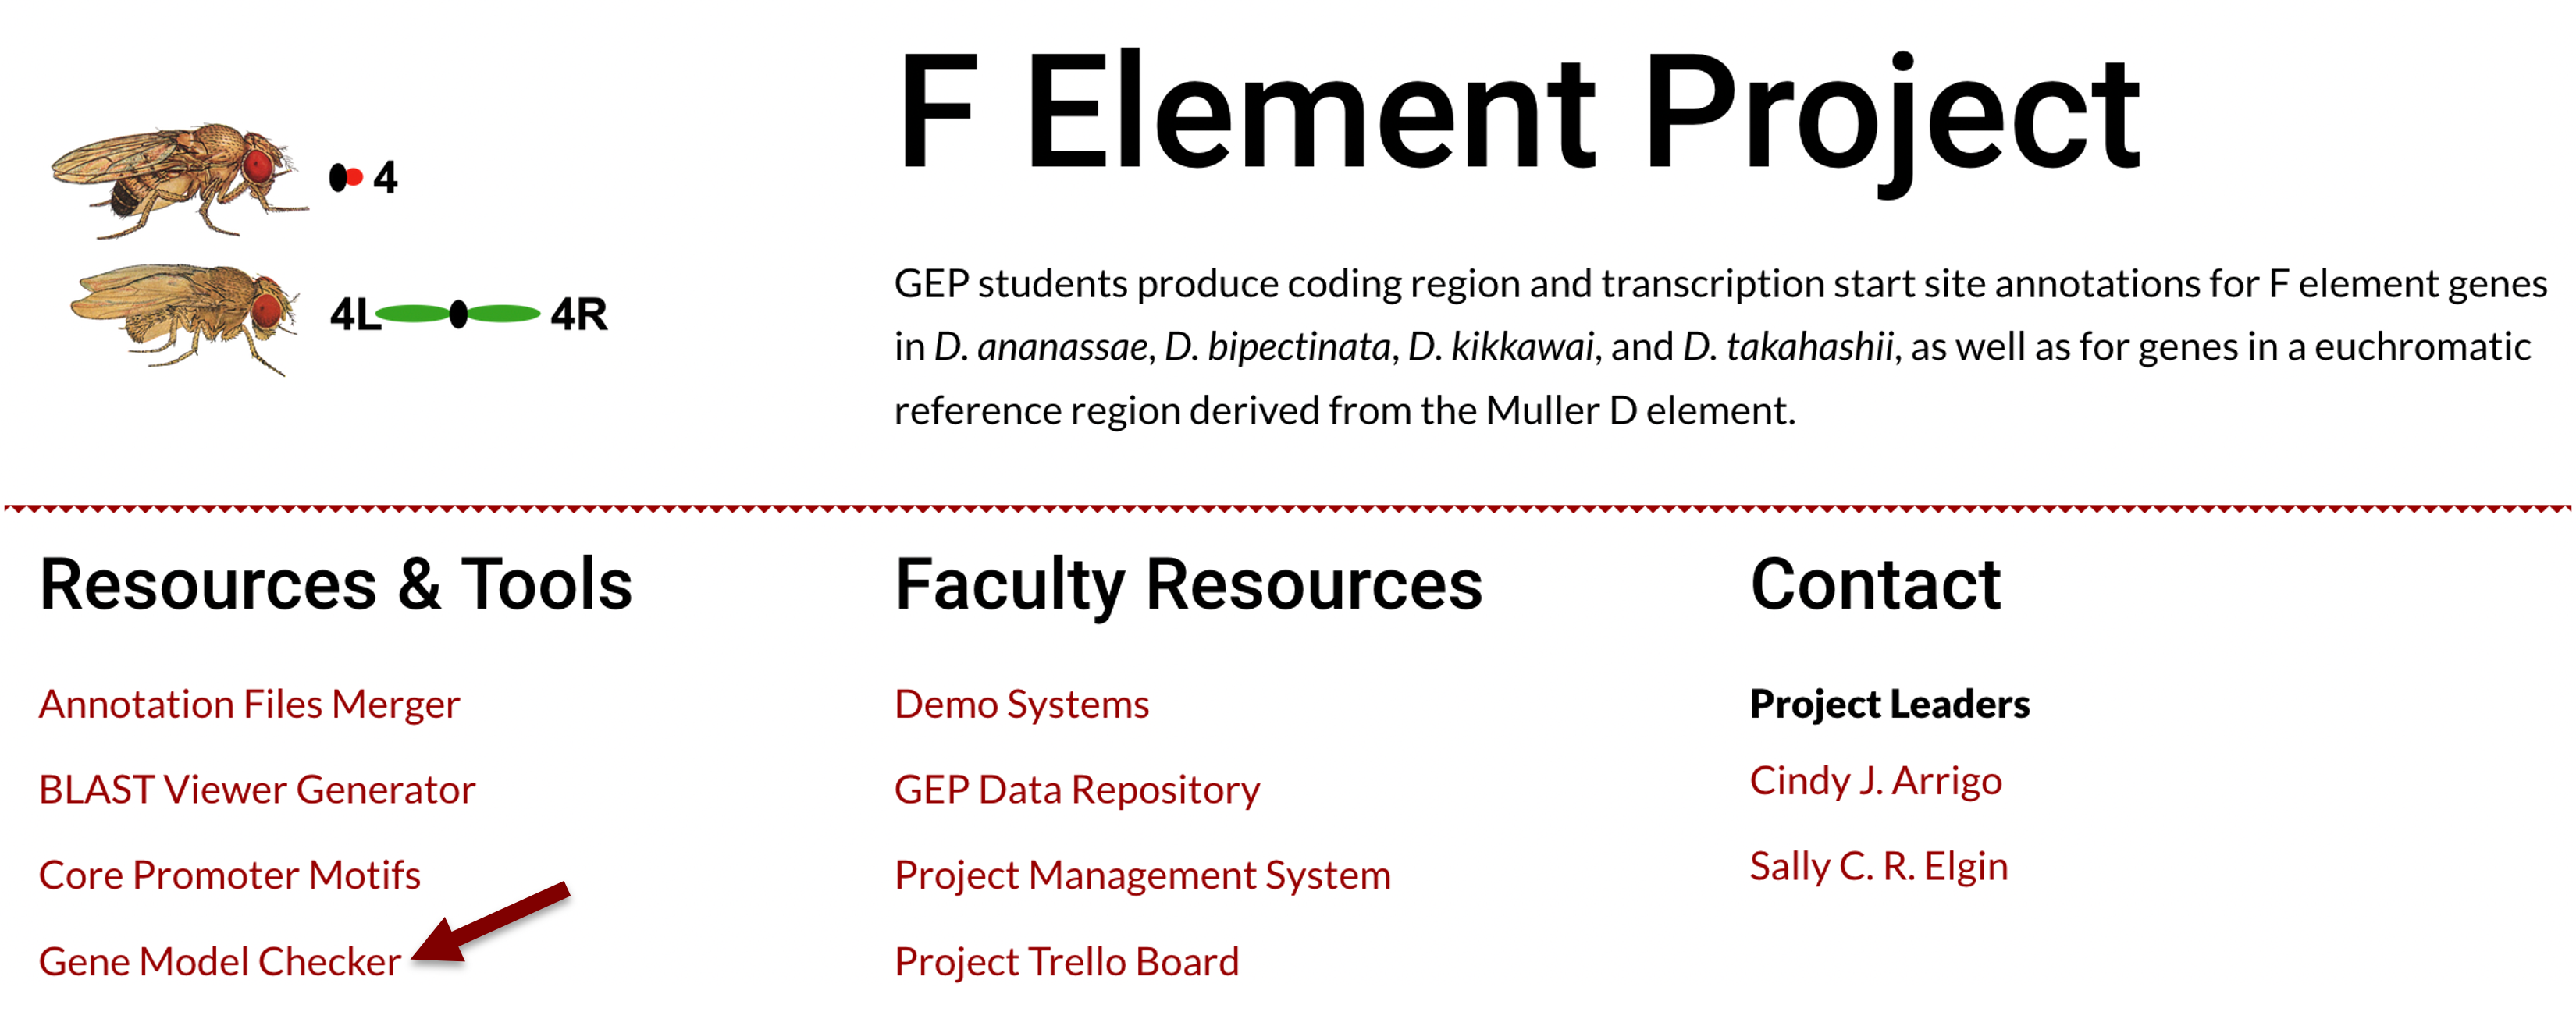
Open a new tab and navigate to the F Element project page on the GEP website. Click on the “Gene Model Checker” link under the “Resources & Tools” section (Figure 40).
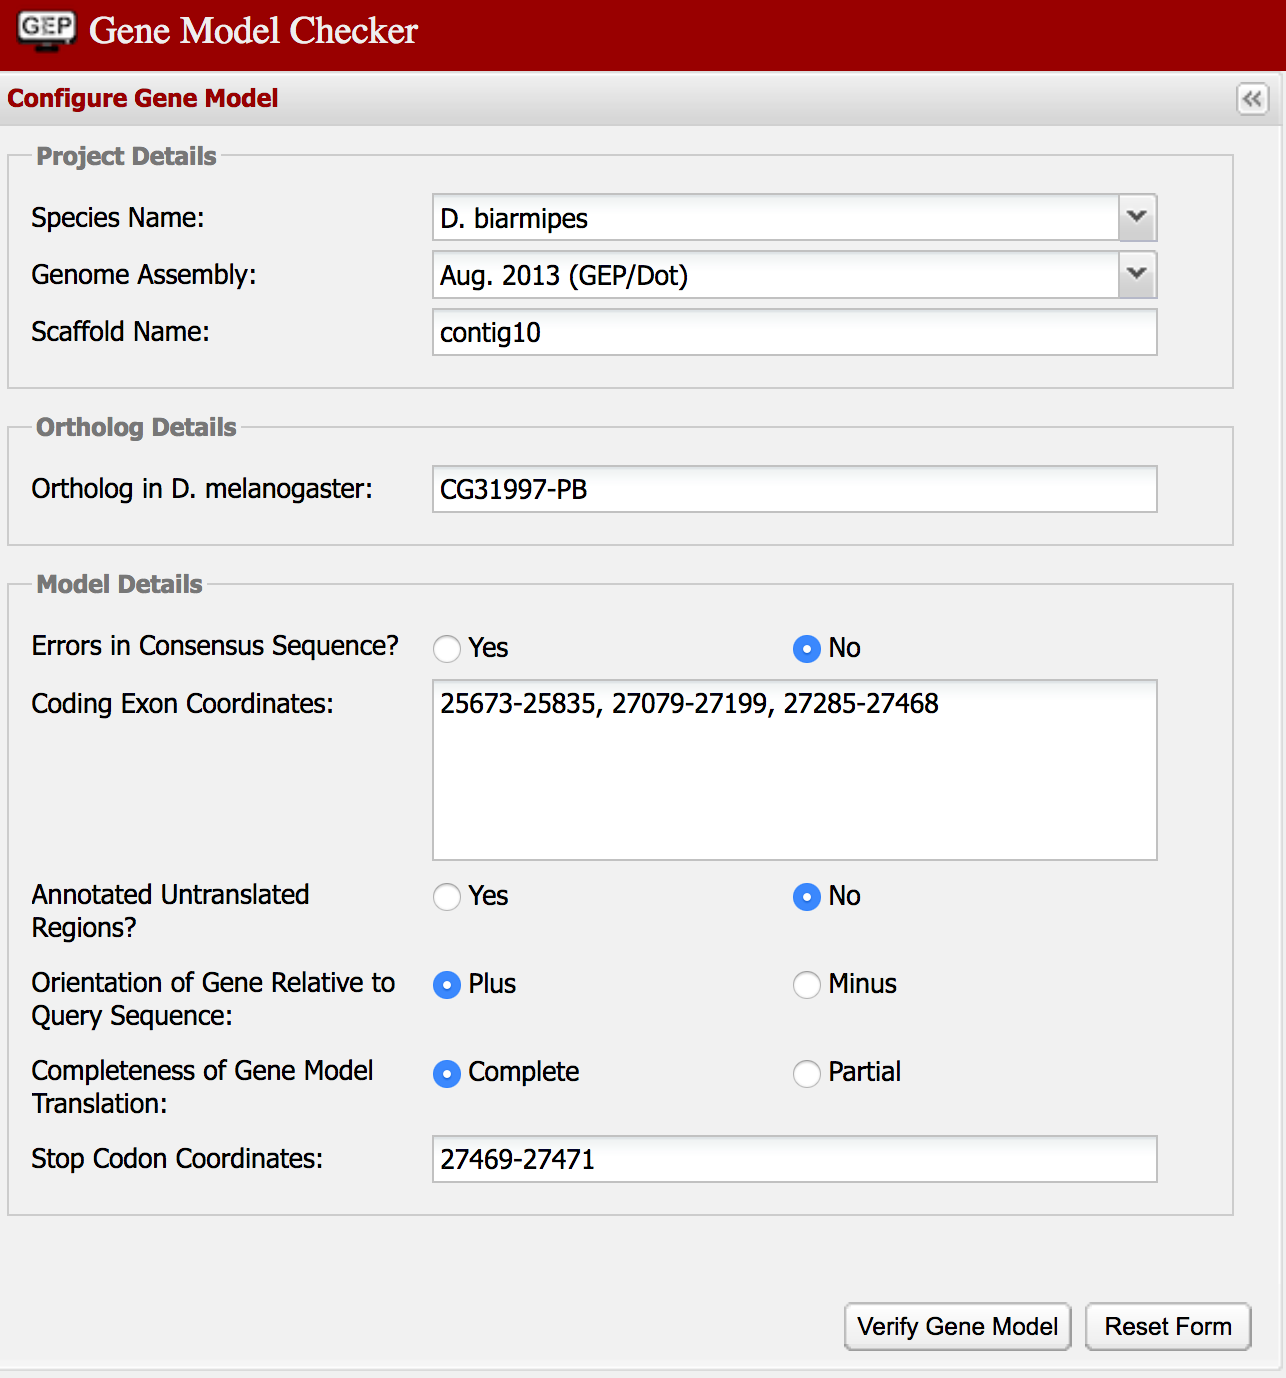
The first part of the configuration will define the analysis region. Select “D. biarmipes” under the “Species Name” field, then select “Aug. 2013 (GEP/Dot)” under the “Genome Assembly” field. Enter “contig10” into the “Scaffold Name” field.
Enter “CG31997-PB” under the “Ortholog in D. melanogaster” field. Under the “Coding Exon Coordinates” field, enter a comma-delimited list of coordinates for the three coding exons: “25673-25835, 27079-27199, 27285-27468”.
|
|
Note that the coordinates for the "Coding Exon Coordinates" field do not include the stop codon. We will enter the stop codon coordinates separately in the "Stop Codon Coordinates" field. |
Because CG31997-PB is on the positive strand relative to contig10, we should verify that “Plus” is selected under the “Orientation of Gene Relative to Query Sequence” field. The Gene Model Checker will automatically infer the stop codon coordinates (i.e., “27469-27471”) when you select the “Stop Codon Coordinates” field. (Figure 41). Click on the “Verify Gene Model” button to run the Gene Model Checker.
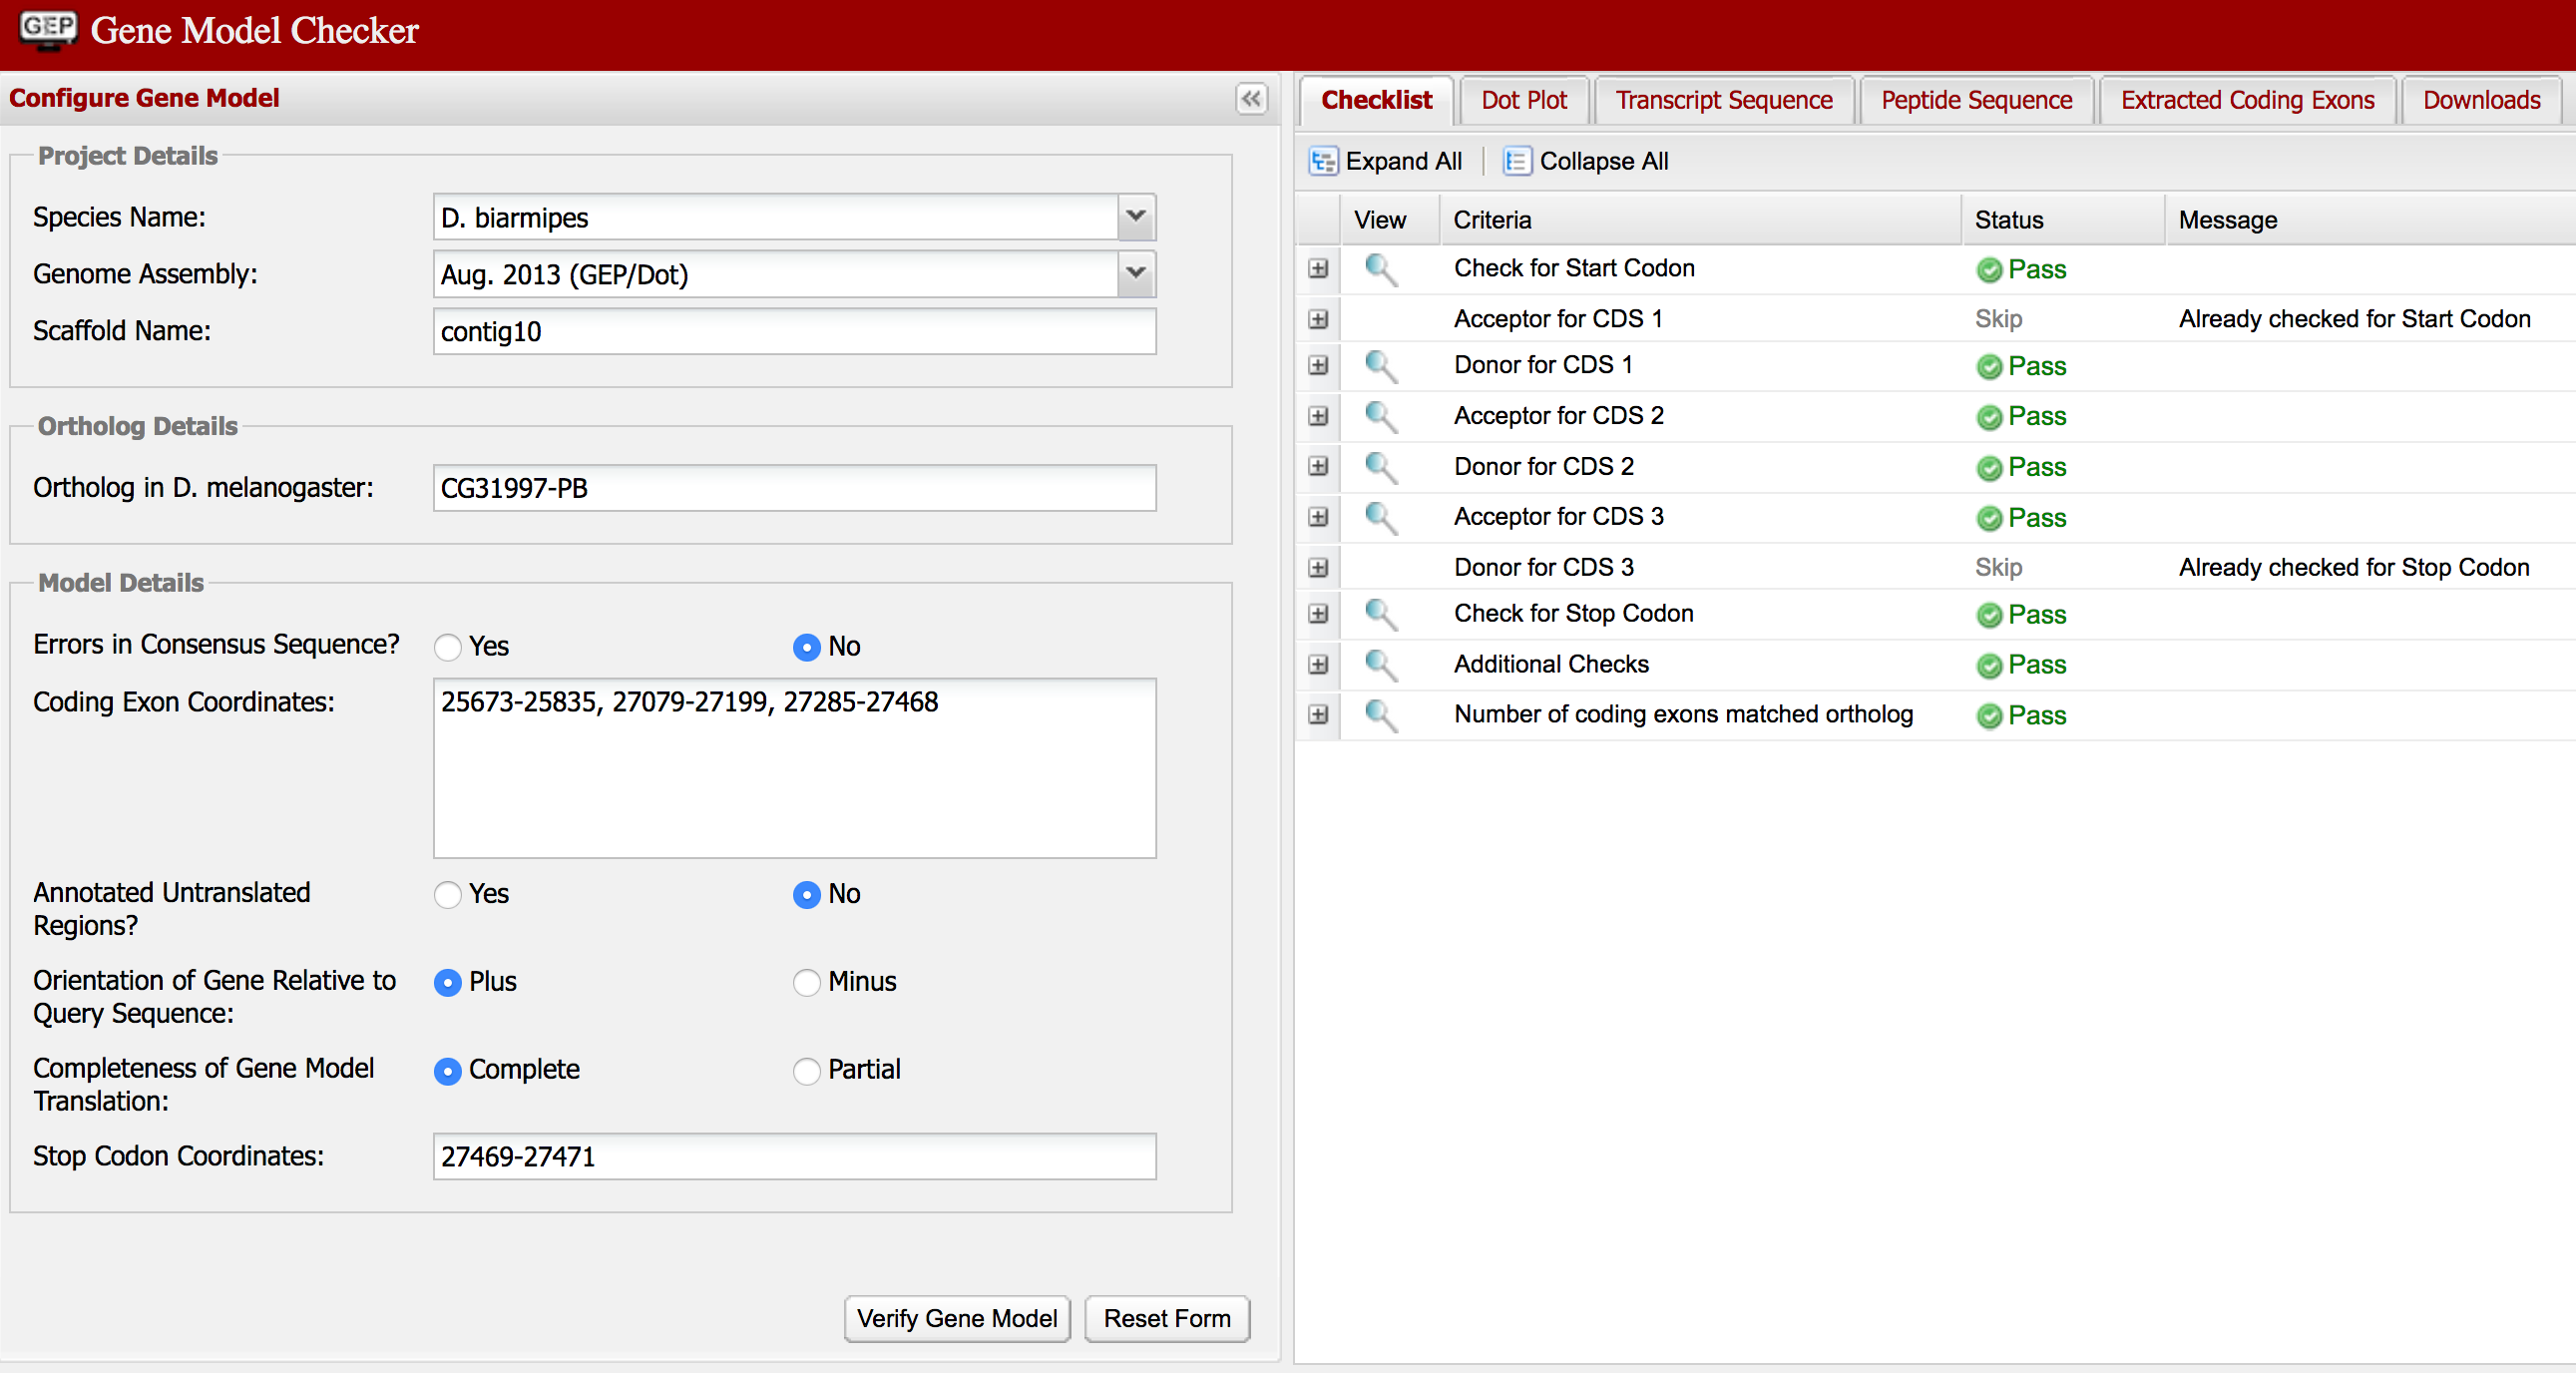
Once the analysis is complete, the right panel contains the results of the Gene Model Checker analysis. The “Checklist” tab enumerates the list of criteria that have been checked by Gene Model Checker (Figure 42). For example, the Gene Model Checker verifies that our proposed gene model begins with a start codon and ends with a stop codon. It also verifies that the splice junctions contain the canonical splice donor and acceptor sites. Some of the items on the checklist have been skipped because they do not apply to a complete gene (e.g., Acceptor for CDS 1).
|
|
The Gene Model Checker checklist is designed to highlight unusual features in the gene model. Warnings and failures reported by the Gene Model Checker do not necessarily mean that the proposed gene model is incorrect. However, the annotator should provide additional evidence that justifies the unusual annotation (e.g., non-canonical splice donor site, stop codon read through). |
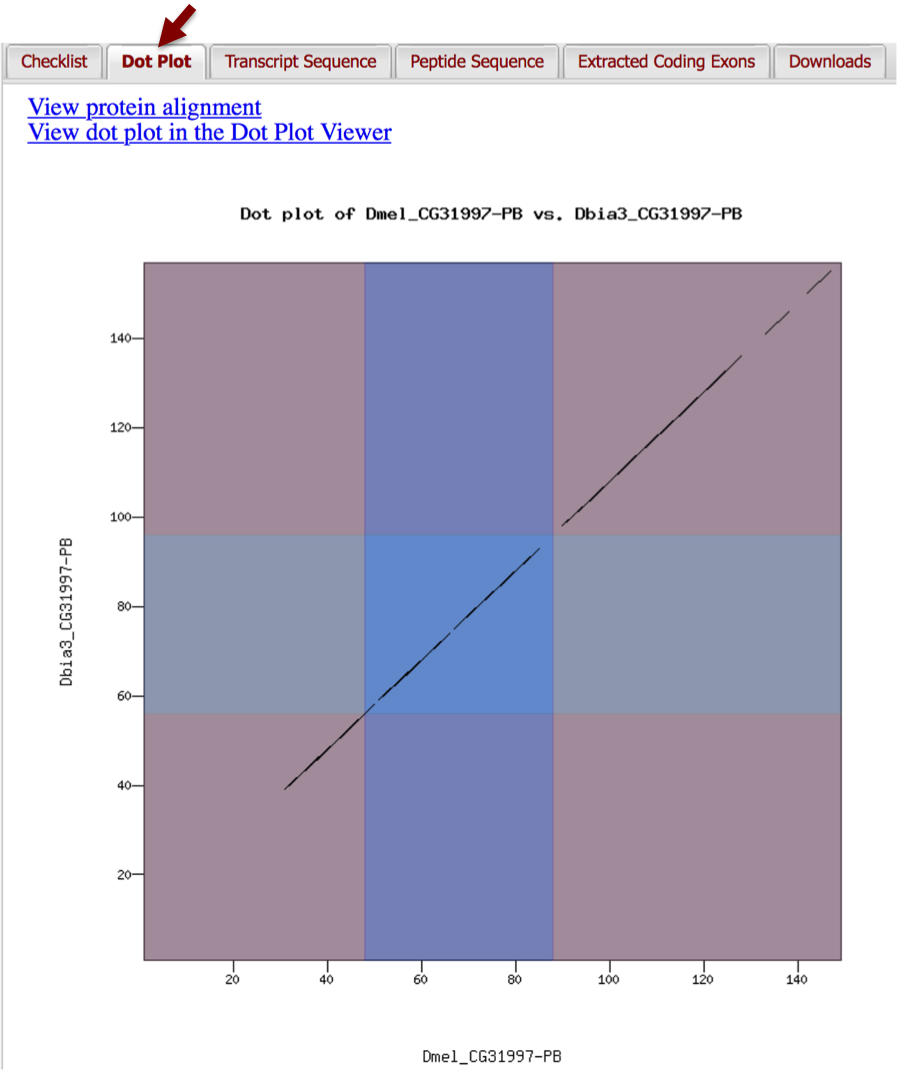
In addition to verifying the basic gene structure, the Gene Model Checker also compares the proposed gene model against the putative D. melanogaster ortholog using a protein alignment and a dot plot. Click on the “Dot Plot” tab to examine the dot plot between the D. melanogaster protein (x-axis) and the protein sequence for the submitted model in D. biarmipes (y-axis). The alternating color boxes correspond to the different coding exons in the two sequences. Dots in the dot plot correspond to regions of similarity between the D. melanogaster protein and the submitted D. biarmipes gene model.
If the submitted sequence is identical to the D. melanogaster ortholog, then the dot plot will show a straight diagonal line with a slope of 1. Changes in the size of the submitted model compared to the D. melanogaster ortholog will alter the slope of this line. In this case, the dot plot shows that the last two CDS’s of CG31997-PB in D. melanogaster and D. biarmipes have similar lengths but the initial CDS (1_10701_0) of CG31997-PB in D. biarmipes is substantially longer than the orthologous CDS in D. melanogaster. Furthermore, the dot plot also did not detect any sequence similarity between the beginning of the submitted model and the beginning of the D. melanogaster ortholog (Figure 43).
To further investigate the discrepancies in the dot plot, we will examine the protein alignment between the two sequences (Figure 44). Click on the “View protein alignment” link above the dot plot. The alignment shows the comparison of the D. melanogaster protein (top) against the conceptual translation for the submitted D. biarmipes gene model (bottom). Similar to the dot plot, the alternating colors correspond to the different coding exons.
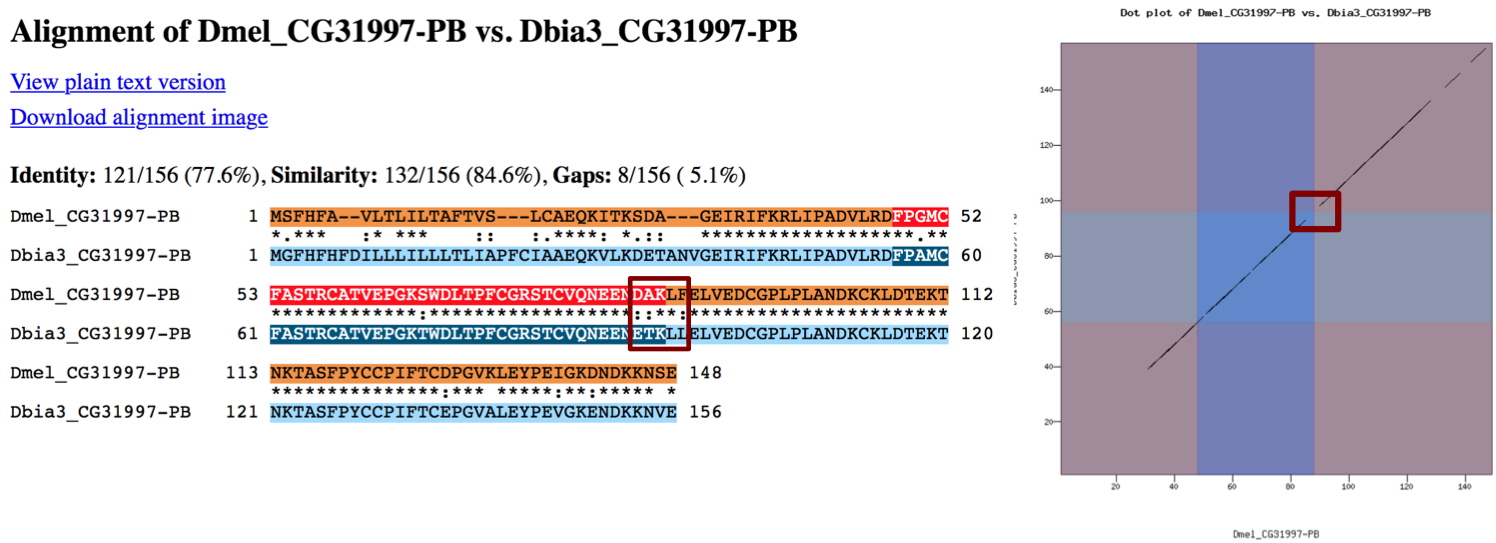
The protein alignment shows that the last two CDS’s have high levels of sequence similarity between the D. melanogaster ortholog and the D. biarmipes gene model. The symbols in the match line denote the level of similarity (* indicates conserved, identical amino acids, : denotes amino acids with highly similar chemical properties). Hence the gap in the dot plot between the second and third CDS can be attributed to similar but not identical amino acids near the splice site boundary.
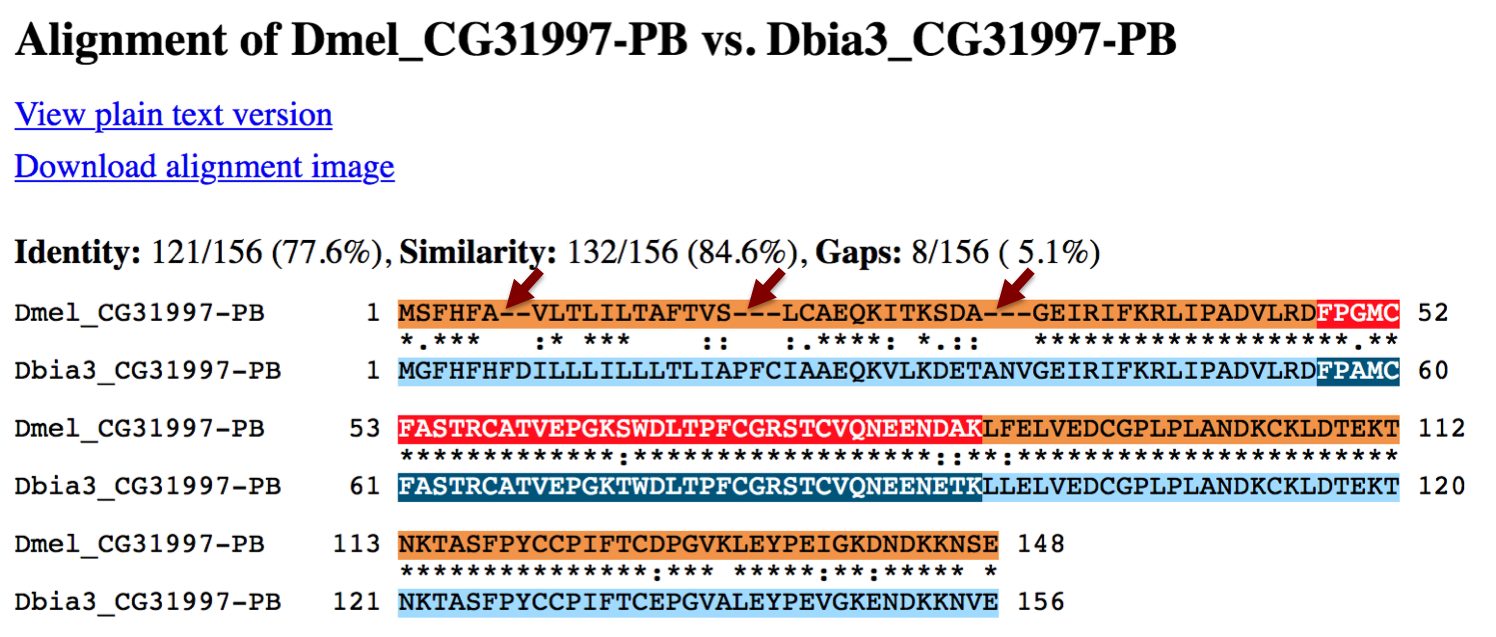
Consistent with the results of our exon-by-exon blastx analysis, the protein alignment shows that the end of the first CDS is very highly conserved while the beginning of the CDS alignment shows multiple gaps (-) in the D. melanogaster protein sequence compared to the submitted D. biarmipes model (Figure 45).
These gaps in the first CDS explain why the D. biarmipes gene model is 8 amino acids longer than the D. melanogaster ortholog.
|
|
You should provide an explanation for any large gaps or changes in slope in the dot plot in the F Element Project Annotation Report Form. In particular, a large vertical or horizontal gap at the beginning or the end of an exon in the dot plot often indicates the presence of alternate splice sites that would minimize the change in the size of the CDS compared to D. melanogaster. You should include a detailed explanation in the F Element Project Annotation Report in order to support the truncation or expansion of the CDS compared to the D. melanogaster model (e.g., location of the compatible splice donor or acceptor sites, RNA-Seq TopHat splice junctions). |
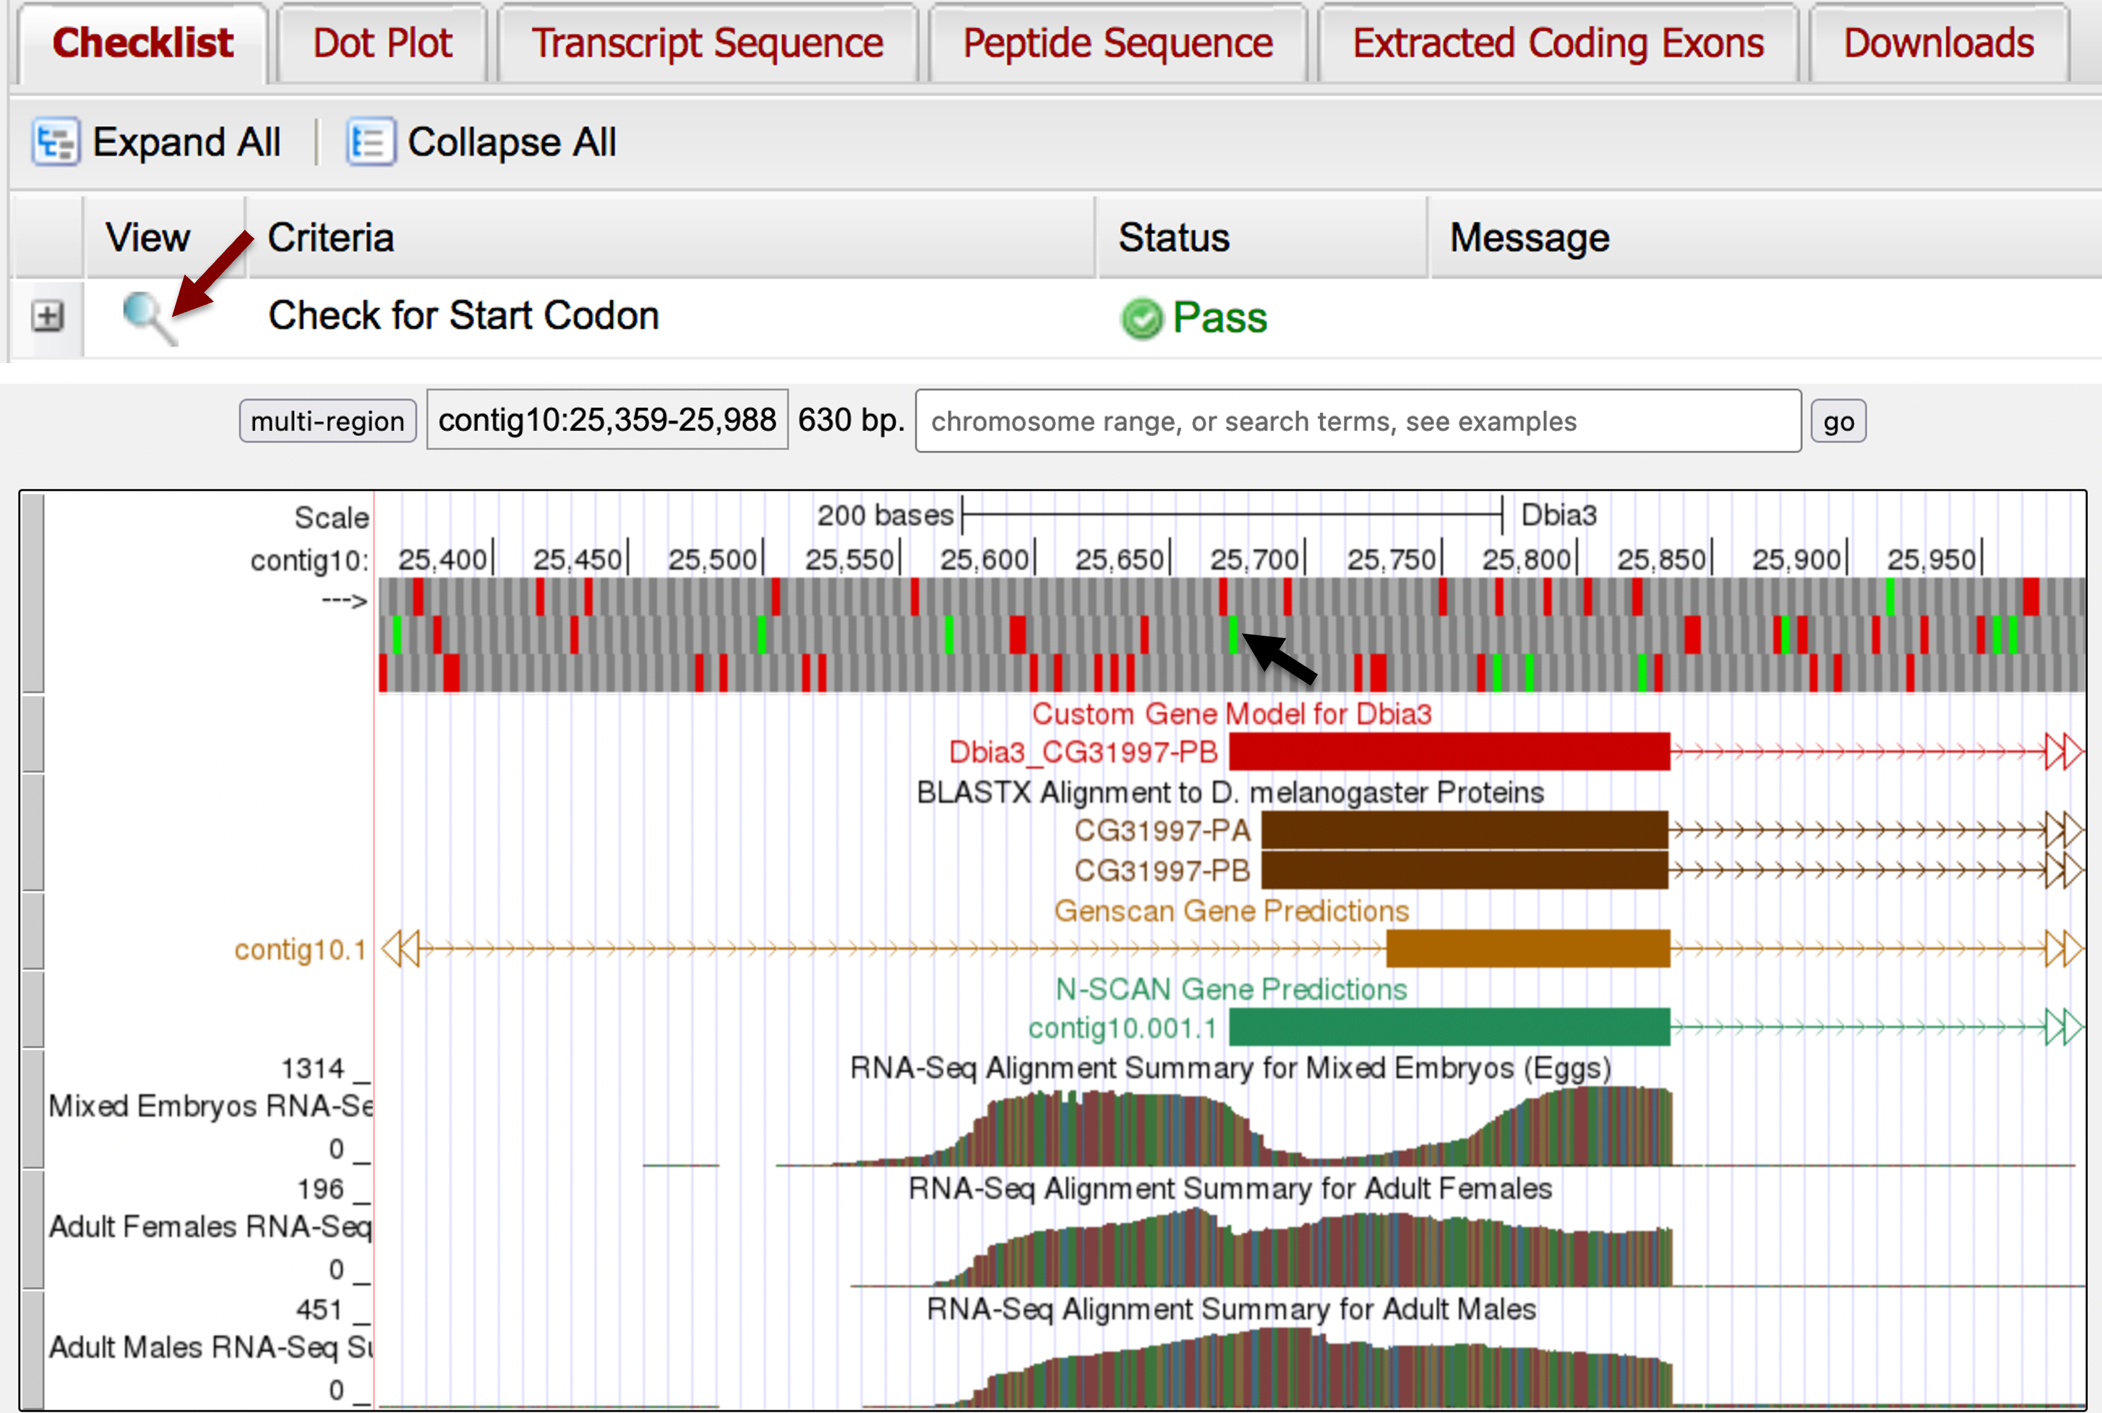
Our previous analysis has shown that there are no alternate start codons available for CDS 1_10701_0 and that the expansion of this CDS compared to the D. melanogaster ortholog is strongly supported by the D. biarmipes RNA-Seq data (Figure 25). To verify our previous observations, we can view the submitted gene model within the context of the other evidence tracks in the GEP UCSC Genome Browser.
Select the “Checklist” tab and then click on the magnifying glass icon next to the “Check for Start Codon” criteria. A new window will appear with our submitted gene model shown in the red “Custom Gene Model” track. Zoom out 10x so that we can examine the entire reading frame for CDS 1_10701_0 in frame +2 (Figure 46). The Genome Browser view shows that our gene model begins at the only available start codon in frame +2 before the first in-frame stop codon. This proposed start codon location is consistent with the N-SCAN gene prediction and it is also supported by the RNA-Seq data.
|
|
The "Gene Model Checker User Guide" contains a more comprehensive overview of the Gene Model Checker. The user guide also includes a walkthrough on how to the use the Gene Model Checker to identify and diagnose problems in the proposed gene model. |
Download the files required for project submission
In addition to the F Element Project Annotation Report Form, you must prepare three additional data files in order to submitting a project to the GEP: a General Feature Format (GFF) file, a transcript sequence (fasta) file, and a peptide sequence (pep) file. The Gene Model Checker automatically creates these three files when you verify a gene model. We can download these files by selecting the “Downloads” tab (Figure 47) and then right-click (control click on macOS) on each of the links and select “Save Links As…” or “Download Linked File As …” to save each file onto your computer.

The GFF, transcript, peptide sequence files for all the genes and isoforms in your project should be combined into a single file prior to project submission. You can use the “Annotation Files Merger” (available through the F Element project page on the GEP website) to create the combined GFF, peptide, and transcript sequence files for your entire project. See the Annotation Files Merger User Guide for additional details.
Conclusion
This walkthrough illustrates many of the key steps of the GEP annotation strategy. Using the “D. mel Proteins” and the gene predictions tracks on the GEP UCSC Genome Browser, we identified three features of interest within the contig10 project from the D. biarmipes Muller F element. To further investigate one of these features within contig10, we performed a blastp search to compare the N-SCAN prediction contig10.001.1 against a database of D. melanogaster annotated proteins at FlyBase. This blastp search indicates that the D. biarmipes genomic region surrounding this N-SCAN prediction likely contains an ortholog of the D. melanogaster gene CG31997. Using the Gene Record Finder, we determined the overall gene structure (e.g., number of isoforms and unique CDS’s) of CG31997 in D. melanogaster.
We then compared each of the unique CDS’s of CG31997 against the contig10 sequence using NCBI blastx to determine the approximate placement of each CDS. We further refined the placement of the CDS’s using the RNA-Seq evidence tracks on the GEP UCSC Genome Browser. We used the “RNA-Seq Alignment Summary” track to verify the placement of the start codon and the “RNA-Seq TopHat” tracks to identify the splice donor and acceptor sites.
Once we have determined the coordinates of all the CDS’s, we verified our proposed gene model using the Gene Model Checker. The Gene Model Checker checklist confirms that our proposed gene model satisfies the basic biological constraints of a eukaryotic gene. We also examined the dot plot and the protein alignment between our proposed gene model and the D. melanogaster ortholog to verify that the differences between the two sequences are genuine.
The final step is to document the results of our analysis in the F Element Project Annotation Report Form. We have included a sample F Element Project Annotation Report for CG31997 in the package for this walkthrough (Sample_GEP_Annotation_Report.docx).
|
|
Some of the genes in D. biarmipes are more challenging to annotate than the example described in this walkthrough. The "Annotation Instruction Sheet" contains additional strategies on how to identify small or weakly conserved coding exons. The "Annotation Strategy Guide" illustrates how the concepts described in the "Annotation Instruction Sheet" can be applied to more challenging annotation cases. |