Introduction
After lots of time spent on improving the quality of the genomic sequence, you have a large piece of DNA. How are you going to make sense of it?
1. Annotation
Defn: genome annotation is the process of determining the biological structure and function of genomic sequence.
-
Where are the genes?
-
What do they do?
-
Are there regions of functional non-coding DNA?
-
What is the evolutionary history of the sequence?
We’ll introduce one method of identifying features in the genome: comparative annotation.
2. Rationale of Comparative Annotation
How can we assign meaning to parts of a DNA sequence? In particular, how do we discover regions of potential function?
-
How can we exploit our ability to quickly generate lots of DNA sequence data?
-
Fact 1: all DNA is subject to mutations.
-
Fact 2: most functional regions are under negative selection (i.e., mutations are often deleterious).
-
Conclude that pieces of DNA with a specific function (especially genes!) tend to be conserved against mutation more strongly than pieces with no specific function.
-
Conservation implies that, if you compare two homologous functional regions, you will see extensional similarity. That is, the DNA sequences, considered as raw character strings, look similar to each other.
This makes sense so far, but what is the implication for annotation?
-
Computer scientists are good at detecting extensional similarity between sequences.
-
We’d like to reason: if two sequences are unusually similar, they exhibit evidence of conservation (derivation from common ancestor) …
-
… hence exhibit evidence of negative selection …
-
… hence exhibit evidence of conserved function!
-
This chain of inference provides evidence that two sequences are functionally homologous based on fact that they’re similar.
-
Comparative annotation is the process of discovering similarity, and then following the above chain of inference to assign sequences a putative function.
Unfortunately, evidence is not proof. What are some caveats?
-
Extensional similarity can arise purely by chance. If I flip a fair coin 10 times, then 10 more times, the chance that the first and second sequences of 10 flips are identical is about 1 in 1000. Two unrelated DNA bases have at least a one in four chance of being the same.
-
Conservation (derivation from a common ancestor) need not imply strong negative selection. Other possibilities include:
-
recent genomic duplications
-
pseudogenes
-
intergenic DNA of closely related organisms (e.g., human/chimp)
-
-
Negative selection may indicate that compared sequences and/or their structures are functionally important, but may not indicate that the compared sequences and/or structures have a common function. For instance:
-
The adh1 and adh2 genes in yeast are close paralogs (alcohol dehydrogenase), but catalyze opposite metabolic reactions.
-
Structural crystallins in the vertebrate eye lens function as enzymes (with minor variation) in other tissues.
-
3. What Does Similarity Mean?
What is a biologically sensible notion of “extensional similarity?”
-
Exact match? That’s just a crude approximation: biosequences mutate.
-
Inexact match? But there are many ways to define what an “inexact match” means.
The following is an intuitive description of and justification for a particular definition of similarity.
-
Our notion of similarity should be rooted in an underlying process of evolution.
-
Define a set of permissible mutation events.
-
Substitution: replace one character by another
-
Insertion: add one character somewhere in a sequence
-
Deletion: remove one character somewhere from a sequence
-
-
(Note: an insertion or deletion is sometimes called an indel)
-
Assumption: biosequences change over time only by a series of permissible mutation events.
How does a set of mutation events lead to a measure of similarity?
-
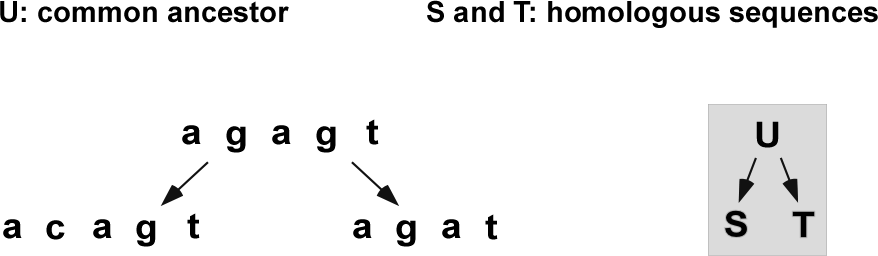
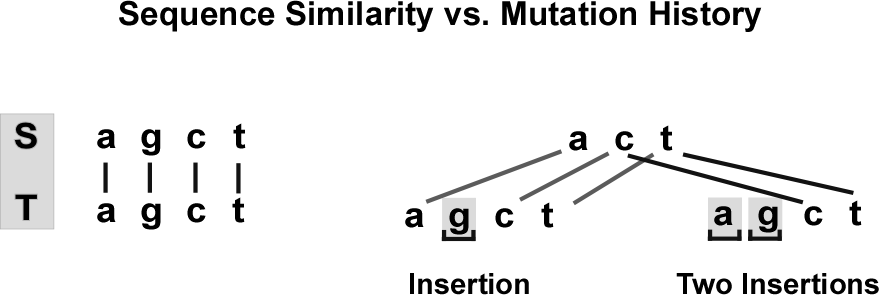
Let \(S\), \(T\) be two homologous sequences (Figure 1).
-
At some time in the past, \(S\) and \(T\) had a common ancestor \(U\).
-
Each base of \(S\) or \(T\) represents one of
-
a conserved base from \(U\),
-
a base from \(U\) that underwent substitution(s),
-
or a base inserted (maybe changed) after the split from \(U\).
-
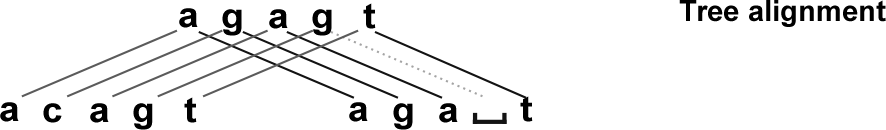
If we could draw the correspondence between the bases of \(S\), \(T\), and \(U\), we’d have a tree alignment (Figure 2).
-
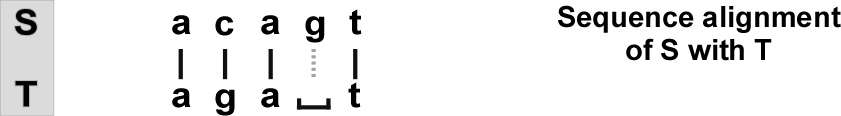
If we omit the ancestral sequence \(U\), we get a sequence alignment of \(S\) with \(T\) (Figure 3).
-
An alignment shows which bases of \(S\) and \(T\) came from the same base in the (unspecified) ancestor \(U\).
-
To measure similarity of \(S\) and \(T\), measure the fraction of positions (aka columns) in the alignment that remain identical.
-
This measure is fractional identity, a.k.a. percent identity
The above is a rational basis for measuring similarity, but we have a problem …
-
The ancestor \(U\) and the mutation history are unknown!
-
All we have are the modern sequences \(S\), \(T\).
-
Idea: guess a “plausible” alignment and measure its identity.
-
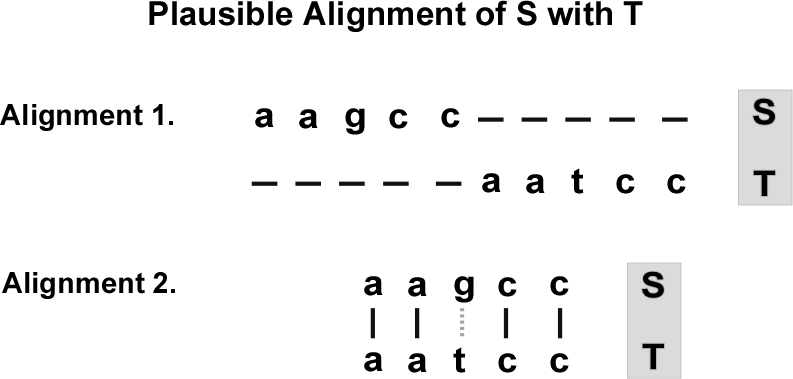
Below are two possible alignments of “aagcc” with “aatcc” (Figure 4):
-
Alignment 1 is intuitively silly. Why?
-
Pluralitas non est ponenda sine neccesitate. (Ockham)
-
This is also known as the “principle of parsimony.”
-
Don’t postulate more mutations than necessary to align \(S\) with \(T\).
-
Defn: an optimal (global) alignment of S with \(T\) is one that requires the minimum number of mutations.
-
Note that the optimal alignment may not be historically true.
-
Consider two identical sequences of “agct”. It is possible that one or more mutations did occur historically that do not correspond to the optimal alignment (Figure 5).
-
In the absence of historical truth, similarity of two sequences is defined as similarity of an optimal alignment between them.
Real measures of similarity are a bit more sophisticated than just counting mutations.
-
Some substitutions are more likely than others (e.g., transitions vs transversions).
-
Substitutions and indels are not equally common.
-
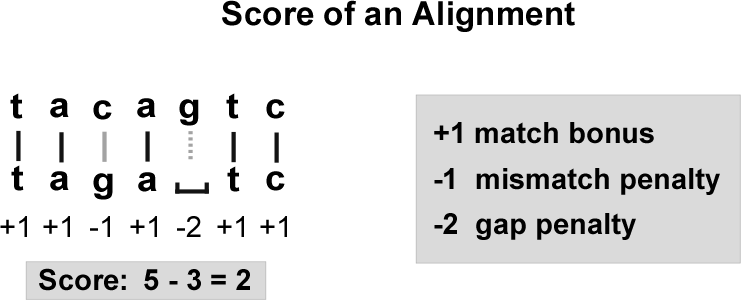
General solution: we assign a score to each position of an alignment.
-
Matches receive a (base-dependent) bonus. Mismatches or gaps receive a (base-dependent) penalty.
-
The score of an alignment is the total score of all its positions (Figure 6).
-
Alignments with higher scores provide stronger evidence of conservation.
In practice, tools like BLAST seek portions of two sequences that form high-scoring alignments. For example, we might want to isolate alignments between the exons of two genes, while ignoring the much less conserved introns between them. A correspondence between portions of two sequences is called a local alignment.
-
I’m resolutely ignoring the question of how optimal alignments are computed efficiently.
4. Alignments in Context: Database Search
Given two sequences, we now know how to measure their similarity. What the heck does this have to do with database search?
-
Annotation tools must compare a query sequence to a large database of potentially matching sequences.
-
For each sequence in the database, it is possible to compute an optimal local alignment with the query sequence.
-
So, which alignments do we report?
-
Higher alignment scores are better, so we could just report the k highest-scoring alignments between query and database.
-
But are these alignments interesting? Maybe they indicate chance matches between unrelated sequences, rather than real conservation.
-
We need a way to assess whether a given alignment score is meaningful in the context of a search.
BLAST and related tools use the idea of E-values to rate how interesting a pair of aligned sequences is. Here’s where E-values come from …
-
Suppose we have sequences \(S\) and \(T\) whose best local alignment has some score \(\sigma\).
-
Null Hypothesis: \(S\) and \(T\) are unrelated sequences.
-
Under this hypothesis, would we expect \(S\) and \(T\) to align with a score as high as \(\sigma\) purely by chance?
-
To answer this question, we need a formal mathematical model \(M\) of what a pair of unrelated sequences looks like.
-
Model: a DNA sequence is an i.i.d. random sequence of bases. i.i.d. means “independent and identically distributed.” In other words, we build a sequence by randomly choosing its first base, then independently choosing its second base, and so forth.
-
How do we choose each base? For each base b in the sequence alphabet, choose b with probability proportional to its observed frequency. For example, if 'a' is more common in database than 'c', our model M picks 'a’s more often than 'c’s.
-
Now we can formalize our question a bit more. Given sequences S, T generated at random from model M, what is the probability \(p(\sigma)\) that S and T will align with score at least \(\sigma\)?
-
If \(p(\sigma)\) is very small, we reject the null hypothesis as unlikely and call the alignment interesting.
-
An easier quantity to compute is \(E(\sigma)\), the expected number of times an unrelated sequence from the database would align to the query with score at least \(\sigma\), assuming that query and database were generated according to the null hypothesis.
-
The “BLAST E-value” for an alignment with score \(\sigma\) is this \(E(\sigma)\).
-
\(E(\sigma)\) depends on database size. It should be very small (much less than 1) before we believe that an alignment with score \(\sigma\) is interesting.
A few caveats about E-values…
-
The null model makes the very strong assumption of i.i.d. random sequences.
-
The bases of real DNA sequences do not occur independently, even when the sequence has no biological function.
-
Example: loss of CpG dinucleotides
-
Also, the database may have heterogeneous base composition, which violates the assumption of identical distribution.
-
Example: AT-rich and GC-rich regions within a single genome.
-
For these reasons, small E-values should be taken with a grain of salt.
-
Rejecting the null model with E = 0.01 is not the same as saying “\(S\) and \(T\) are 99% likely to be homologous”!
-
When using E-values to judge the likelihood that a match is interesting, use a large margin of safety — be very suspicious of \(E(\sigma) > 10^{-5}\), or possibly even \(10^{-10}\).