Prerequisites
Resources
The package containing the files for this walkthrough is available through the "Chimp BAC Analysis: Genes and Pseudogene" page on the GEP website.
Introduction
Recent technological advances have dramatically increased the rate at which we can generate high-quality DNA sequence. However, characterization of features (genes, repetitive elements, etc.) found within these raw sequences remains a slow and labor-intensive process. Multiple computational methods have been devised to improve the efficiency of sequence annotation. In this walkthrough, we will focus on the identification of genes and pseudogenes in a chimpanzee BAC clone. The GENSCAN and BLAST programs, along with the UCSC Genome Browser, will be used to facilitate the annotation process.
GENSCAN is a program that predicts the locations of genes in DNA sequences. While potential genes identified by GENSCAN must still be experimentally confirmed, its predictions can nonetheless help narrow the scope of the investigation by identifying regions where genes are most likely to be found. GENSCAN uses a probabilistic model to predict locations of promoters, exons, and polyadenylation signals.
Discussion of the actual implementation of GENSCAN is beyond the scope of this tutorial. For additional information on how GENSCAN works and on how to use GENSCAN, please see the paper by [Burge and Karlin, 1997] and the GENSCAN website.
The Chimp_BAC_Analysis folder contains all the files required for this tutorial. The file ChimpBAC_sequence.fasta contains a 170kb sequence from chimpanzee. The ChimpBAC_sequence_RM.fasta file contains the repeat-masked version of the same sequence using the primate library with RepeatMasker. GENSCAN_ChimpBAC.html contains the GENSCAN predictions for our sequence.
Overview of GENSCAN predictions
The GENSCAN analysis of our BAC is available in the file GENSCAN_ChimpBAC.html. To view the GENSCAN results, launch a web browser and open the html file. In order to reduce the number of spurious gene predictions, we have masked repetitive sequences (including low complexity sequences) in the BAC sequence prior to running GENSCAN. You can run the GENSCAN analysis yourself by submitting the sequence (ChimpBAC_sequence_RM.fasta) to the GENSCAN web server.
|
|
If you run the analysis on the GENSCAN web server, please note that the links to the PDF and PostScript files are currently broken. |
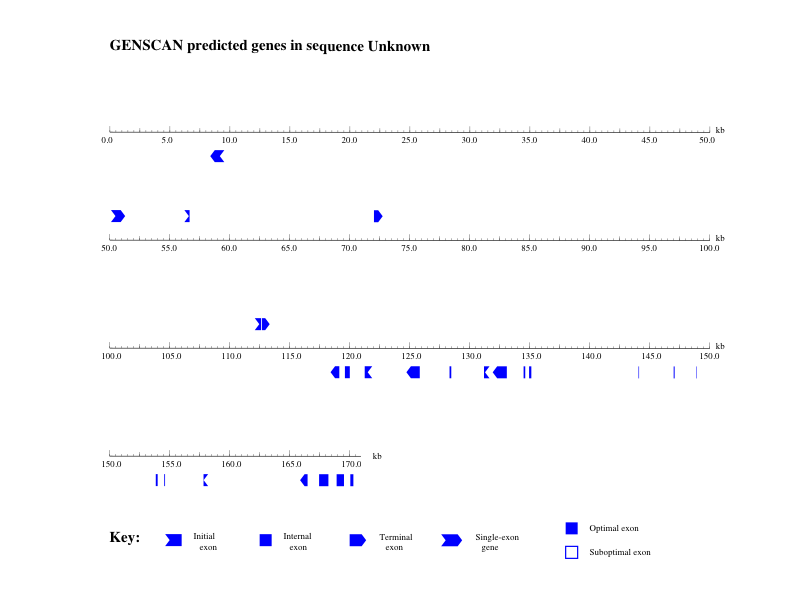
GENSCAN was run on the chimp BAC using the vertebrate parameter set. It predicted 8 genes in this sequence of about 170kb (Figure 1). However, most of these genes consist of only one or two exons, which is unusual (the median for chimp is about 8 exons).
The first part of the GENSCAN output (GENSCAN_ChimpBAC.html) is a table that summarizes the 8 predicted genes within this BAC. Explanations of the columns in the table are available at the end of the GENSCAN output. Illustrations of the locations of the predicted genes are also available in PDF format (GENSCAN_ChimpBAC_genes.pdf). The rest of the output consists of the peptide (amino acid) and coding (nucleotide) sequences of the predicted genes. We will use these sequences to evaluate the validity of the GENSCAN predictions.
Analysis of predicted gene 1 (single exon, 423 coding bases)
Examine conserved domain matches from the blastp search of the predicted peptide against the nr protein database
To get an idea of what this predicted gene could be, we will run a protein-protein BLAST (blastp) search against the NCBI’s non-redundant (nr) database using default parameters. (The blastp results are available in the file blastpGene1.txt in the tutorial package.) The nr database consists of most of the known and hypothetical protein sequences that have been submitted to GenBank, with groups of essentially identical sequences reduced to a single sequence (hence the name "non-redundant"). While the BLAST hits produced with the nr database often contain relatively little information to help us interpret them, the names of these hits and their corresponding references nonetheless provide us with a reasonable starting point.
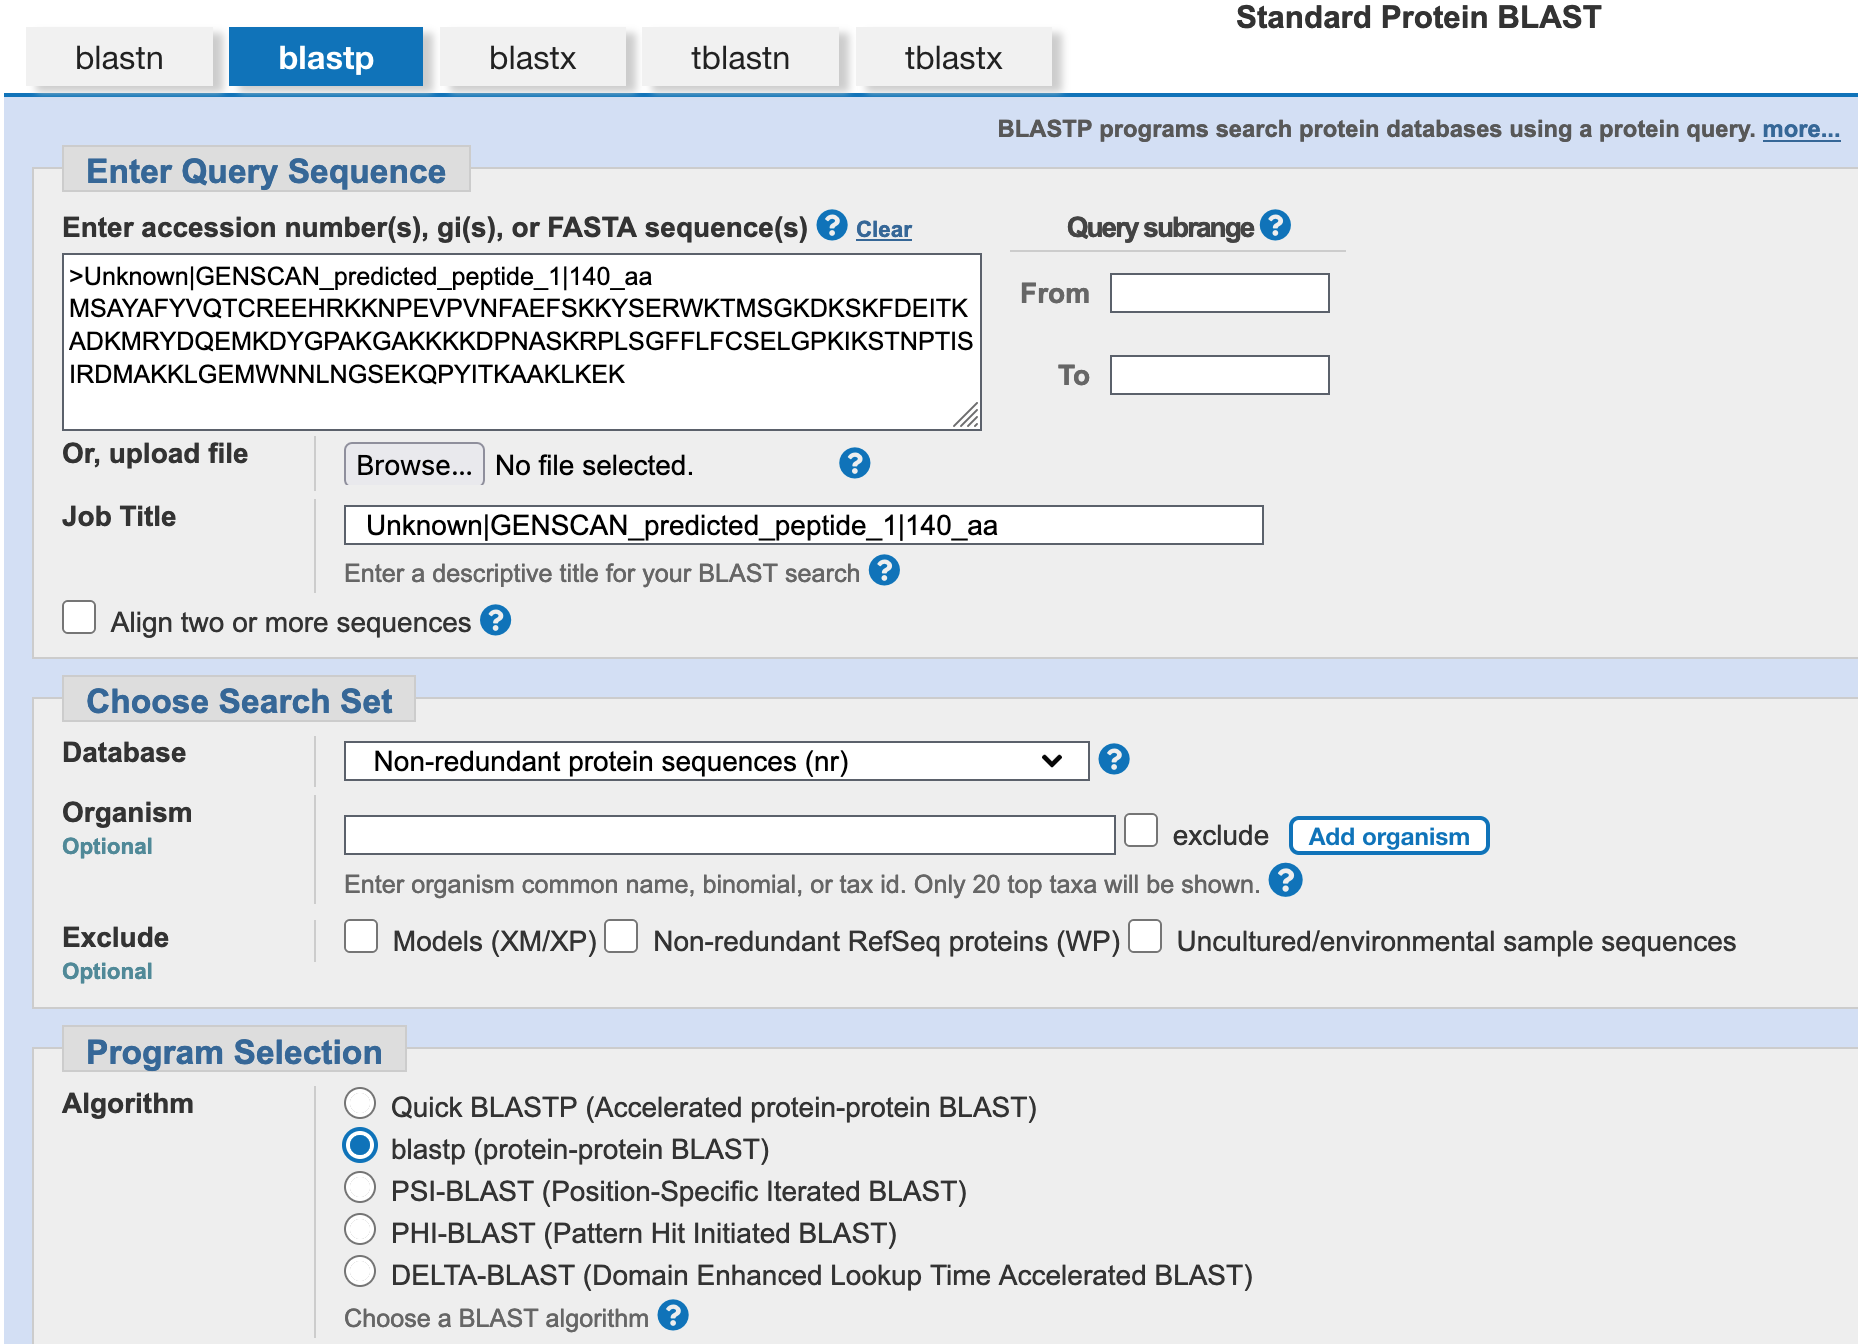
Copy the peptide sequence of this gene prediction (from the GENSCAN output) onto the clipboard. Open a new web browser window, navigate to the BLAST server at NCBI, and click on the "Protein BLAST" image. Paste the contents of the clipboard into the query search box and click "BLAST" (Figure 2).
|
|
For teaching purposes, you can find the results of the blastp search in the file blastpGene1.txt. |
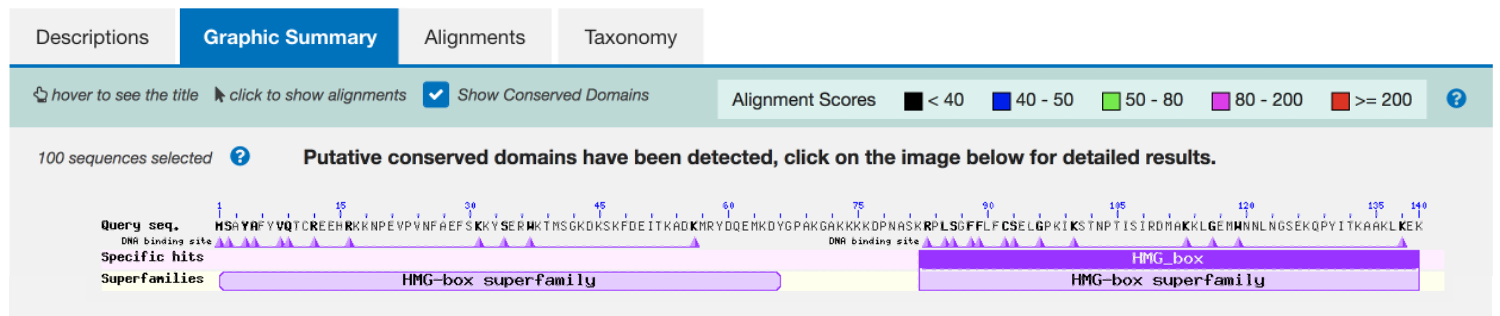
Click on the "Graphic Summary" tab to obtain a graphical overview of the BLAST results. This tab shows that the predicted protein contained two copies of a conserved domain (the HMG-box superfamily, Figure 3). We can learn more about this conserved domain through the Conserved Domain database (CDD).
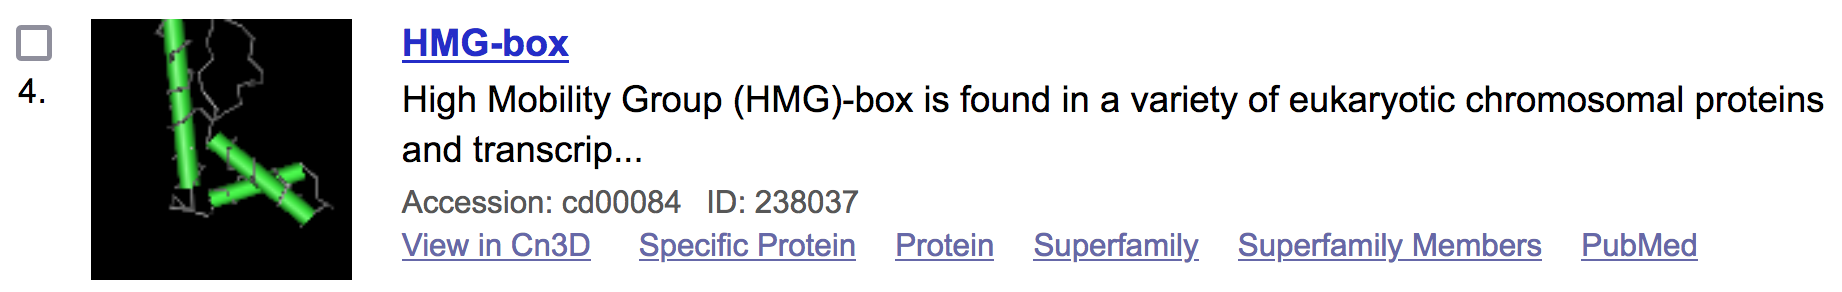
Open a new web browser window and navigate back to the NCBI home page. On the top search bar, change the database to "Conserved Domains" and search for "HMG-box" (Figure 4). Click on the fourth link with the accession number cd00084 (Figure 5). The "cd" prefix indicates that the staff at NCBI curated this record.
|
|
Each record in GenBank has an accession number (e.g., cd00084) that uniquely identifies the record in all the major sequence databases (e.g., NCBI, DDBJ, EMBL). |

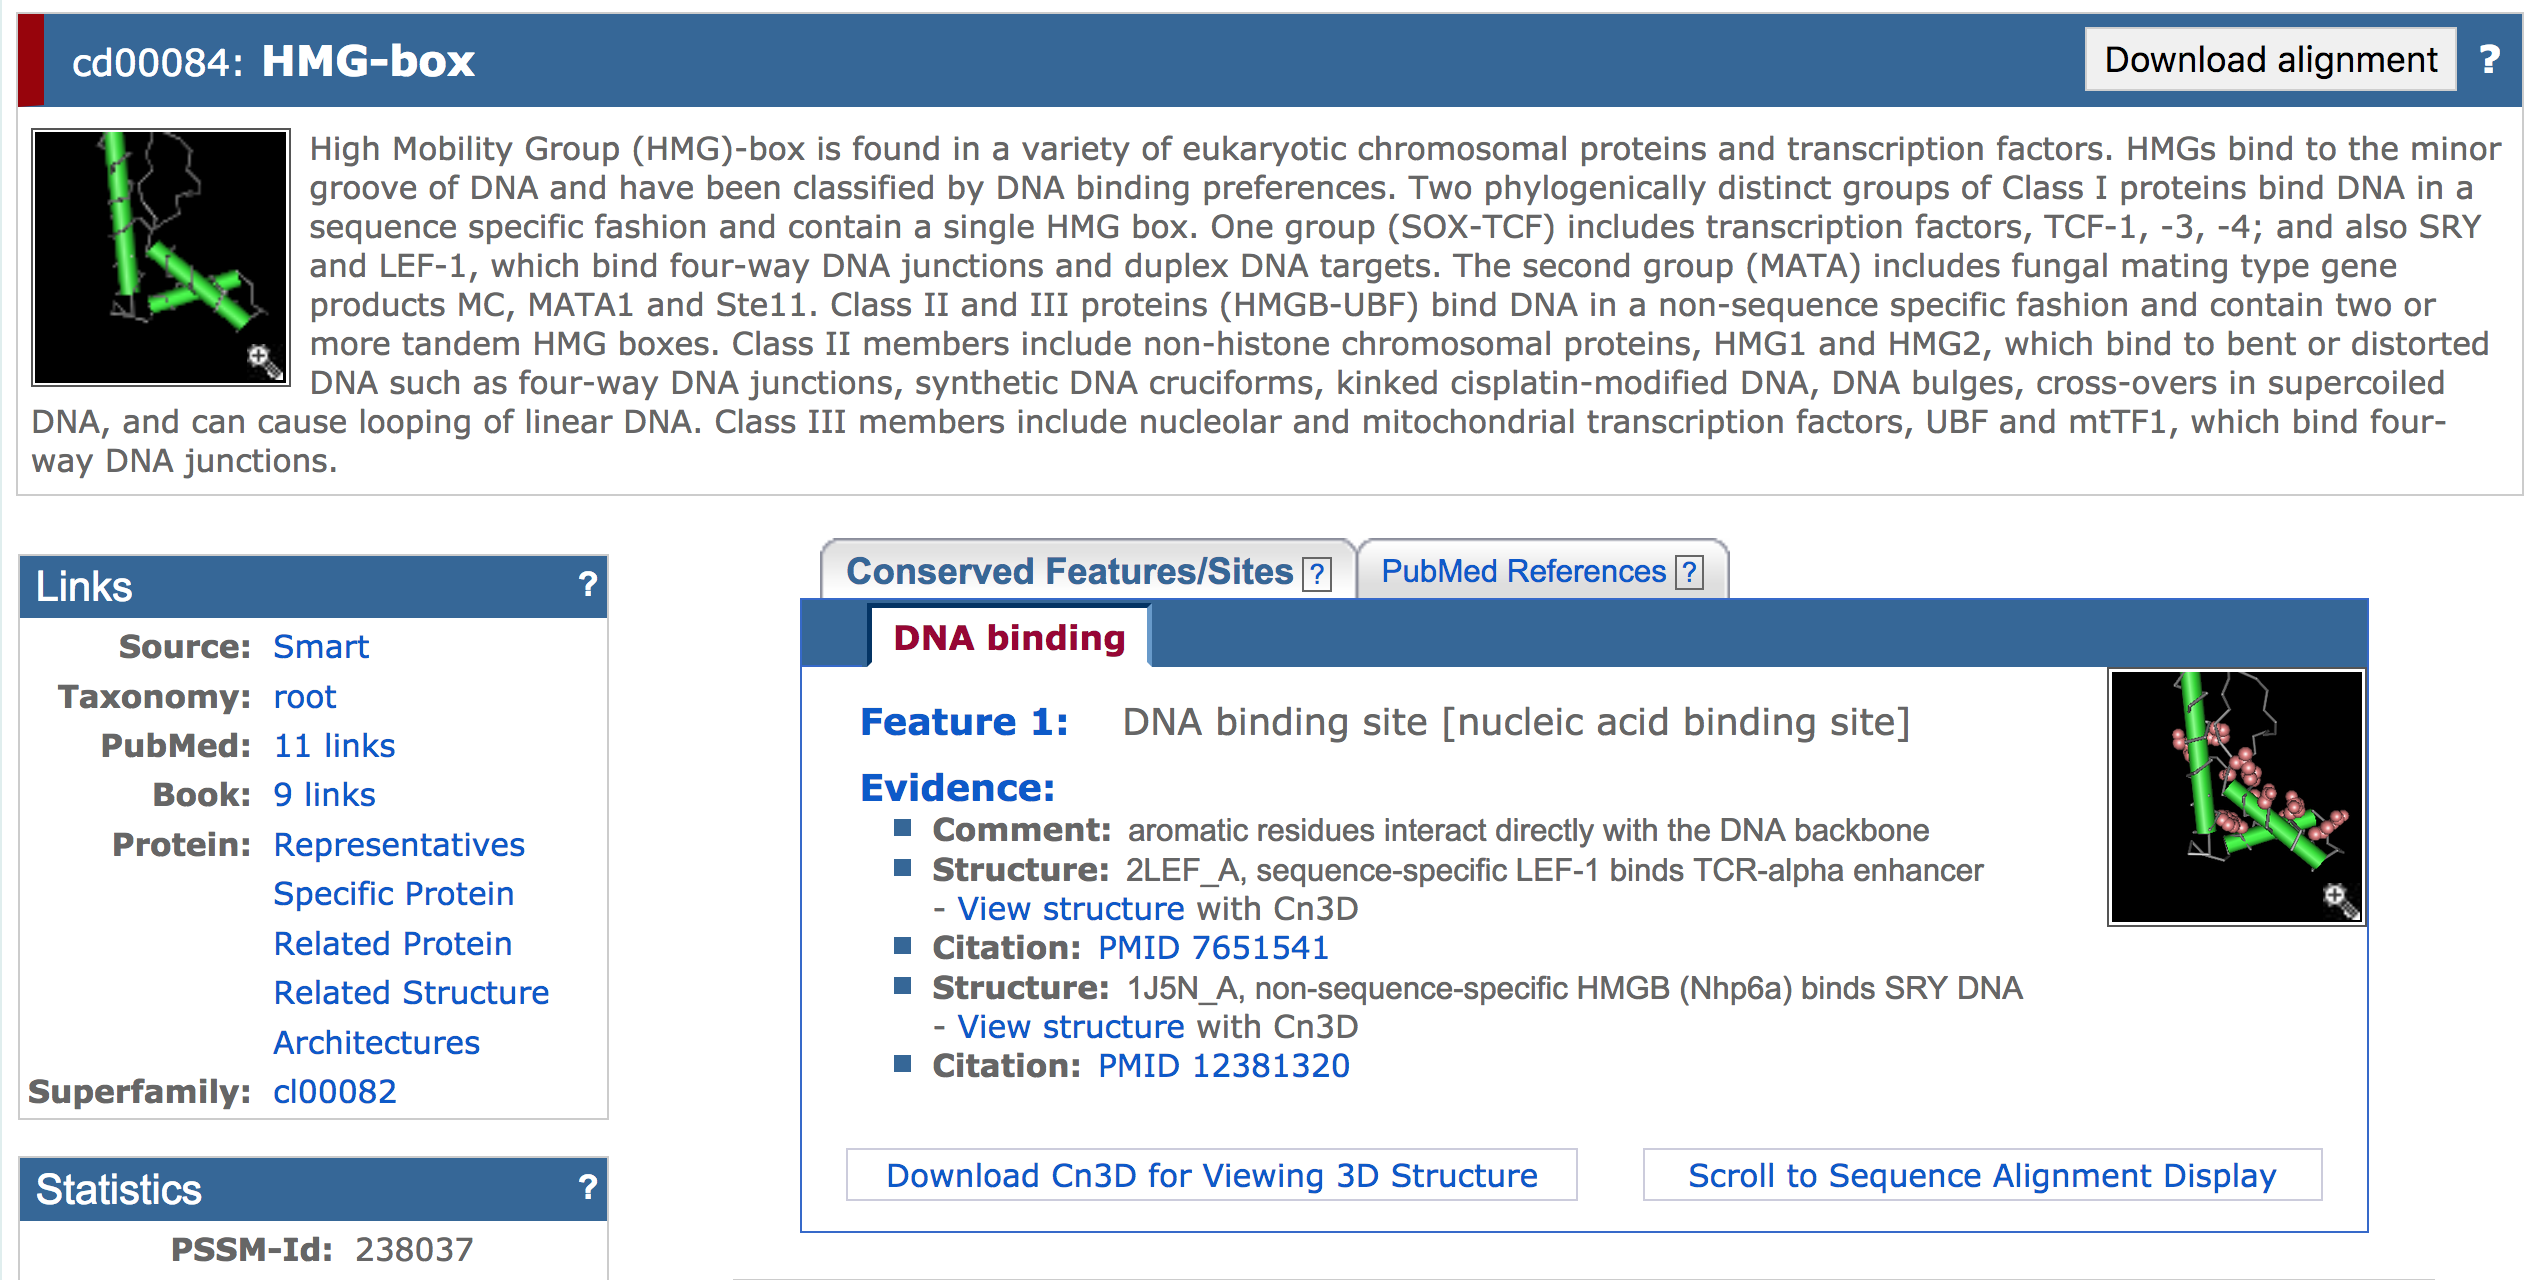
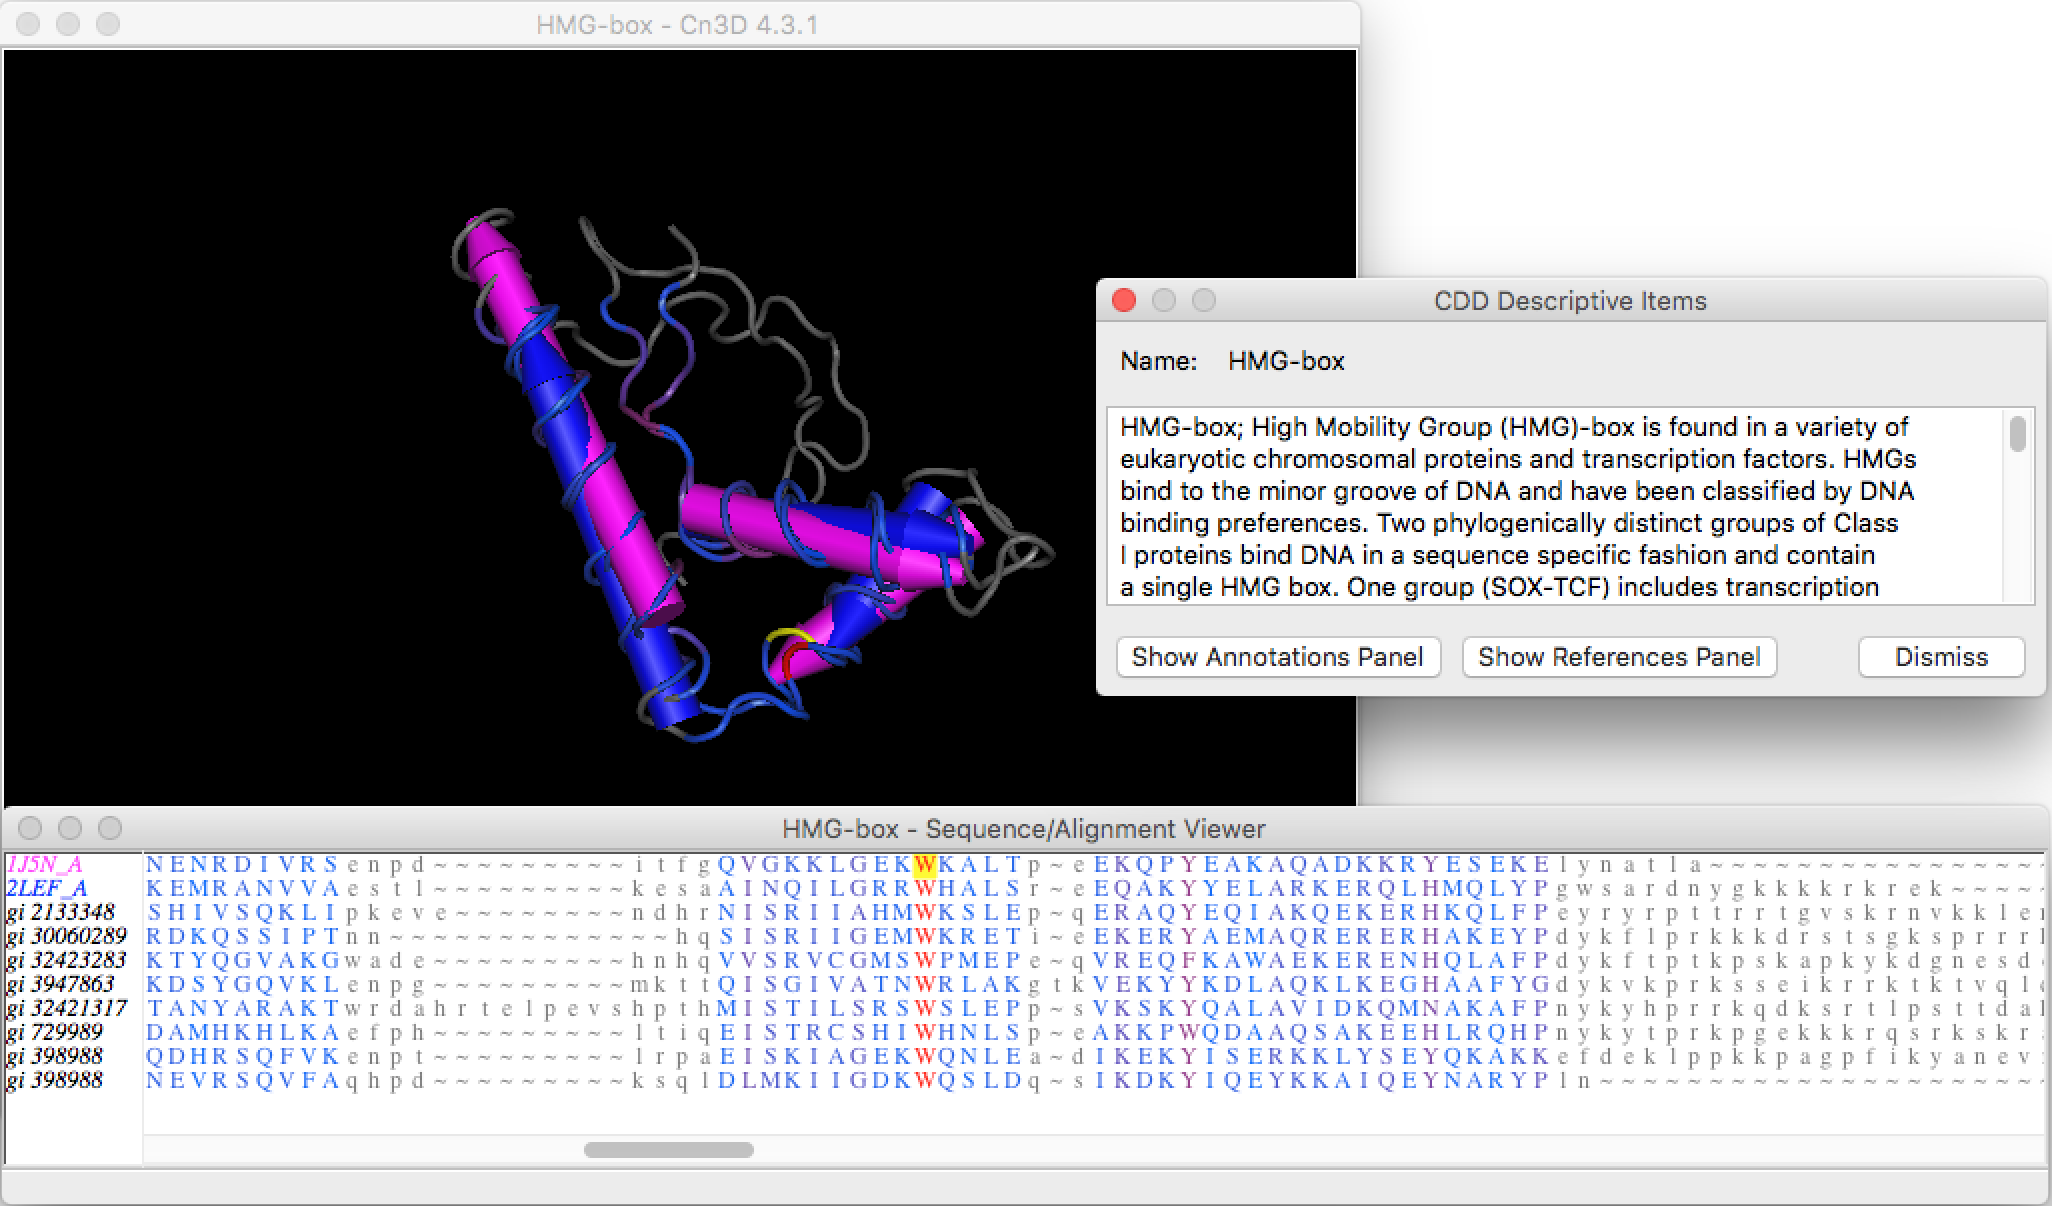
The results page provides a summary and links to literature references for this conserved domain. You can also see the 3D structure of the HMG-box (HMGbox.cn3 in the exercise package) if you have the structure viewer Cn3D installed (Figure 6). The bottom of the page shows the multiple sequence alignment used to construct the Position Specific Score Matrix (PSSM) for this conserved domain. The CD-Search program uses this PSSM to identify conserved domains in a query sequence. See the Conserved Domains and Protein Classification Help page for more information.
We can learn the function of the HMG-box from the description of the CDD record:
High Mobility Group (HMG)-box is found in a variety of eukaryotic chromosomal proteins and transcription factors. HMGs bind to the minor groove of DNA and have been classified by DNA binding preferences. Two phylogenically distinct groups of Class I proteins bind DNA in a sequence specific fashion and contain a single HMG box. One group (SOX-TCF) includes transcription factors, TCF-1, -3, -4; and also SRY and LEF-1, which bind four-way DNA junctions and duplex DNA targets. The second group (MATA) includes fungal mating type gene products MC, MATA1 and Ste11. Class II and III proteins (HMGB-UBF) bind DNA in a non-sequence specific fashion and contain two or more tandem HMG boxes. Class II members include non-histone chromosomal proteins, HMG1 and HMG2, which bind to bent or distorted DNA such as four-way DNA junctions, synthetic DNA cruciforms, kinked cisplatin-modified DNA, DNA bulges, cross-overs in supercoiled DNA, and can cause looping of linear DNA. Class III members include nucleolar and mitochondrial transcription factors, UBF and mtTF1, which bind four-way DNA junctions.
|
|
If you would like to learn more about the HMG-box domain, the description page also contains links to 11 original research articles. You can access the PubMed entries for these articles by clicking on the link next to the "PubMed" label in the "Links" section (column on the left). In addition to the abstracts, most of the PubMed entries contain links to the entire research article. |
Now that we have a basic idea on the potential function of the predicted gene, we are ready to examine the alignments from our blastp search against the nr database. To summarize our conclusions from the motif portion of the BLAST search: the first GENSCAN predicted gene is probably a real gene with a DNA binding function, or a pseudogene derived from a real gene. Because this prediction is a single-exon gene (only about 7% of known human genes have a single exon), we should be vigilant looking for signs that this prediction is either a pseudogene or a mispredicted fragment of a multi-exon gene. It would not be terribly surprising if GENSCAN missed an exon or split two exons of the same transcript into multiple gene predictions.
Examine blastp alignments of predicted peptide against the nr protein database
The graphical overview tab shows that there are many significant hits to the nr database that cover the entire length of the predicted protein, supporting the gene model of the predicted gene. You can confirm this by clicking on the "Descriptions" tab and then click on the description of each hit and examining the alignments (Figure 7). However, many of the top hits have accession numbers that begin with the "XP_" prefix, which means that these predictions are unconfirmed and have no experimental evidence to support them. Generally, we do not want to rely on (possibly incorrect) computational predictions alone for any part of our annotation; instead, we will seek matches that are based on more direct evidence.
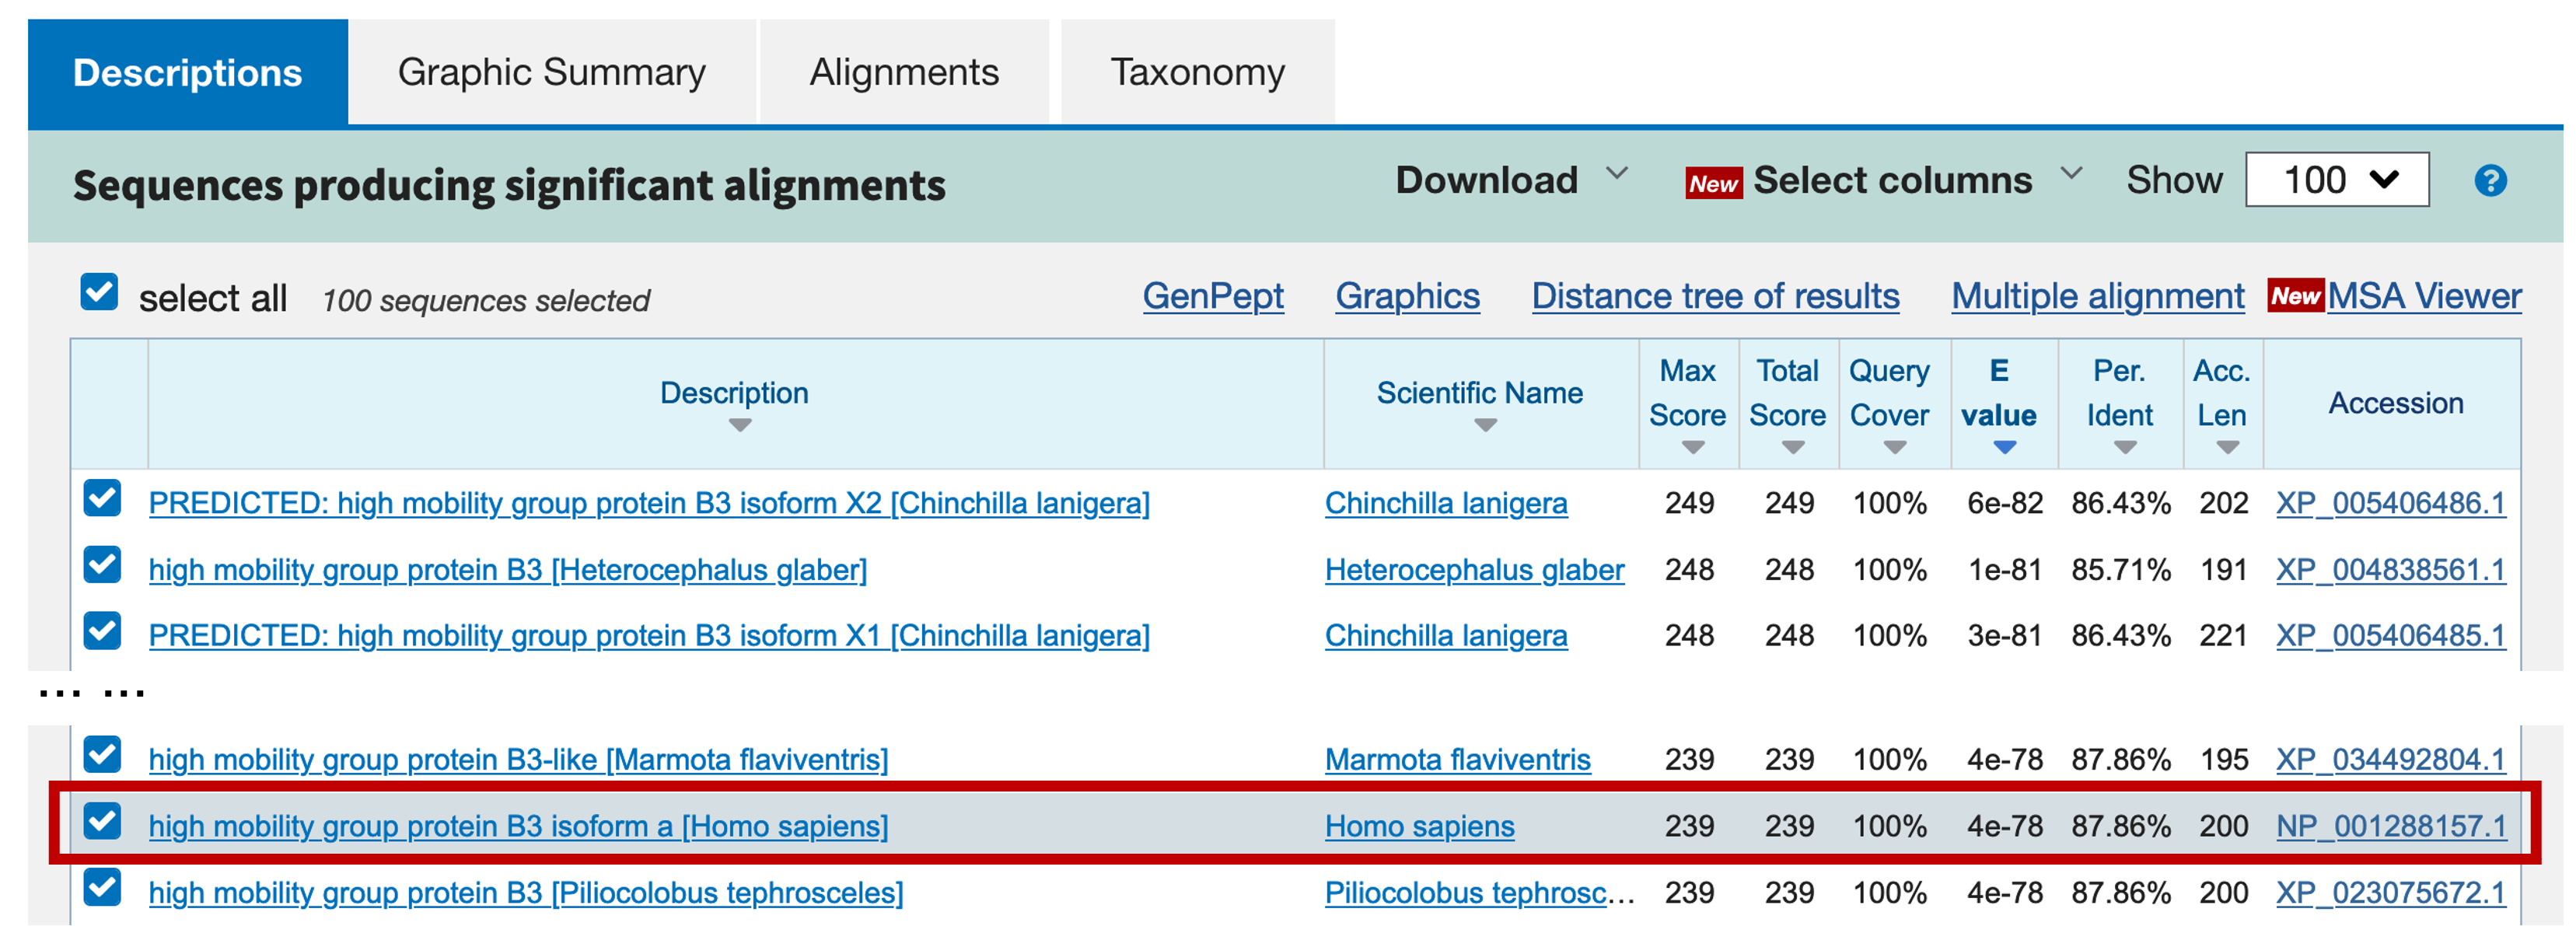
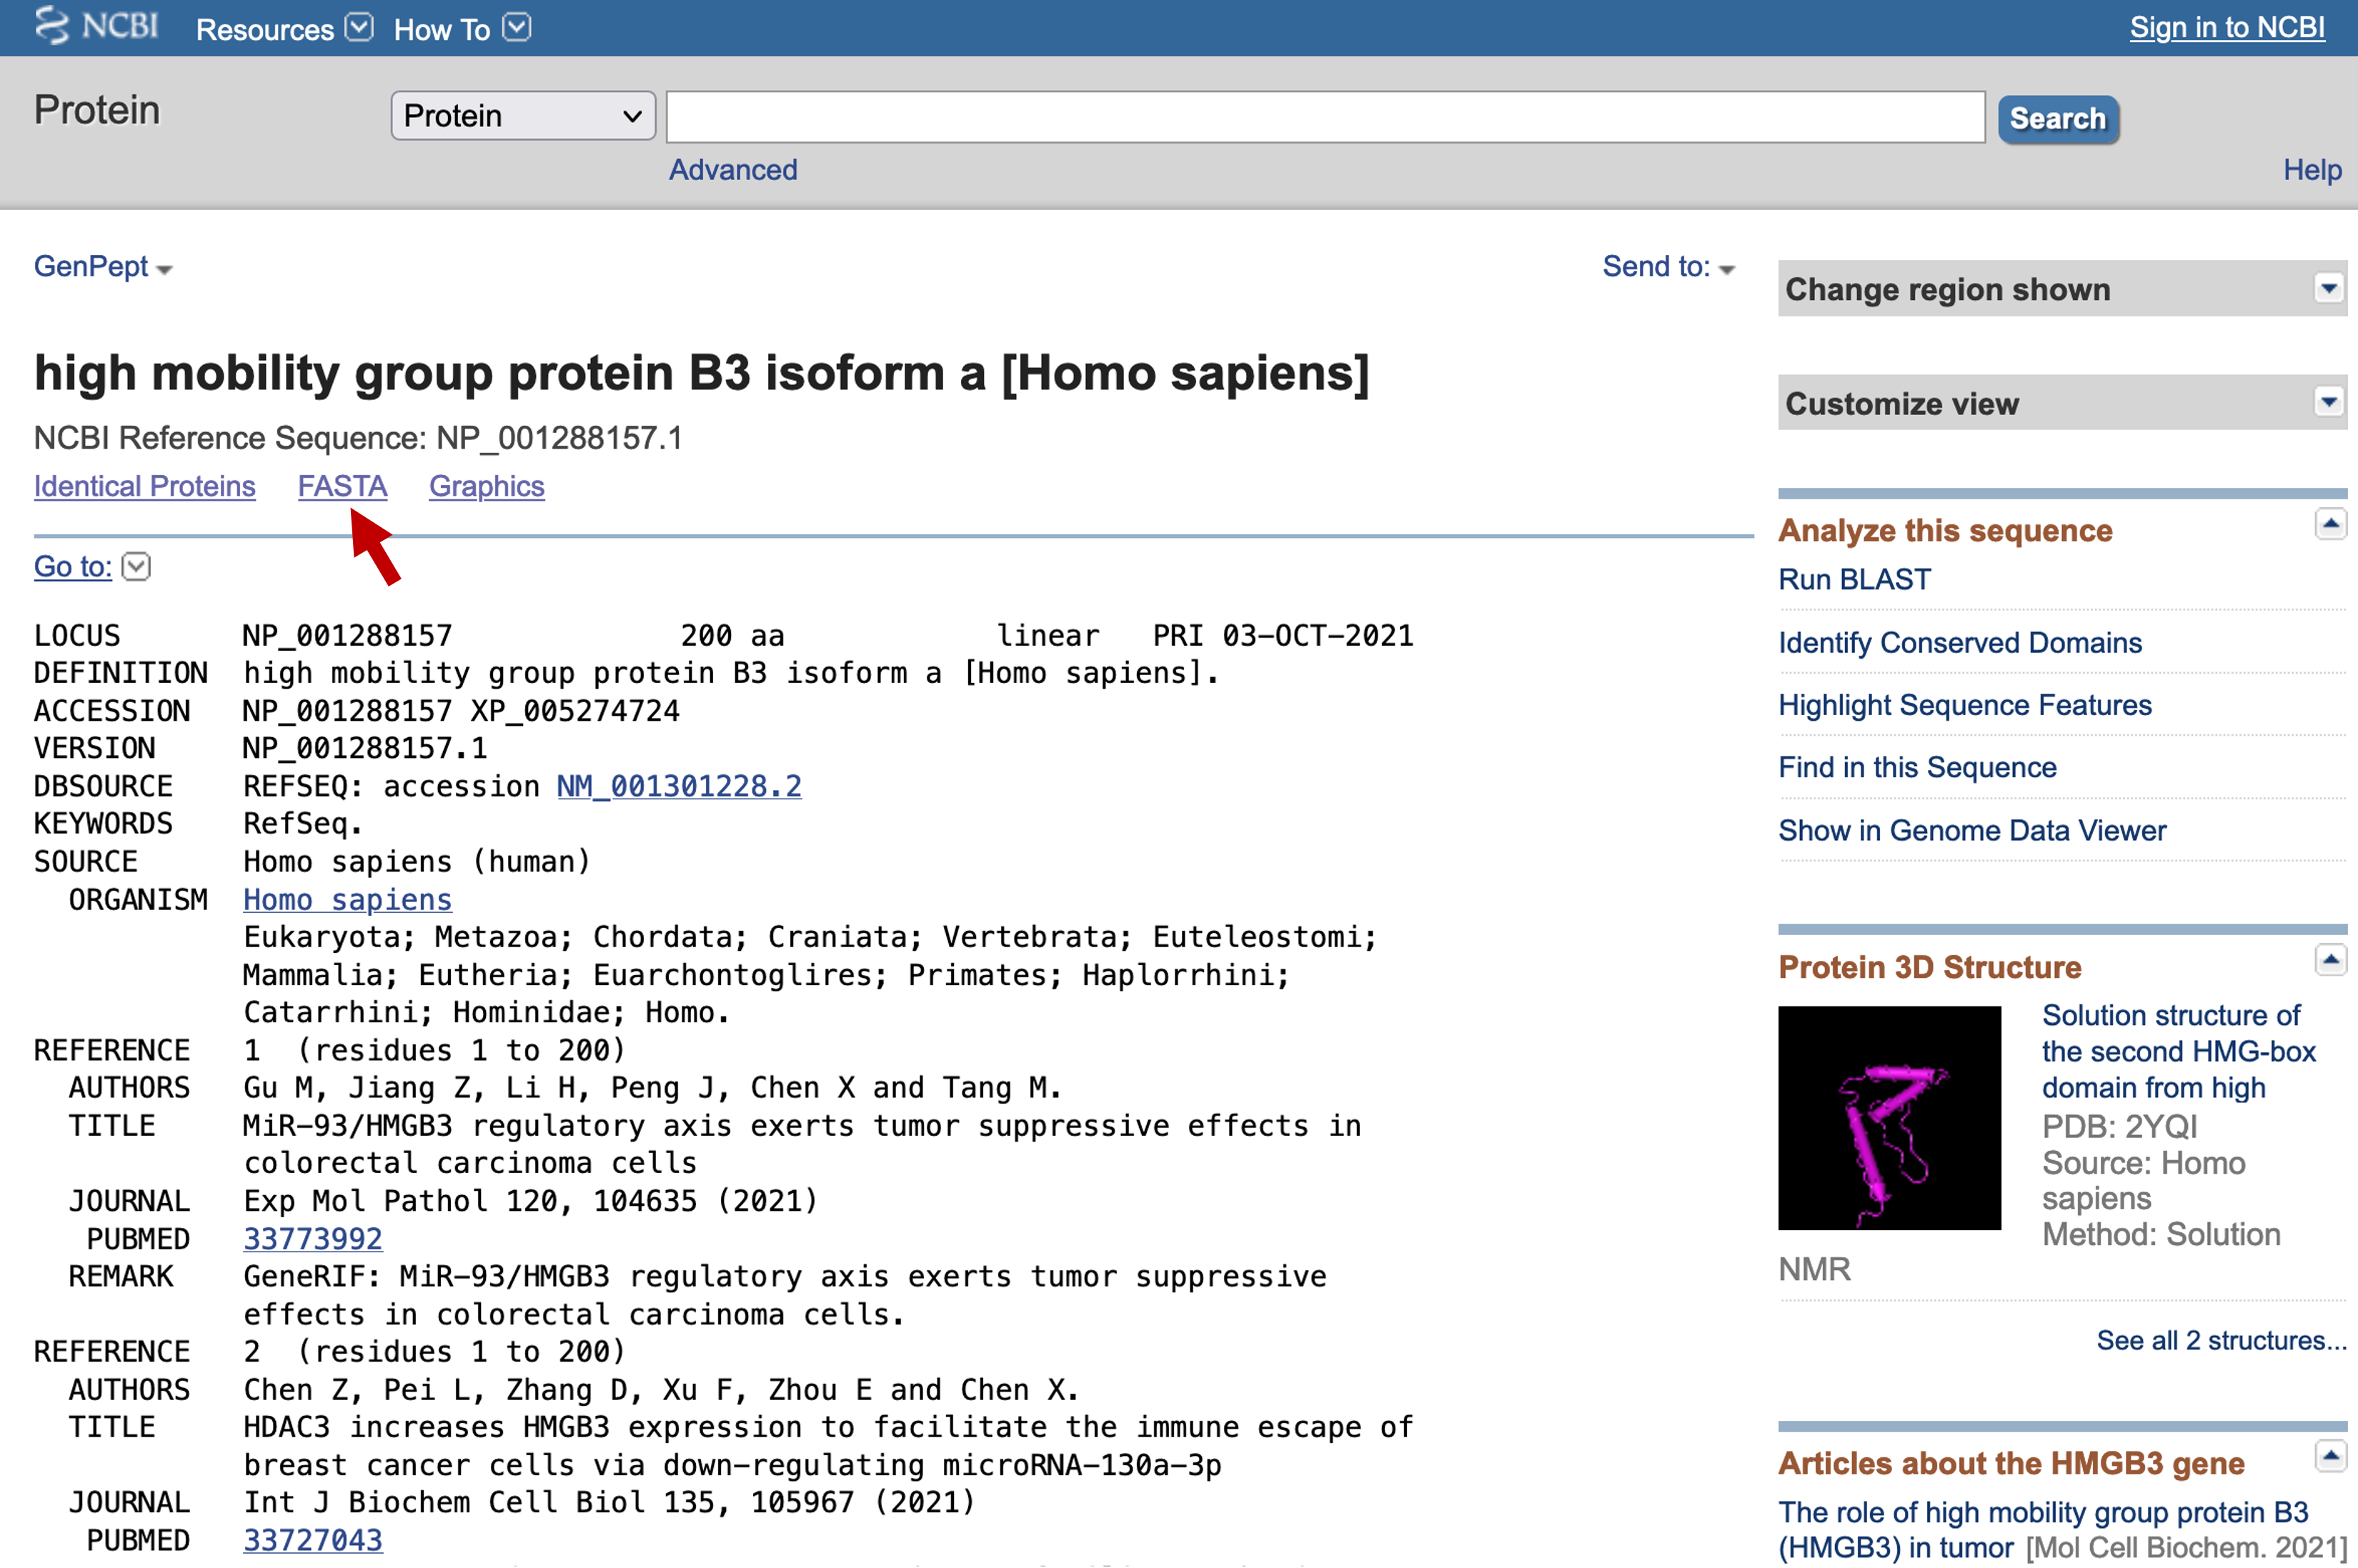
The best experimentally confirmed RefSeq match (with the accession number NP_001288157.1) corresponds to the human HMGB3 protein (Figure 7). Click on the link in the Description column to jump to the alignment (Figure 8).
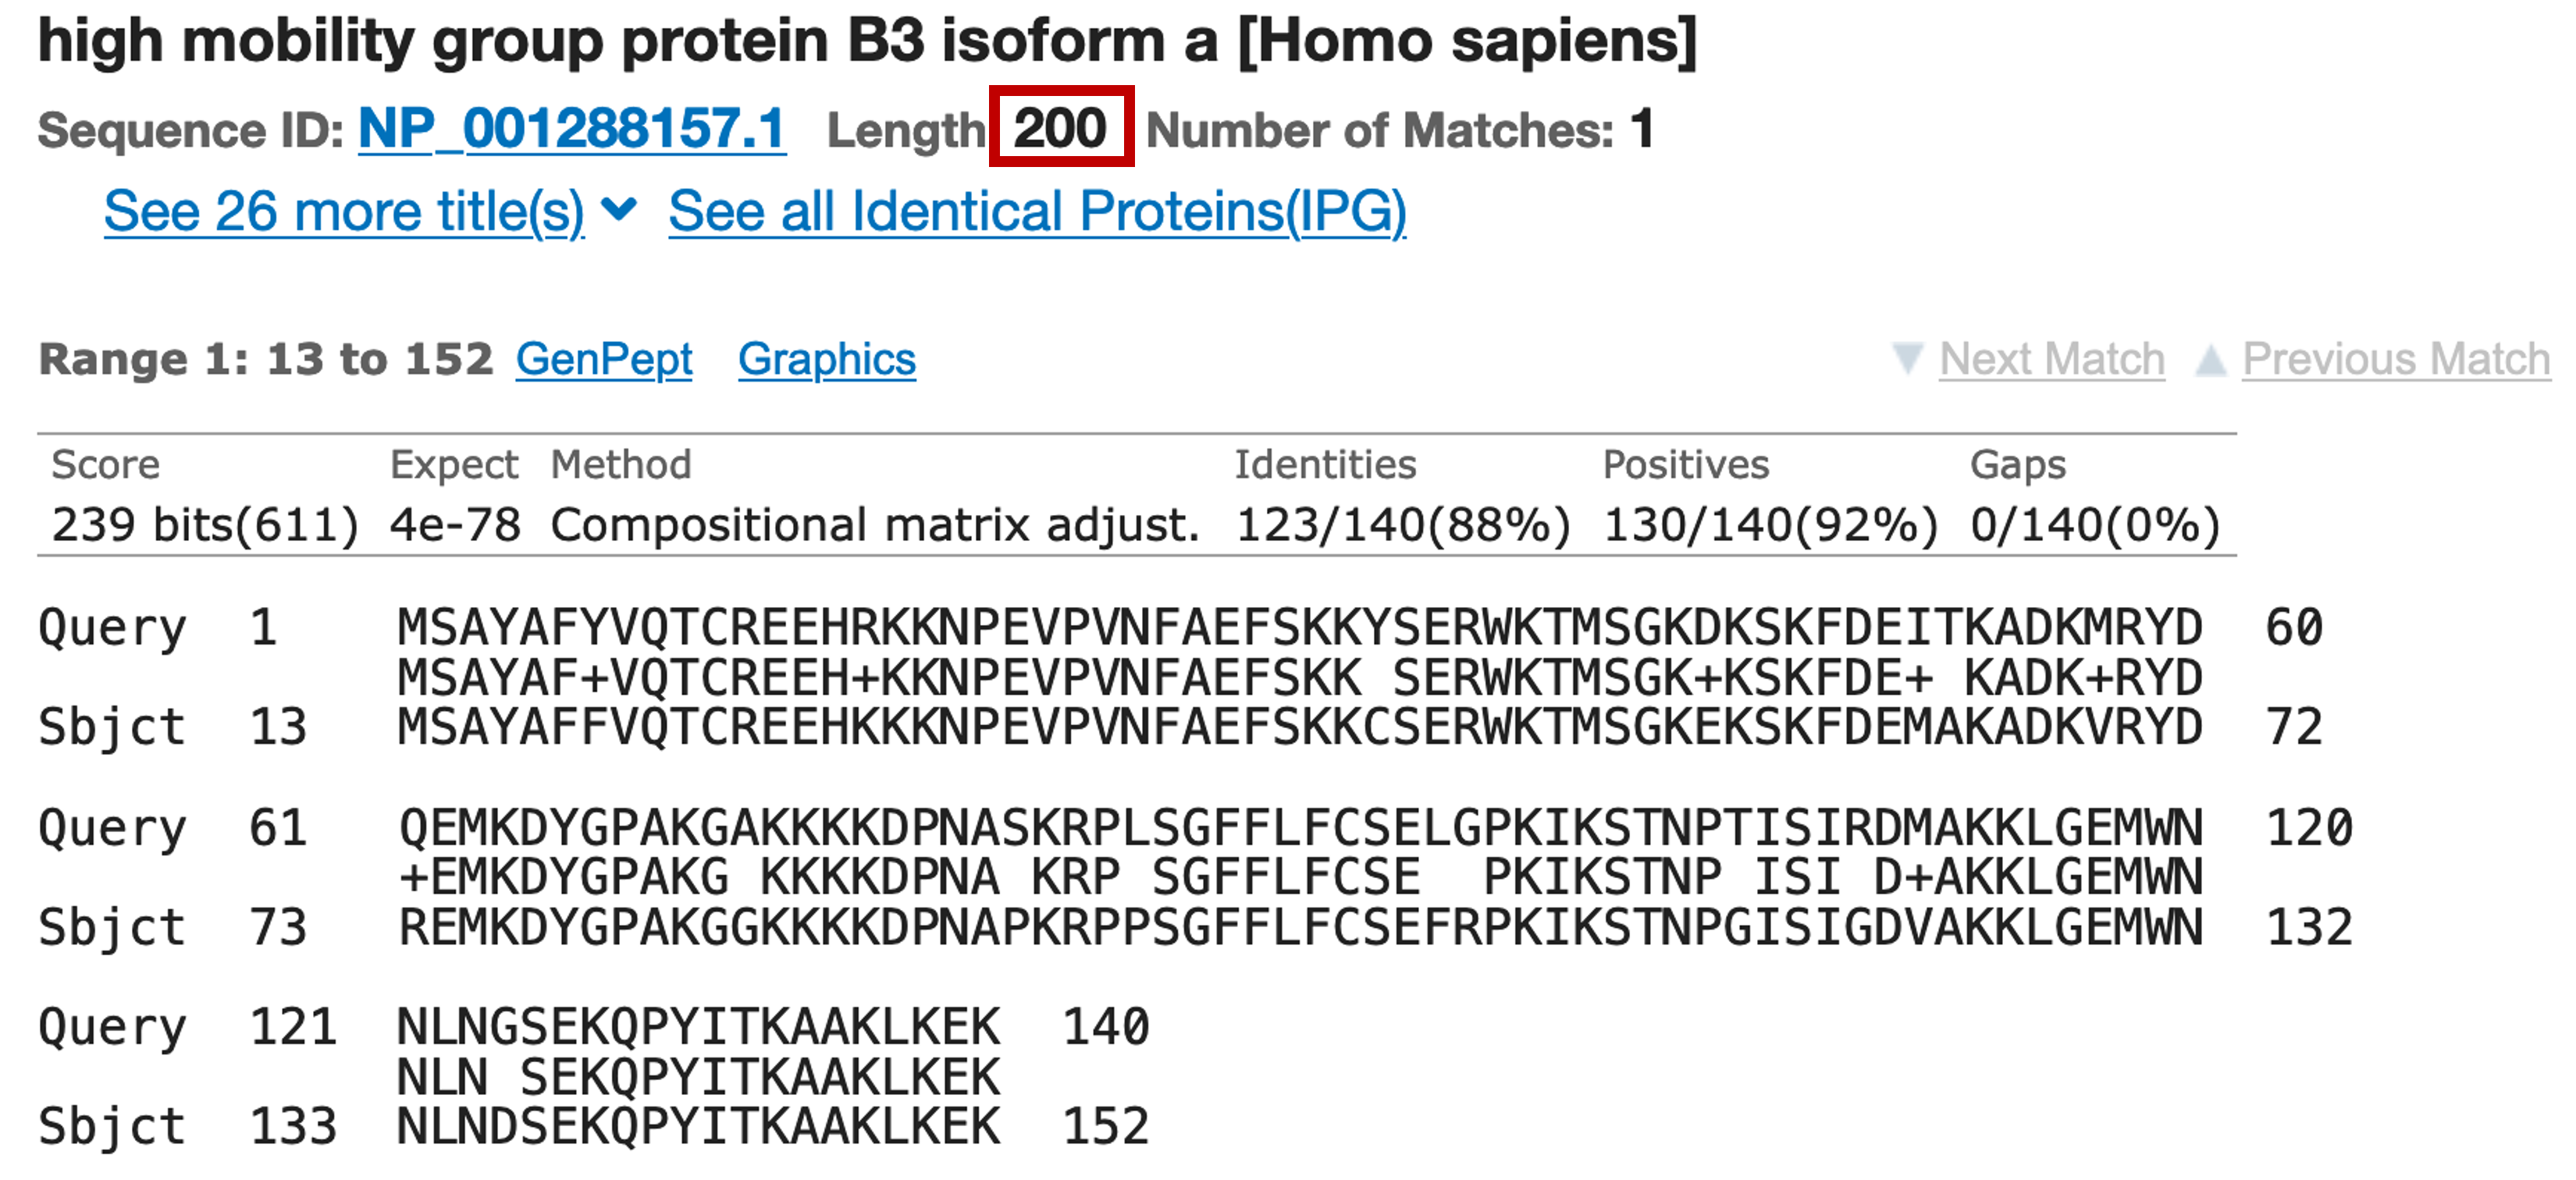
Looking at the "Length" field beneath the sequence name, we see that the full HMGB3 protein has a length of 200 amino acids. However, recall that our predicted peptide only has 140 amino acids. There are three potential explanations for this discrepancy. First, GENSCAN might have missed part of the real chimp protein. This scenario could happen if GENSCAN failed to identify one or more exons, or called them as part of another gene. Alternatively, the predicted gene might be a pseudogene that has acquired an in-frame stop codon. The stop codon would cause the GENSCAN prediction to end prematurely. A third hypothesis is that GENSCAN has accurately predicted a functional protein that is closely related to the human HMGB3 protein but lacks some part of it, such as one or more functional domains.
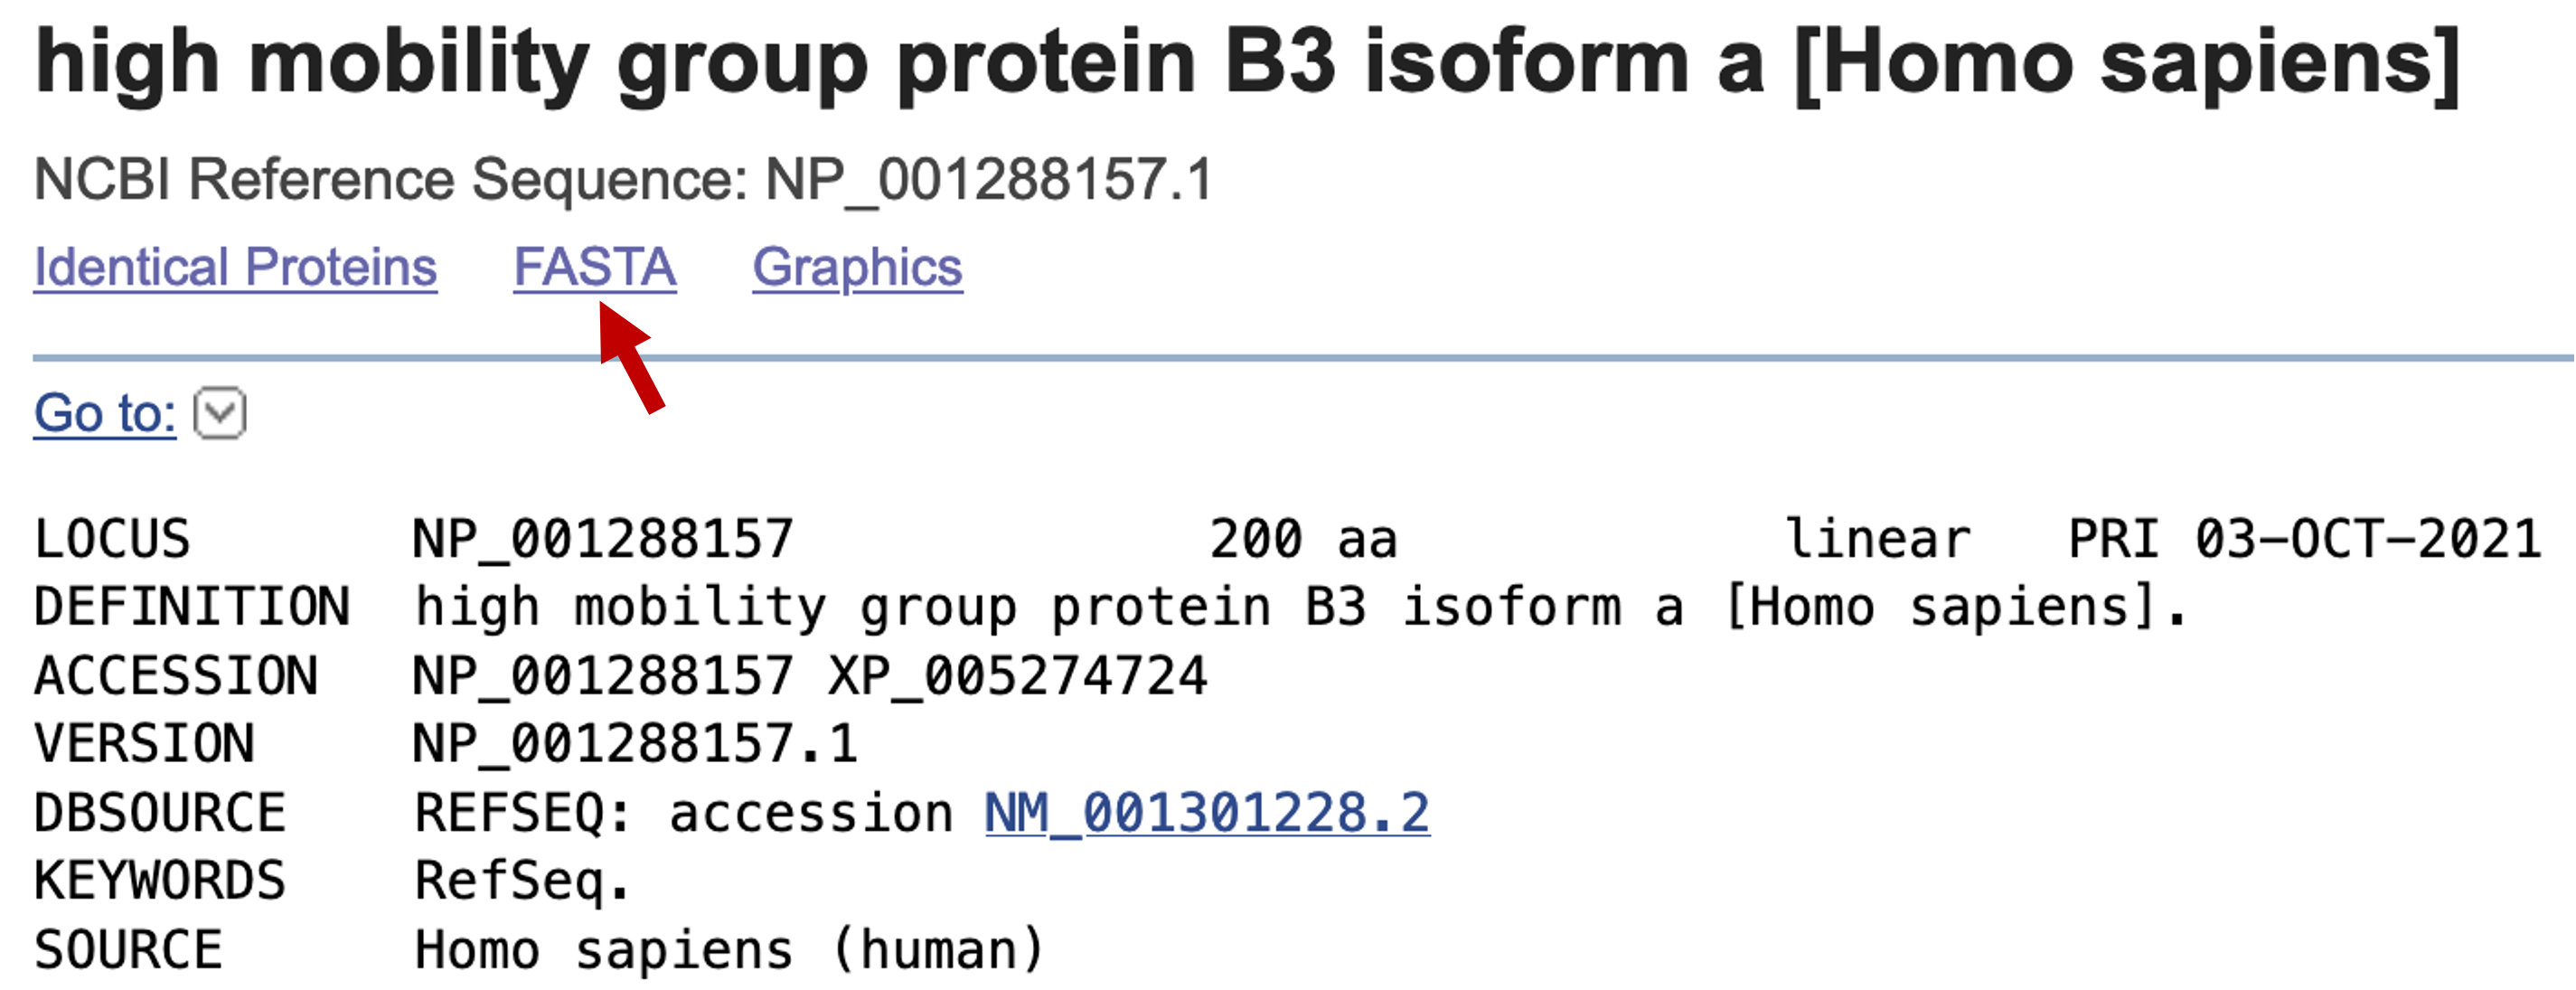
We can retrieve the GenBank entry for this BLAST hit by clicking on the accession number NP_001288157.1. In this page, you can display and export the GenBank record in a variety of formats, including FASTA (Figure 9). The most useful thing here is the PubMed links to the primary research papers that describes the human HMGB3 protein.
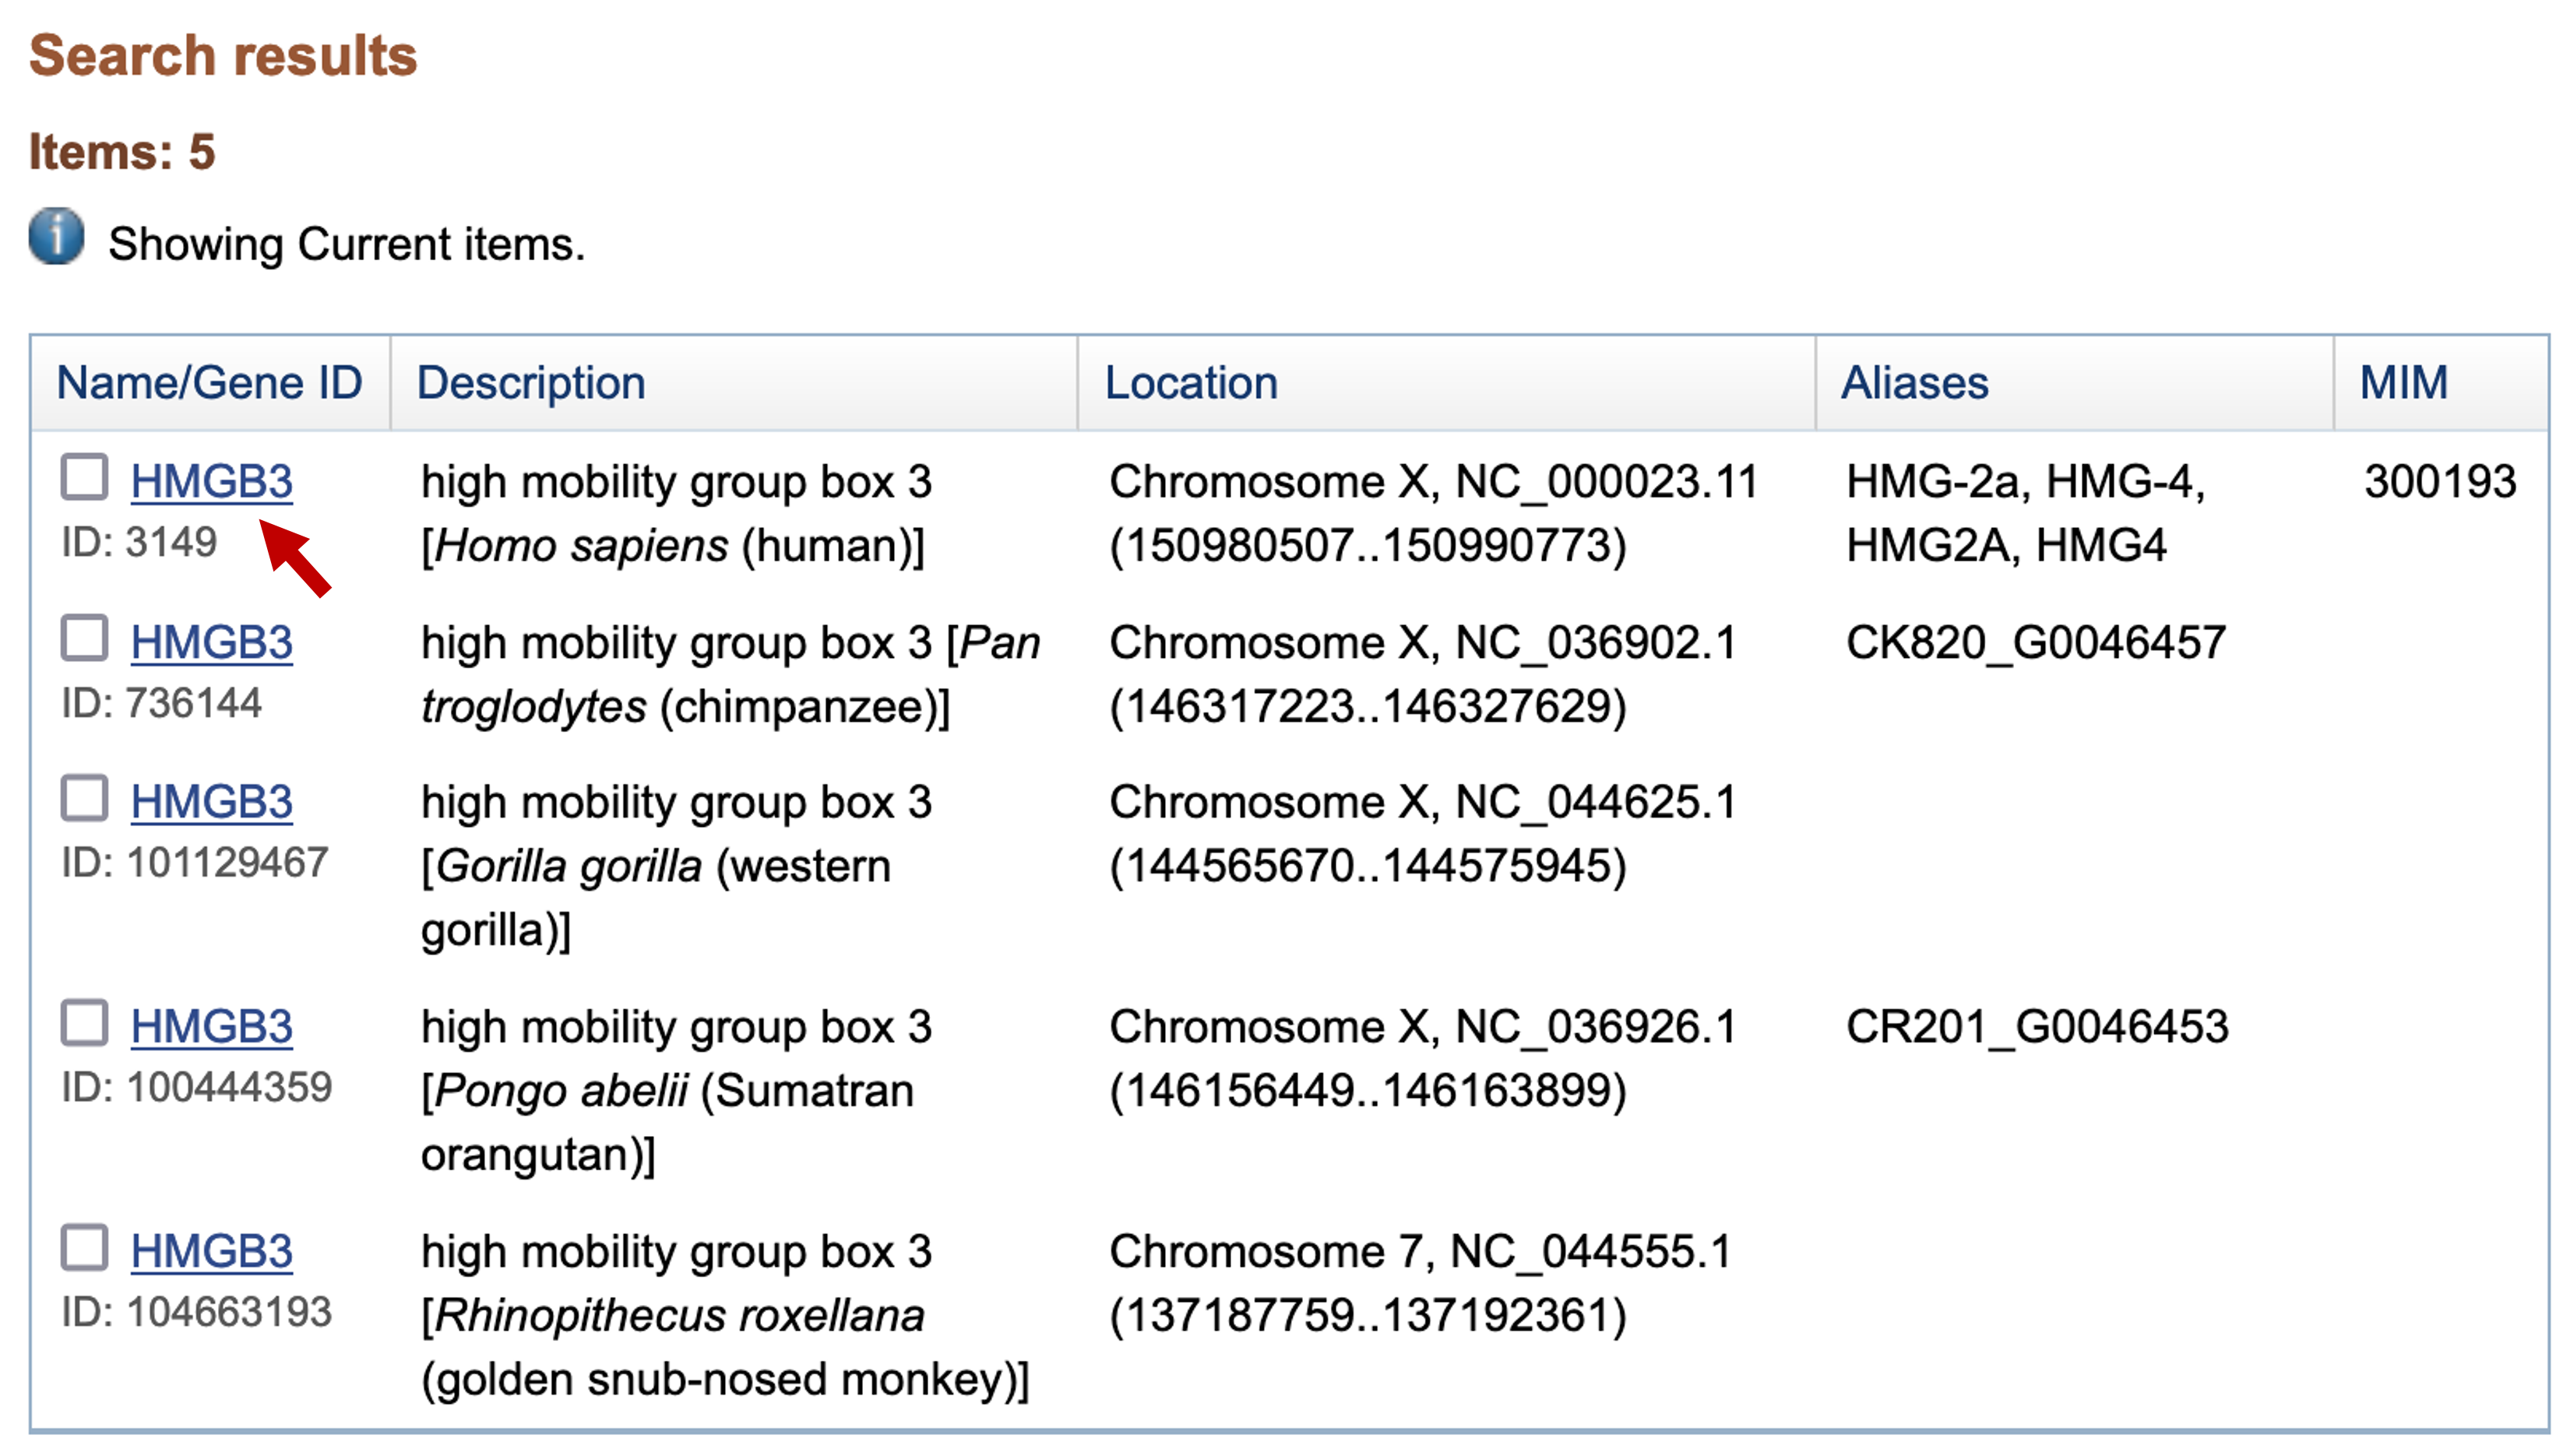
Go back to the BLAST output. Click on the "Gene" link under the "Related Information" section, and then click on the "HMGB3" link next to the entry with the description "high mobility group box 3 [Homo sapiens (human)]" to access this Entrez gene record (Figure 10).
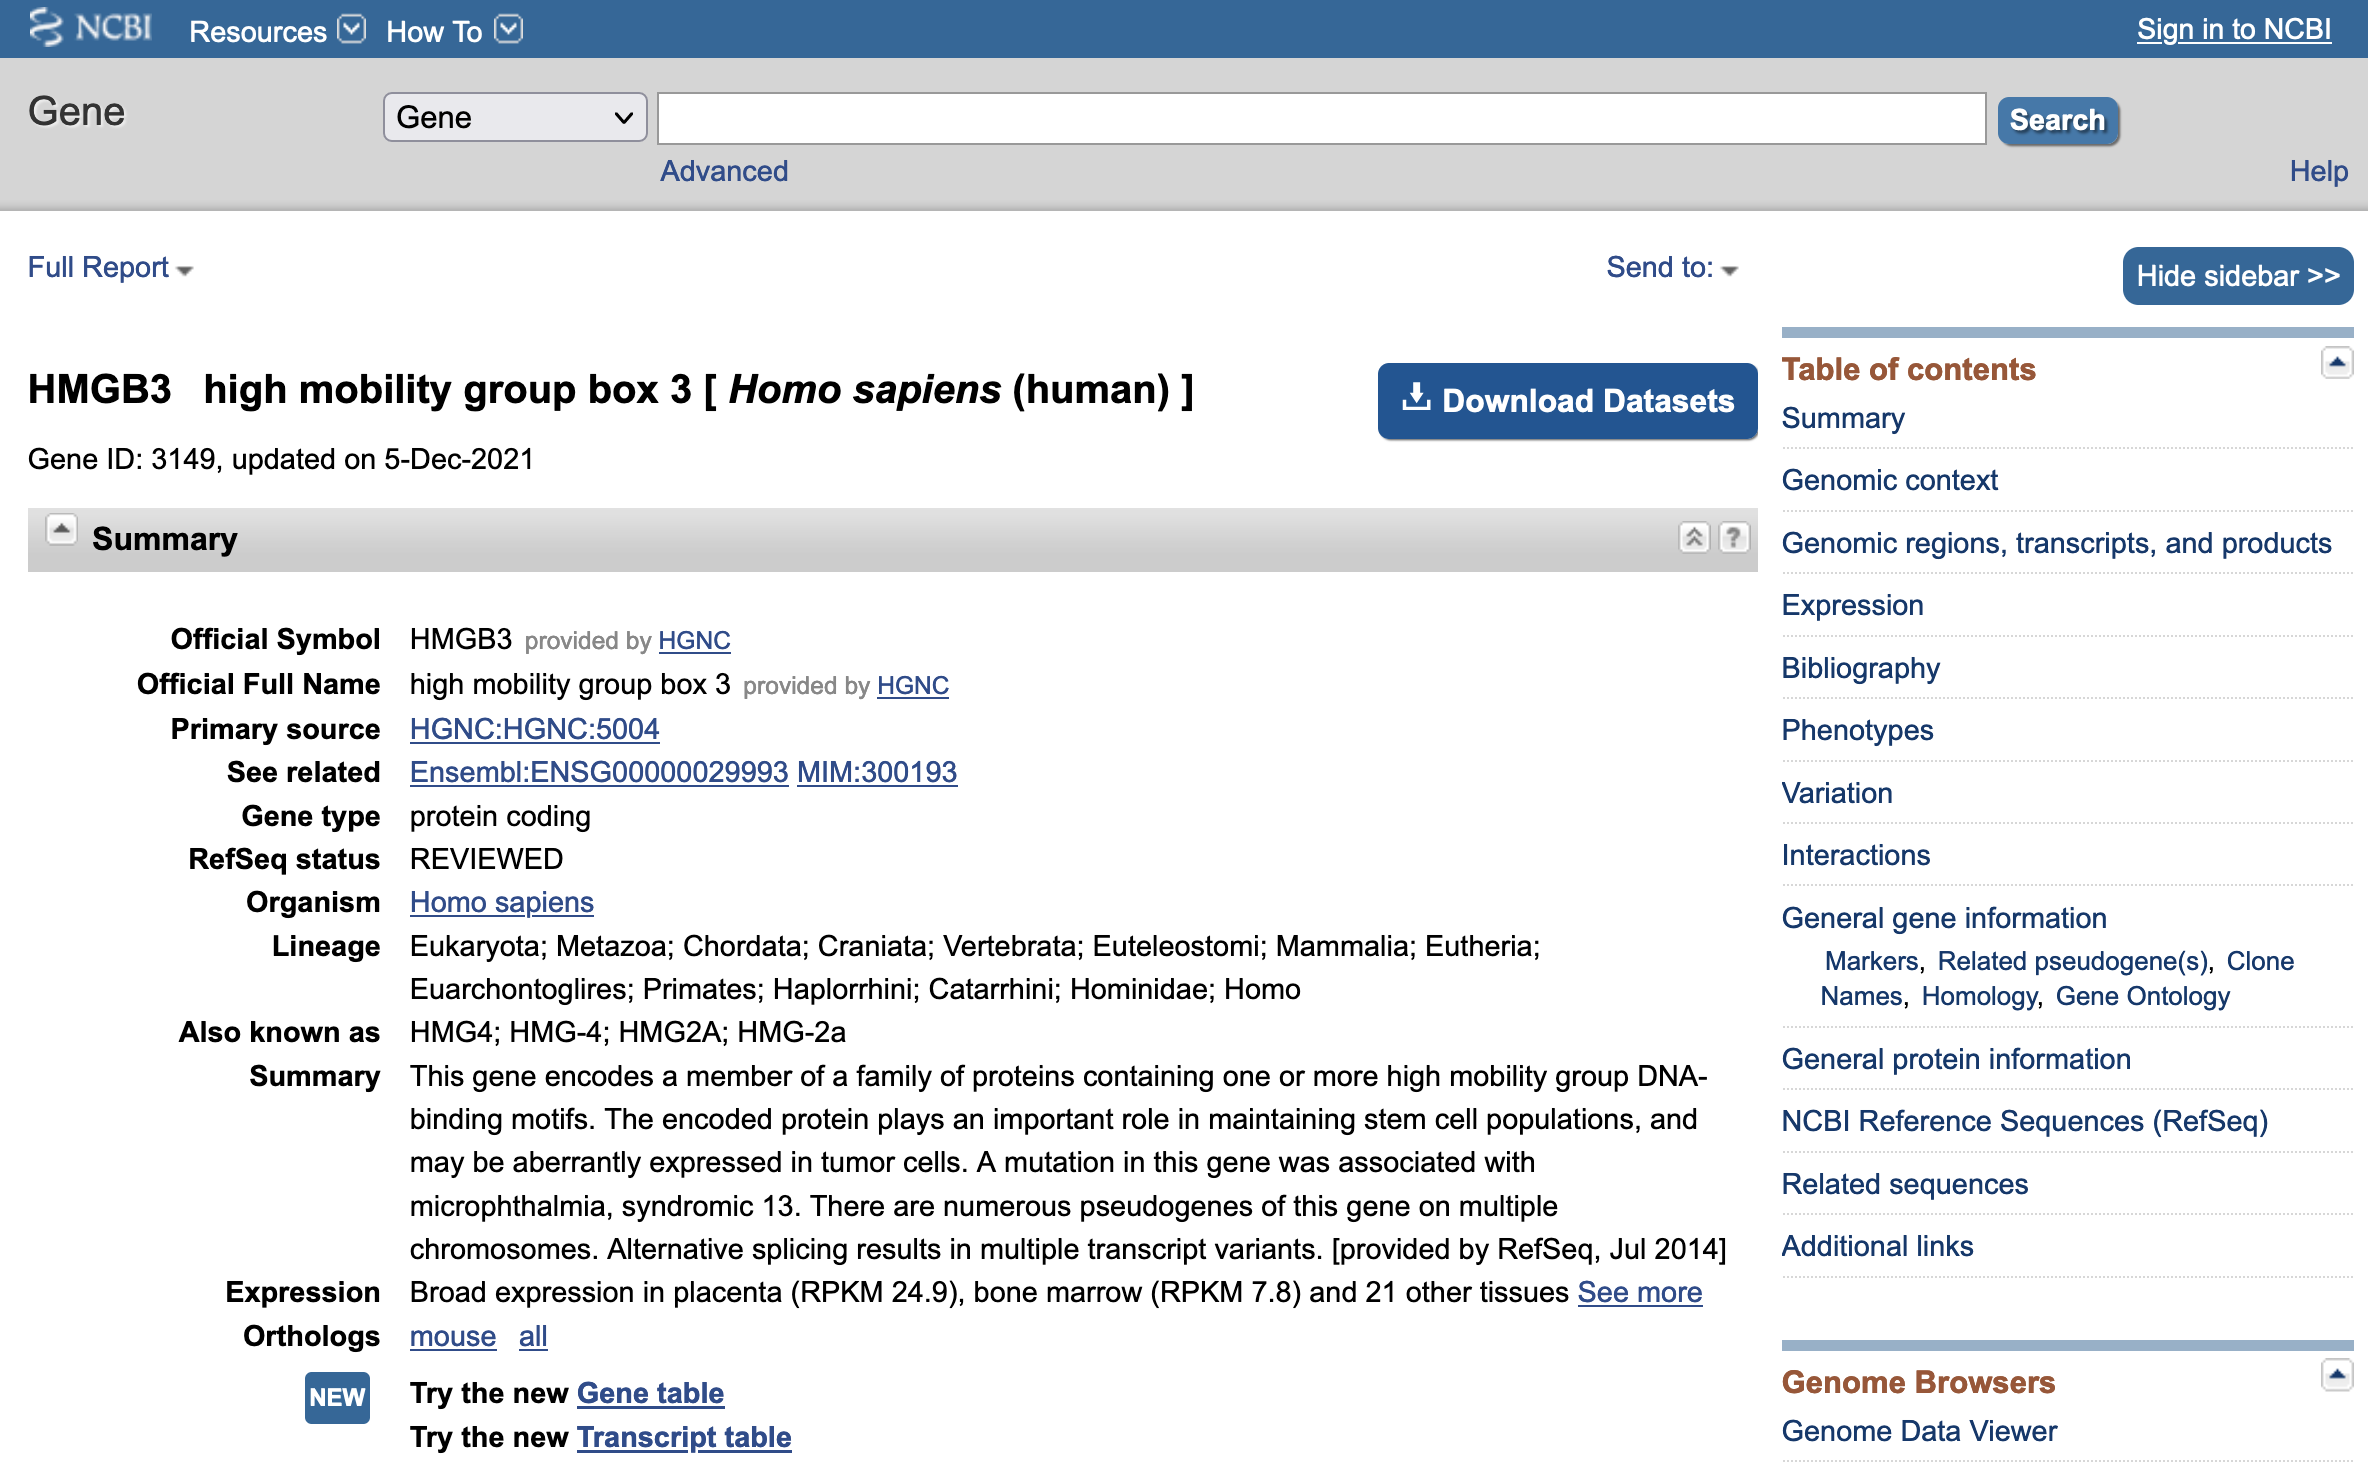
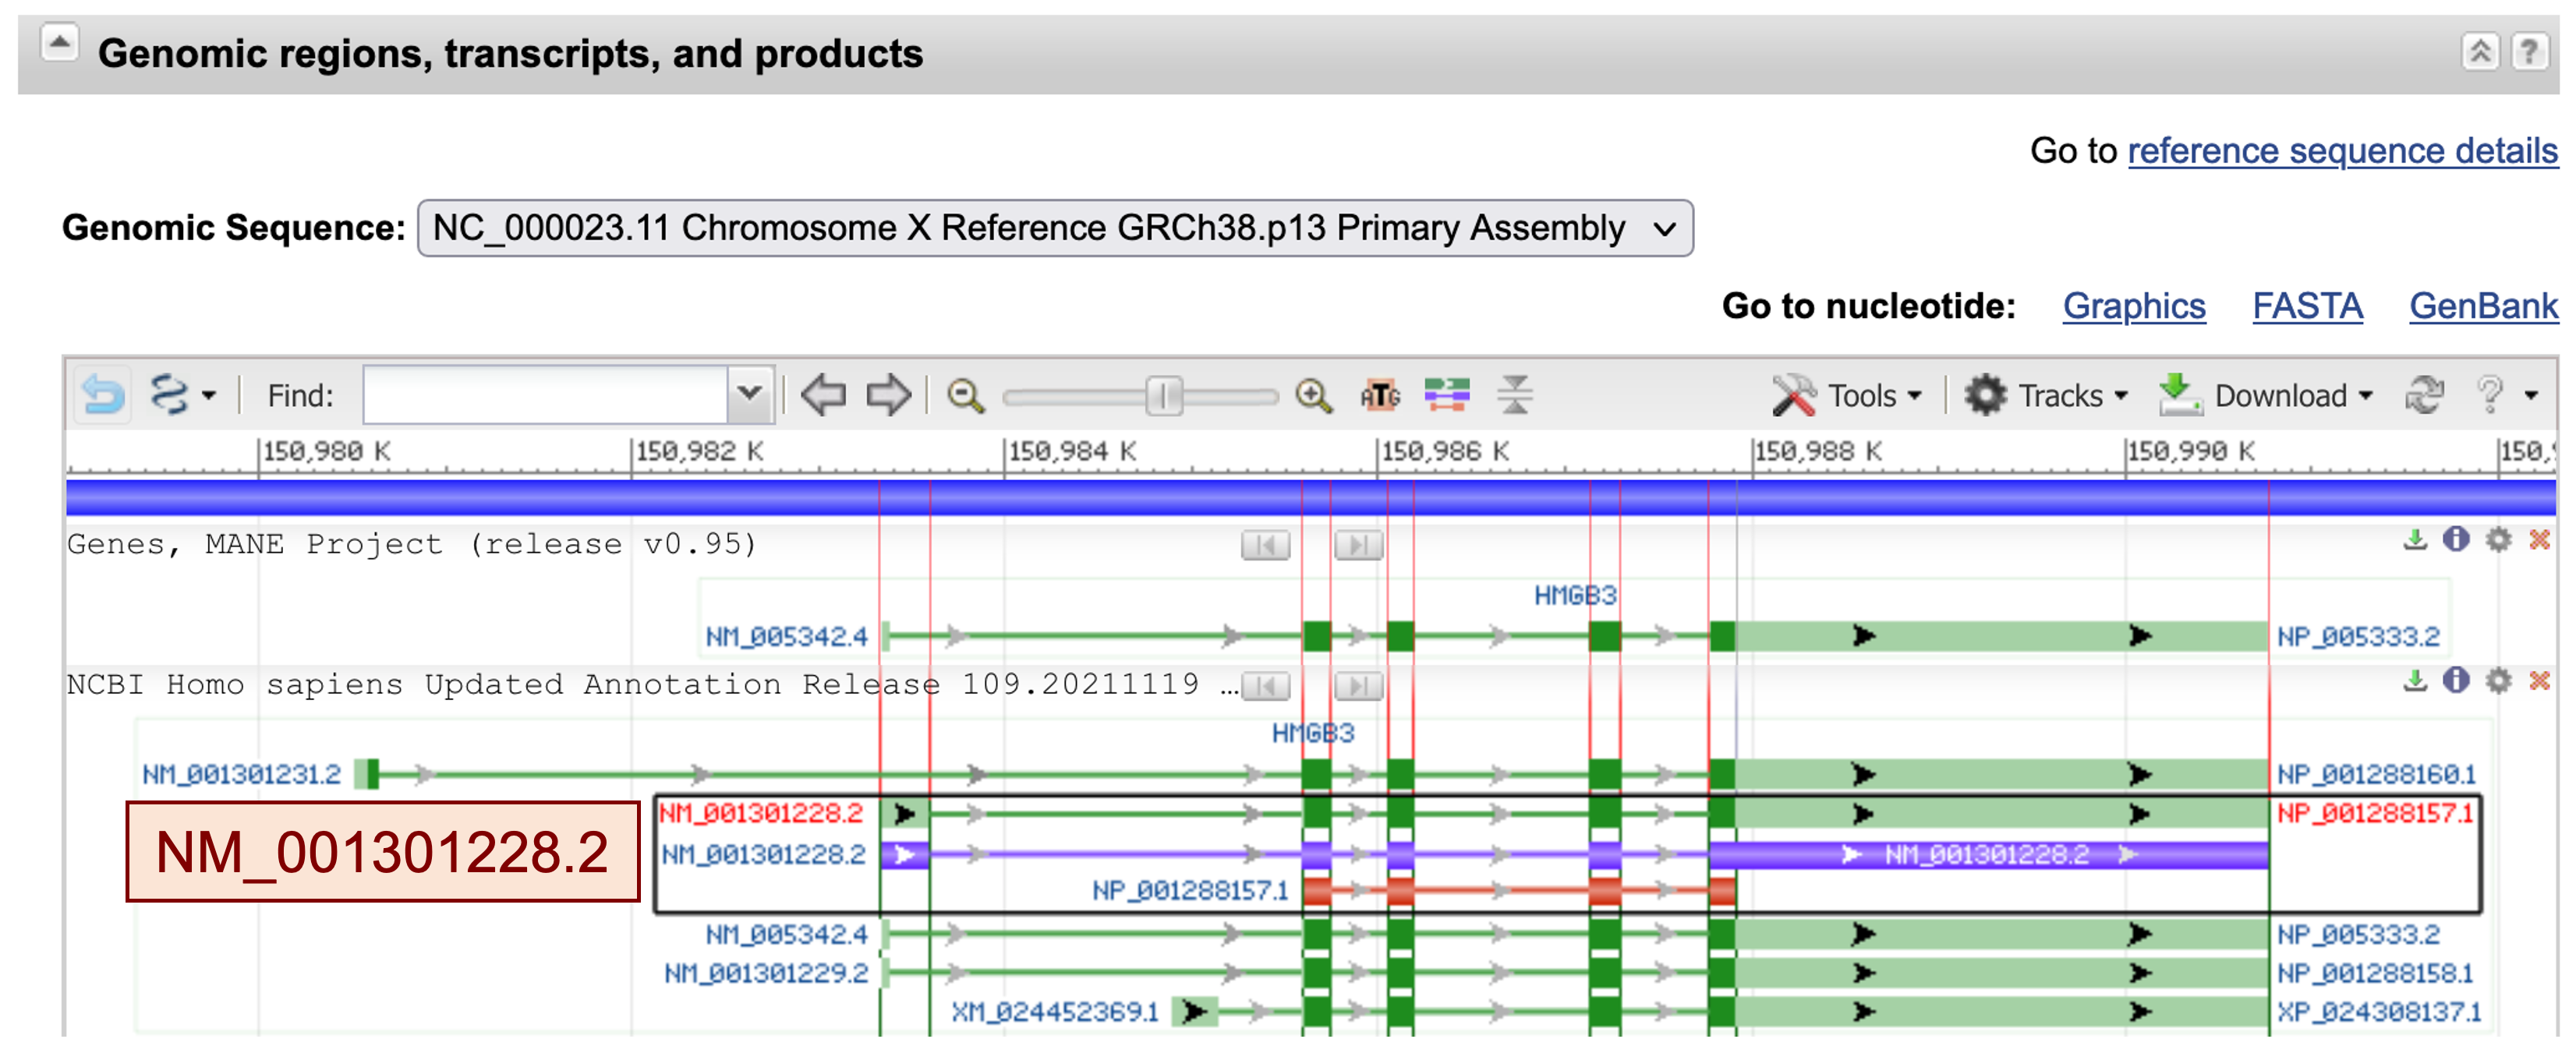
The "Also known as" field of this Entrez Gene record shows that the other names that have been used to describe the human HMGB3 protein include "HMG4" and "HMG2A". In the "Genomic context" section, we learn that the protein is located on the X chromosome at locus Xq28 (Figure 11). We can obtain a more detailed graphical overview of the region surrounding the HMGB3 protein by clicking on the "Genome Data Viewer" link at the top right corner of this section.
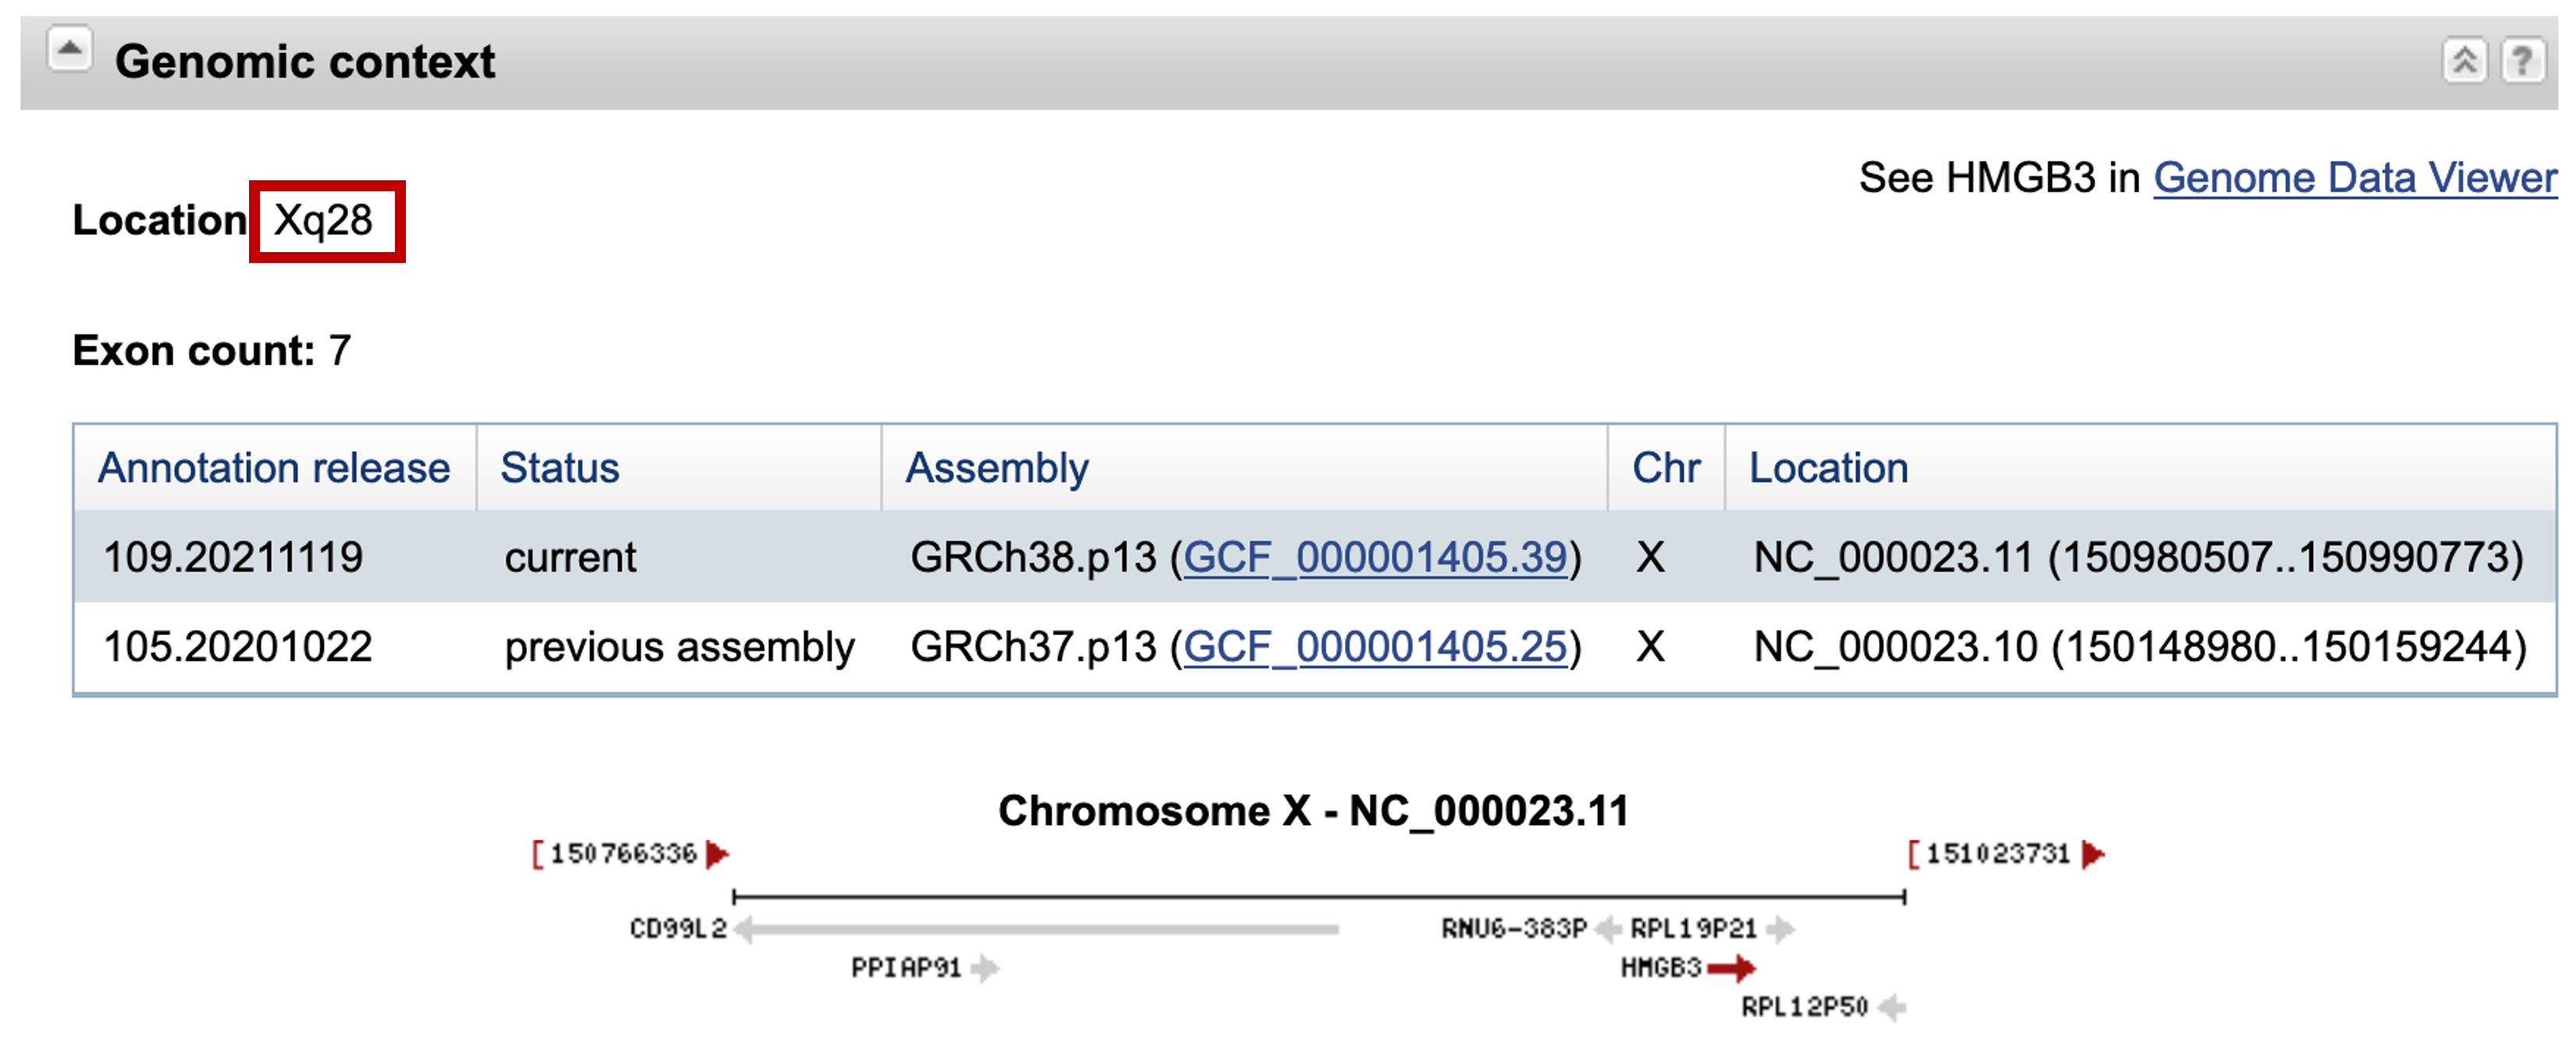
We can find information on all known and predicted transcripts for this gene in the "Genomic regions, transcripts, and products" section. The "NCBI Homo sapiens Annotation Release 109.20211119" evidence track shows that the HMGB3 gene has five known transcripts (NM_001301231.2, NM_001301228.2, NM_005342.4, NM_001301229.2, and XM_024452369.1). We also discover that HMGB3 is a multi-exon gene in human (Figure 12).
To summarize our findings so far, we have learned that our predicted protein shows strong sequence similarity to the human HMGB3 protein but it is truncated relative to that protein. We need to decide among three possible explanations for the truncation: (1) GENSCAN has failed to accurately predict the gene, (2) the predicted gene is a pseudogene, or (3) the predicted gene may produce a functional product that lacks part of the human protein. To determine which of these hypotheses is correct, we need to gather additional evidence using the UCSC Genome Browser.
UCSC Genome Browser analysis of the GENSCAN prediction
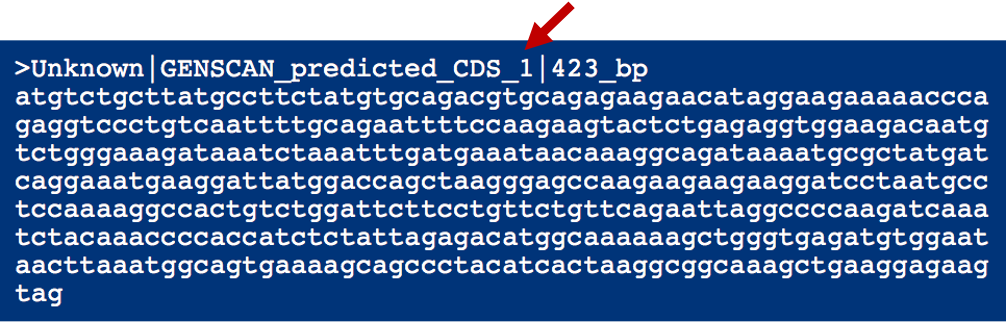
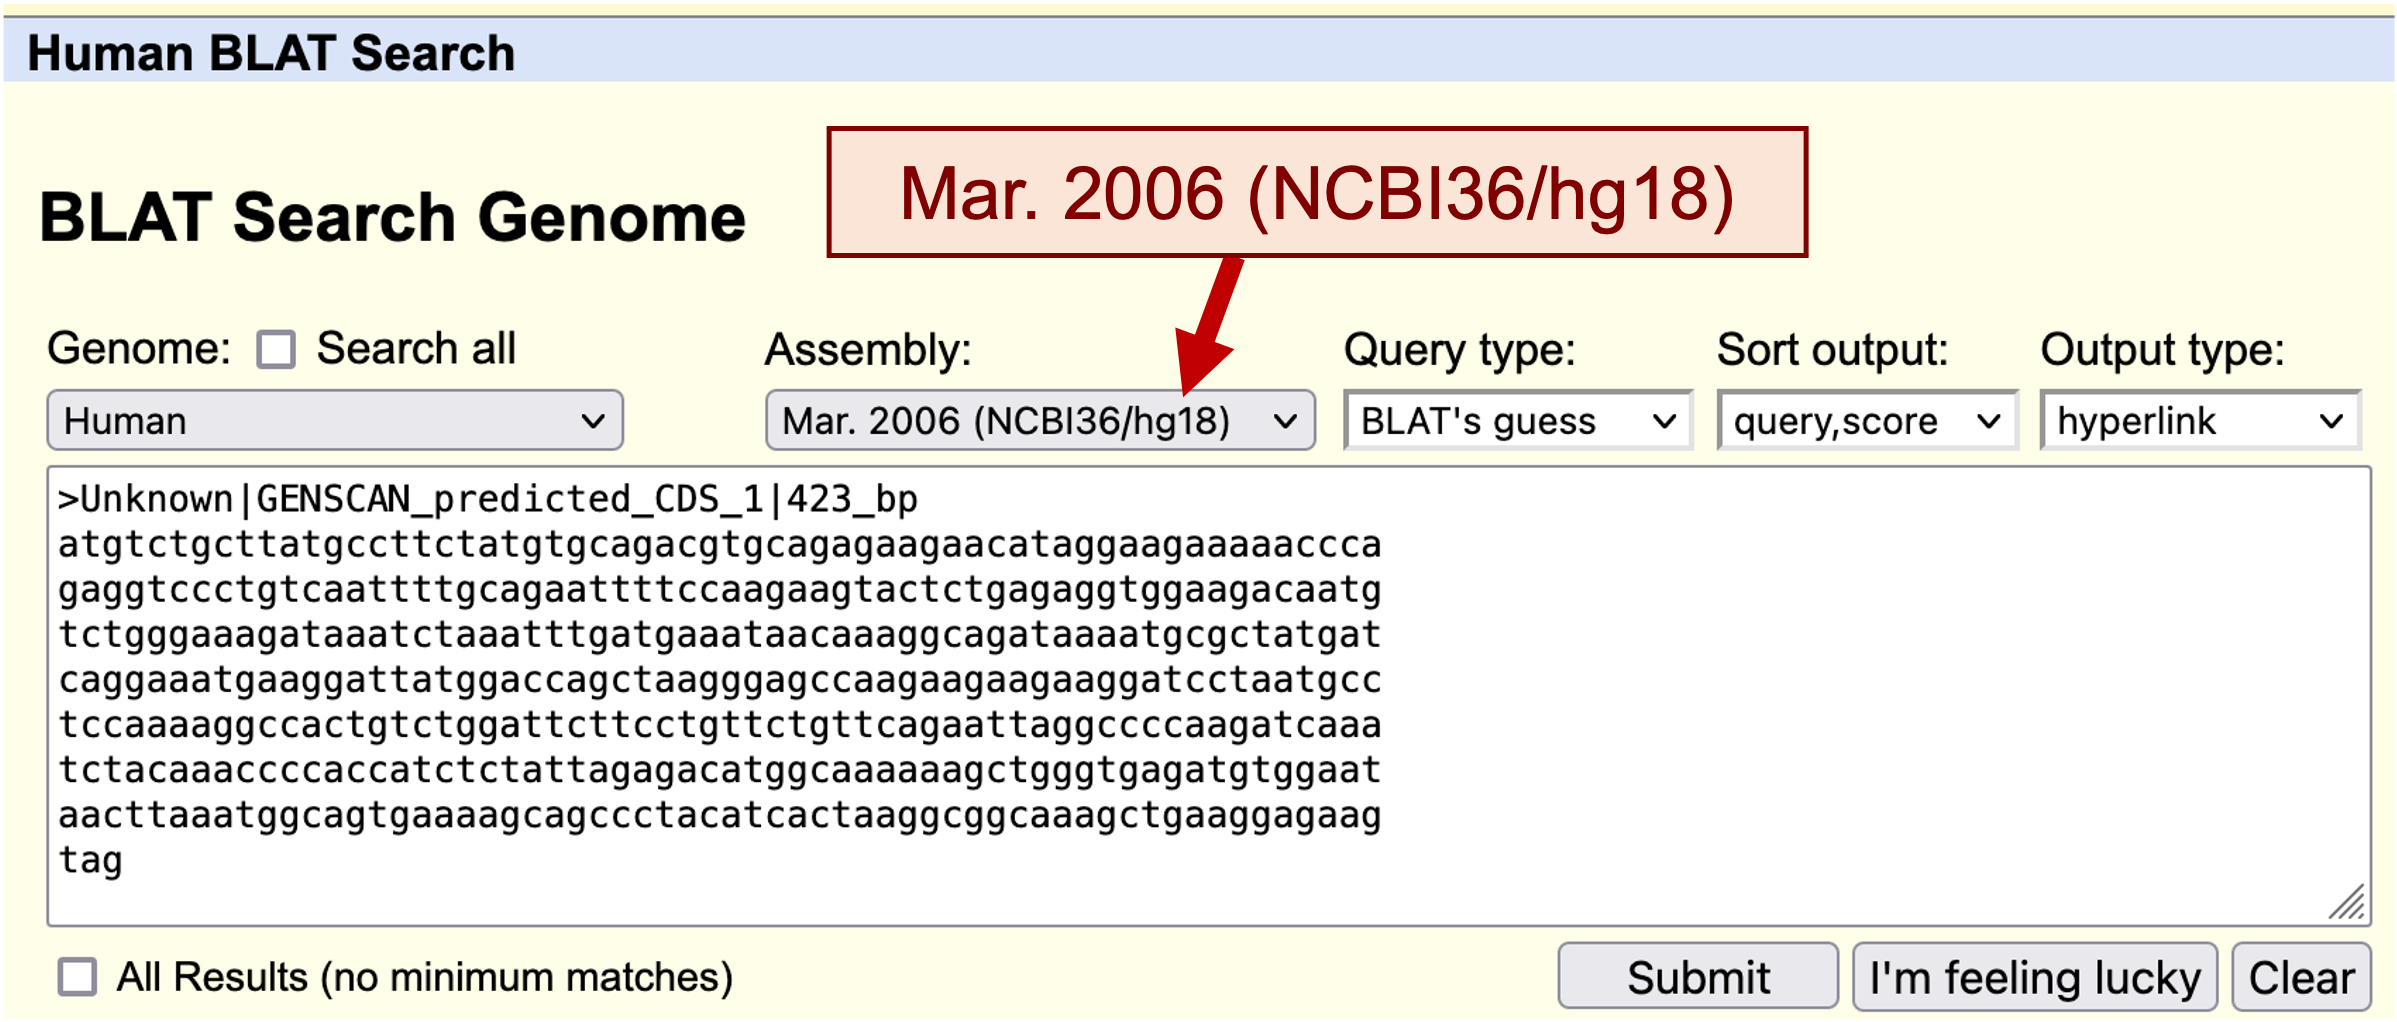
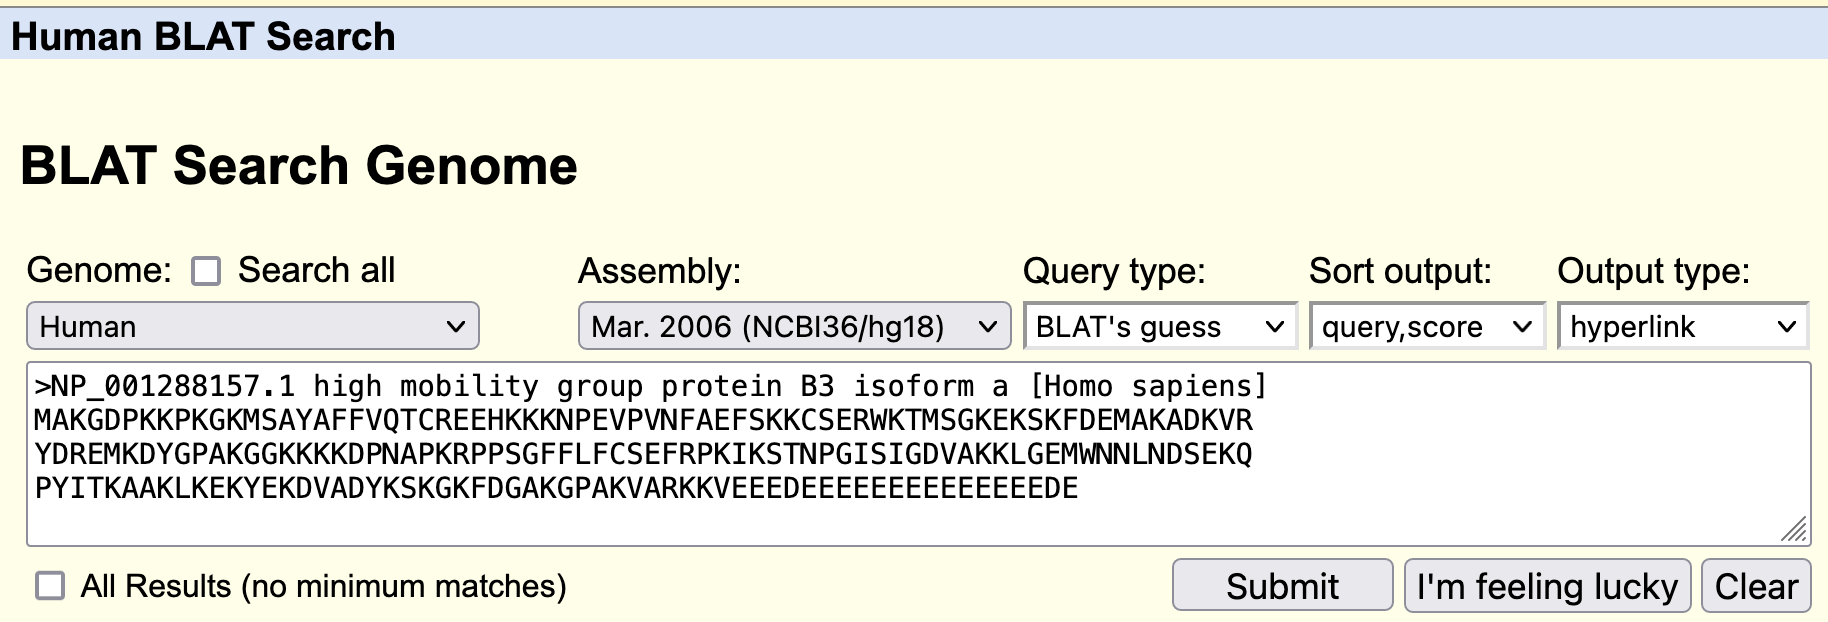
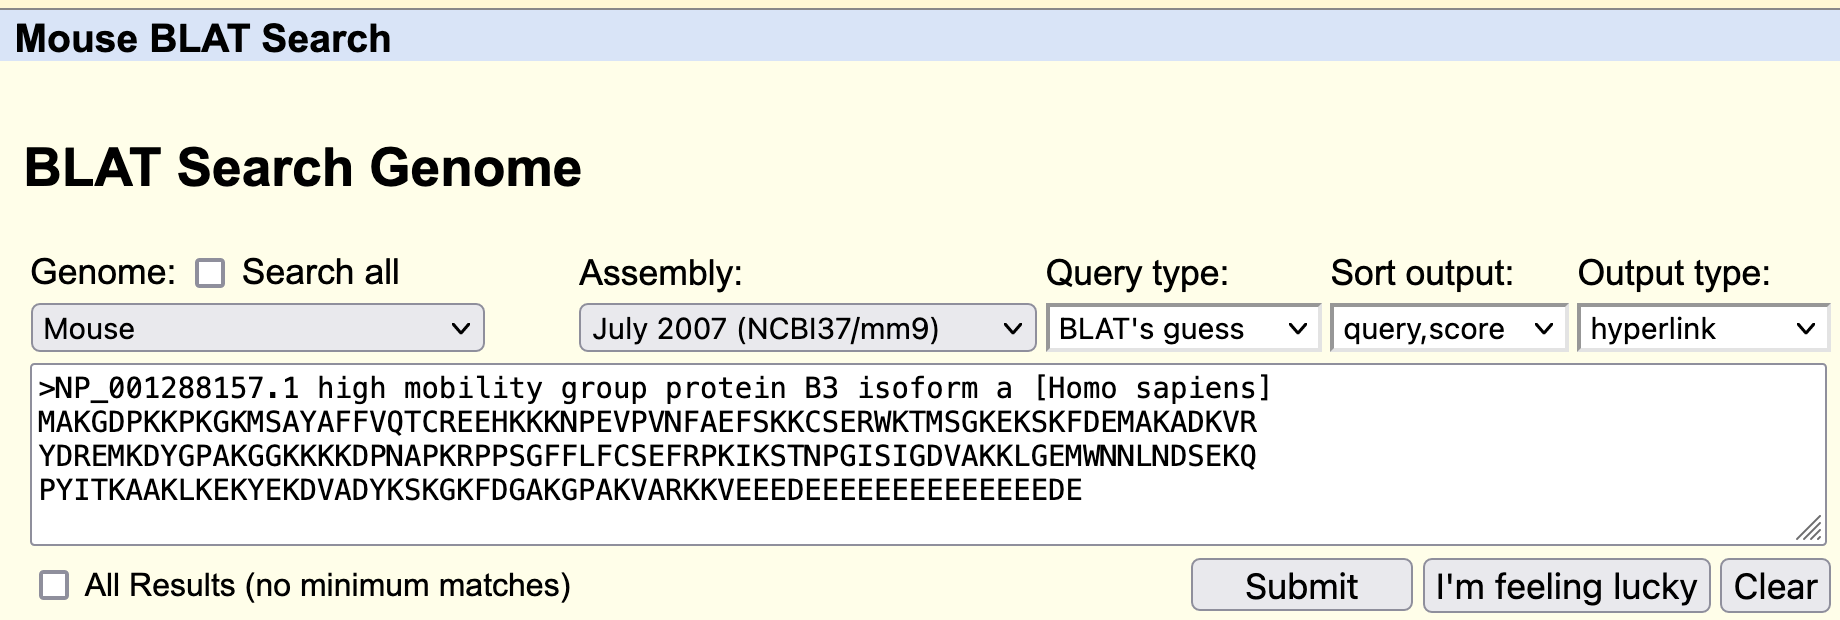
Go back to the GENSCAN output page. Copy the first predicted coding (CDS) sequence (Figure 13) and go to the UCSC Genome Browser. Click on the "BLAT" link under "Our tools" and then select the "Human" genome and the "Mar. 2006 (NCBI36/hg18)" assembly. Paste the predicted sequence into the textbox and click "Submit" (Figure 14).
The predicted sequence matches many loci in the human genome (Figure 15), which is not surprising because it contains a conserved domain. The top hit shows an identity of 99.1% to the human genomic sequence over the length of the entire query (423bp). This is within the range of percent identity we would expect for a pair of human and chimp orthologs. The next best match has an identity of only 93.6%, which is substantially below what we expect for human and chimp orthologs. (Coding regions of chimp and human are approximately 98% identical on average.)
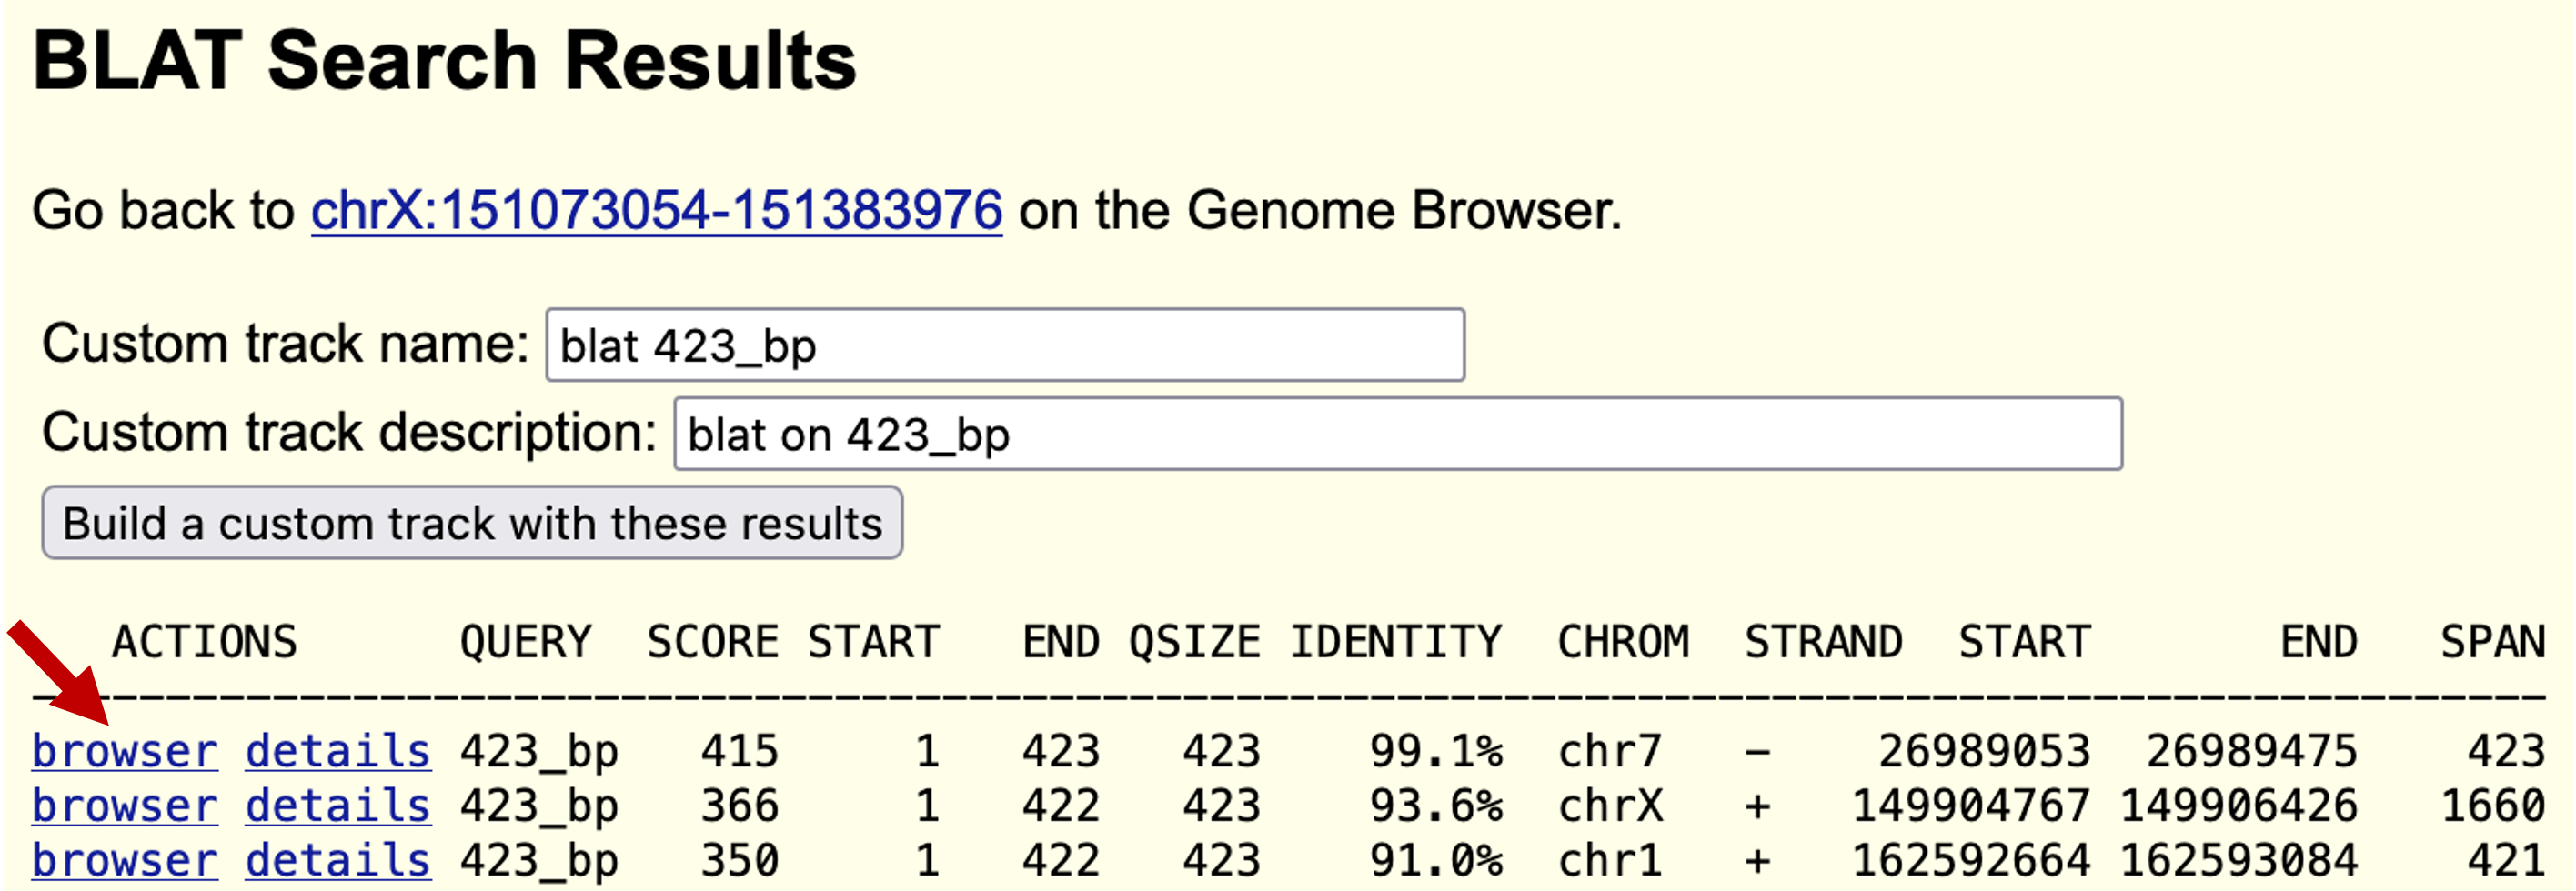
Click on the "browser" link next to the alignment with the best score (on chromosome 7), and the next screen will show your sequence as a black bar under the title "Your Sequence from Blat Search". You can change the display options by clicking on the "configure" button. (Please see the UCSC Genome Browser User Guide for additional information.)
Reset the display settings for the genome browser by clicking on the "hide all" button. Expand the "Mapping and Sequencing Tracks" section by clicking on the "+" sign and then configure the tracks to use the following options:
Adjust the following track to "pack" mode:
-
Under "Mapping and Sequencing": Blat Sequence
Adjust the following tracks to "dense" mode:
-
Under "Gene and Gene Predictions": UCSC Genes, RefSeq Genes, Ensembl Genes, Genscan Genes, N-SCAN, SGP Genes (Figure 16).
-
Under "mRNA and EST": Human mRNAs, Spliced ESTs, Human ESTs, Other ESTs.
-
Under "Comparative Genomics": Mouse Chain/Net.
-
Under "Variations and Repeats": RepeatMasker.
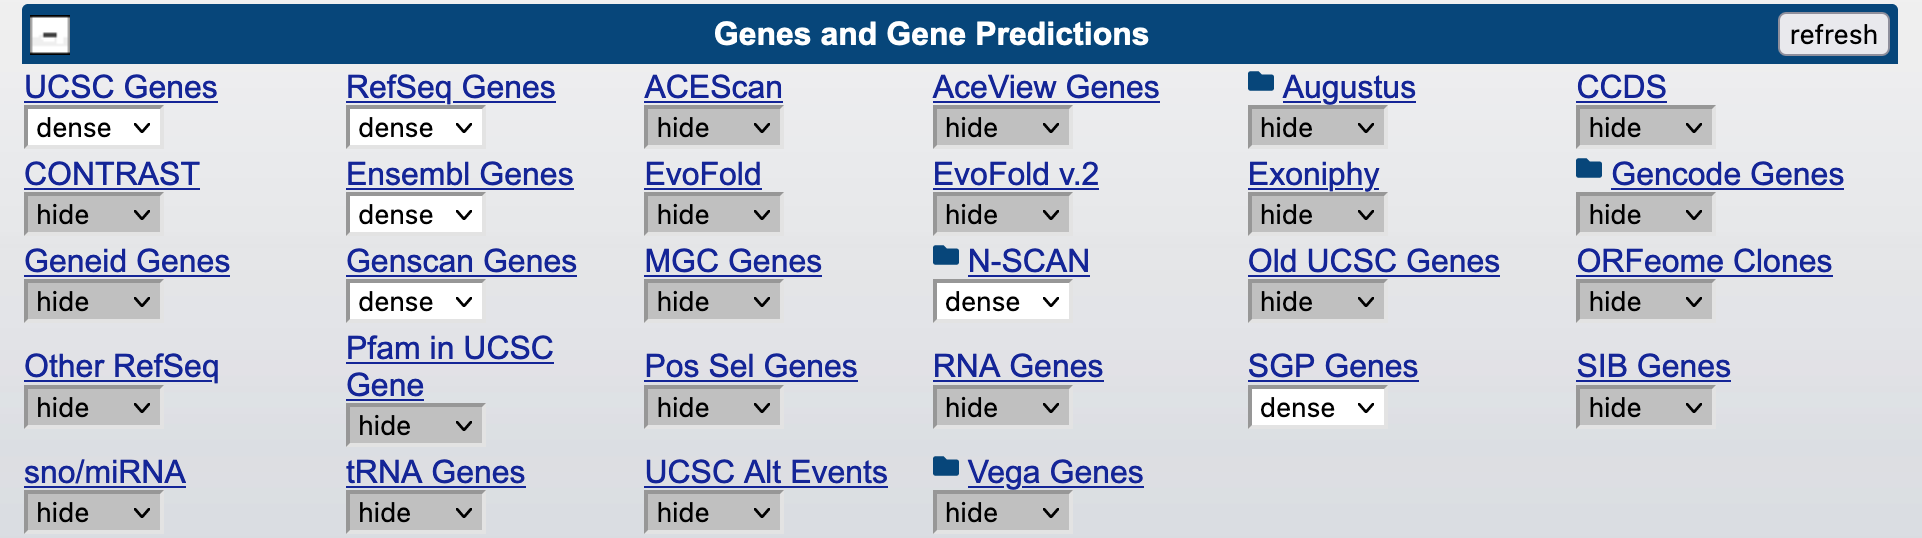
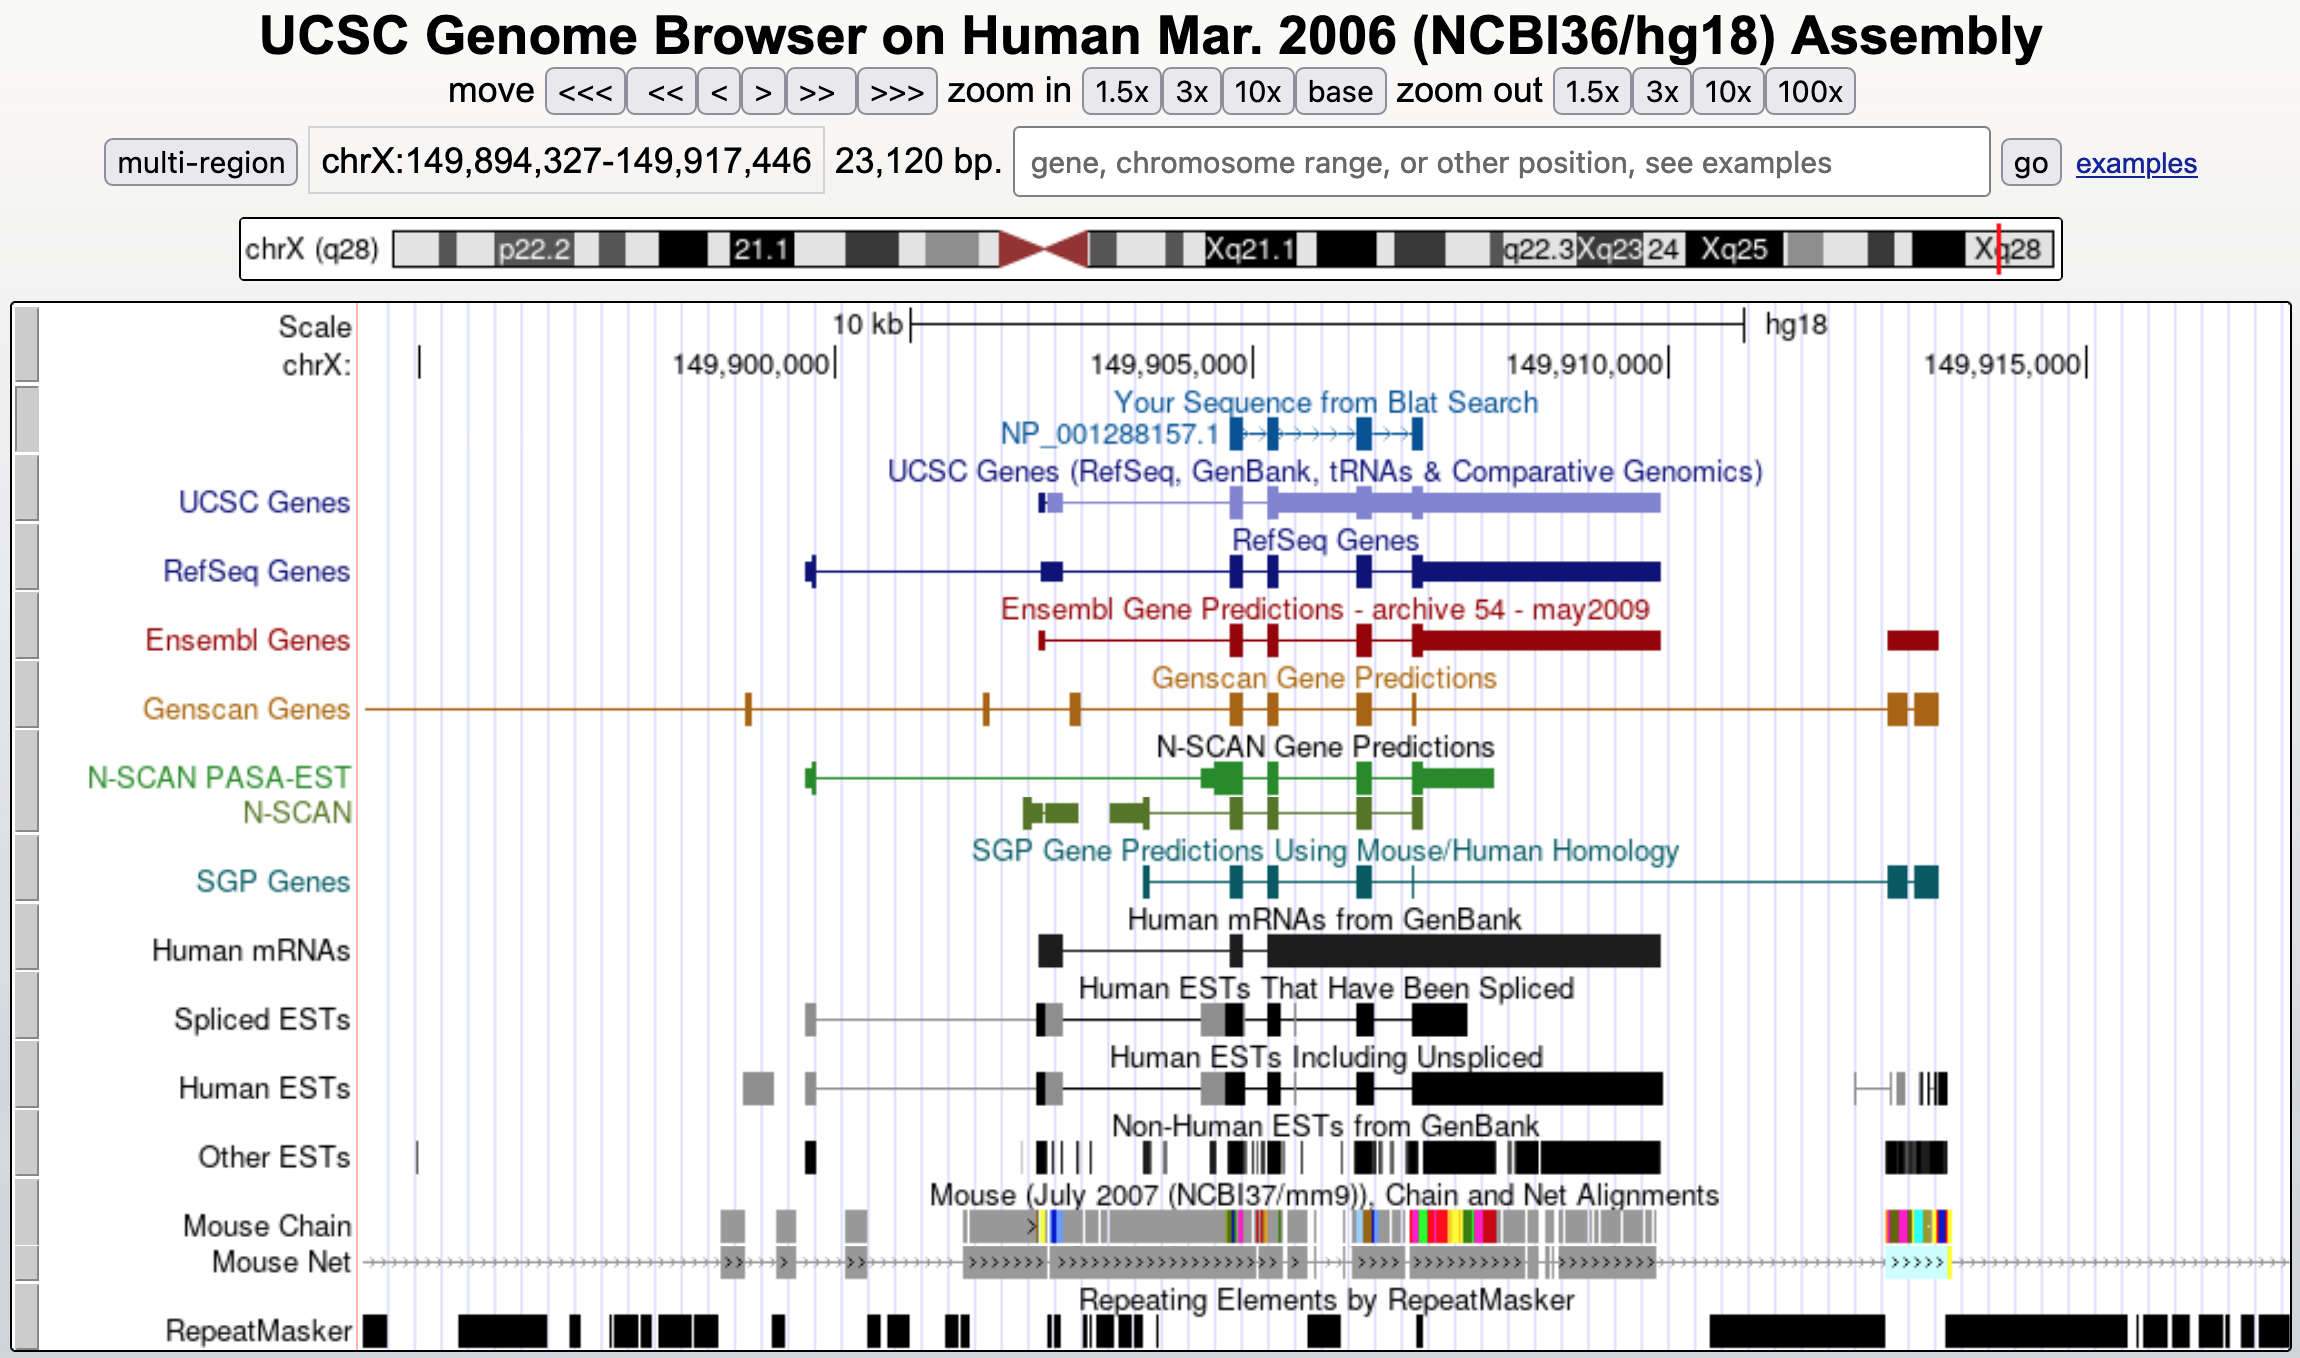
Hit "refresh" and then zoom out 3X to get a broader view of this region (Figure 17).
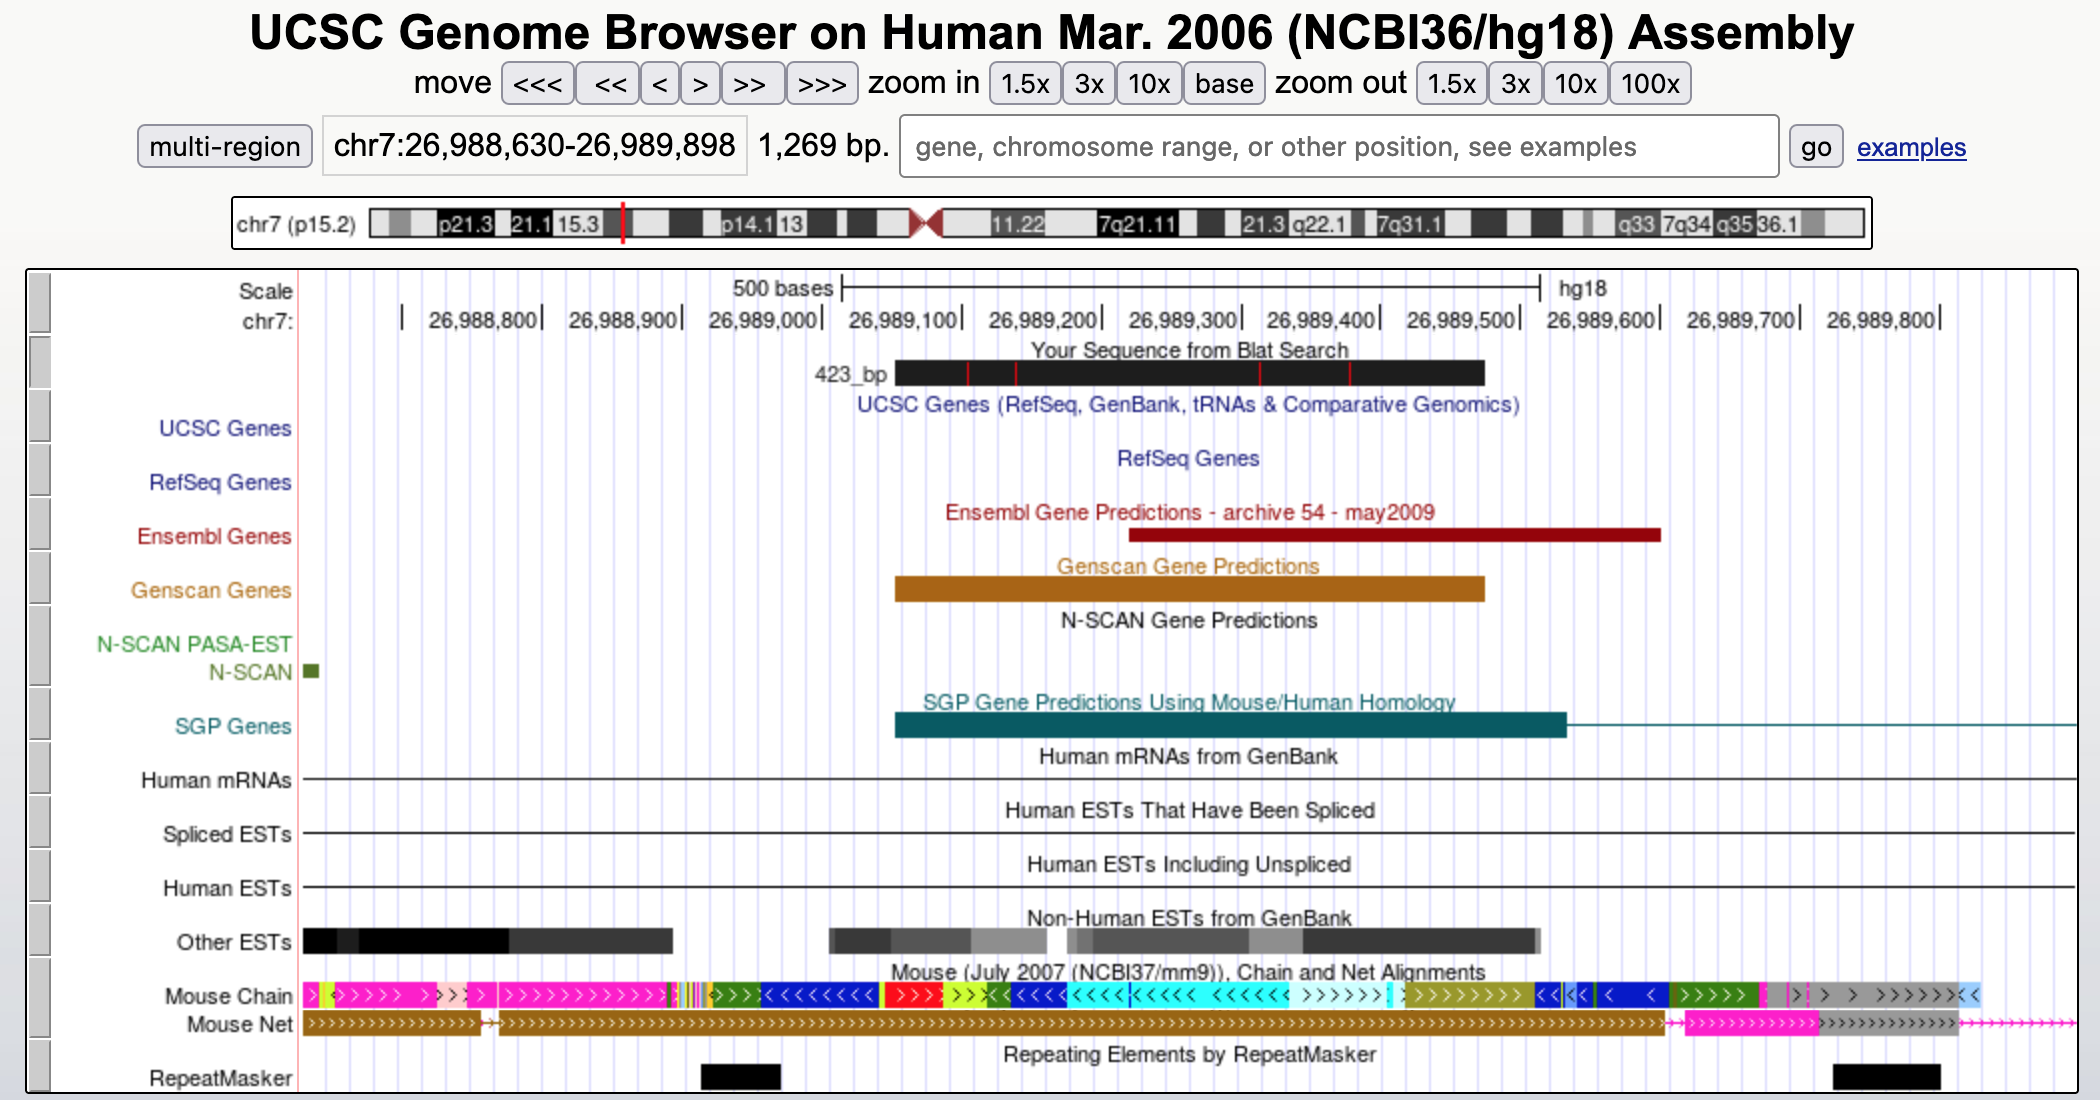
According to RefSeq and other curated gene lists, there are no known genes in this region. The only evidence we have for our prediction comes from hypothetical genes predicted by programs like SGP and GENSCAN. Interestingly, N-SCAN (another gene prediction program) did not predict a gene in this region. SGP, which tends to fuse multiple genes into a single feature, predicts that our putative gene is in fact part of a larger gene with two exons. (This hypothesis is plausible because the GENSCAN prediction is shorter than the matches to known proteins.)
There are no human ESTs or spliced ESTs that aligned to this region. The lack of spliced human ESTs is consistent with our prediction of a single-exon gene. There are also ESTs from other organisms, which are generally a more reliable guide to the presence of a real gene than unspliced human ESTs.
To see the EST evidence in more detail, change the "Other ESTs" track to "pack" mode and then click on the "refresh" button (Figure 18).
The expanded "Other ESTs" track shows that there are many ESTs supporting this predicted gene from species such as Xenopus, mouse, and chicken. The shades of grey for each feature in the "Other ESTs" track correspond to the percent identity of the EST match: the higher the percent identity, the darker the feature. The presence of these ESTs from the other species provides evidence that our prediction might be a real gene. Note that although SGP predicts a two-exon gene (the extra exon is off-screen to the right of Figure 18), the EST evidence from other species does not support this gene structure because none of the ESTs matching our prediction also matches the other predicted exon.
Analysis of the missing parts of the HMGB3 protein
To determine why the GENSCAN prediction matches only part of HMGB3, let’s look at the alignment from the BLAT search.
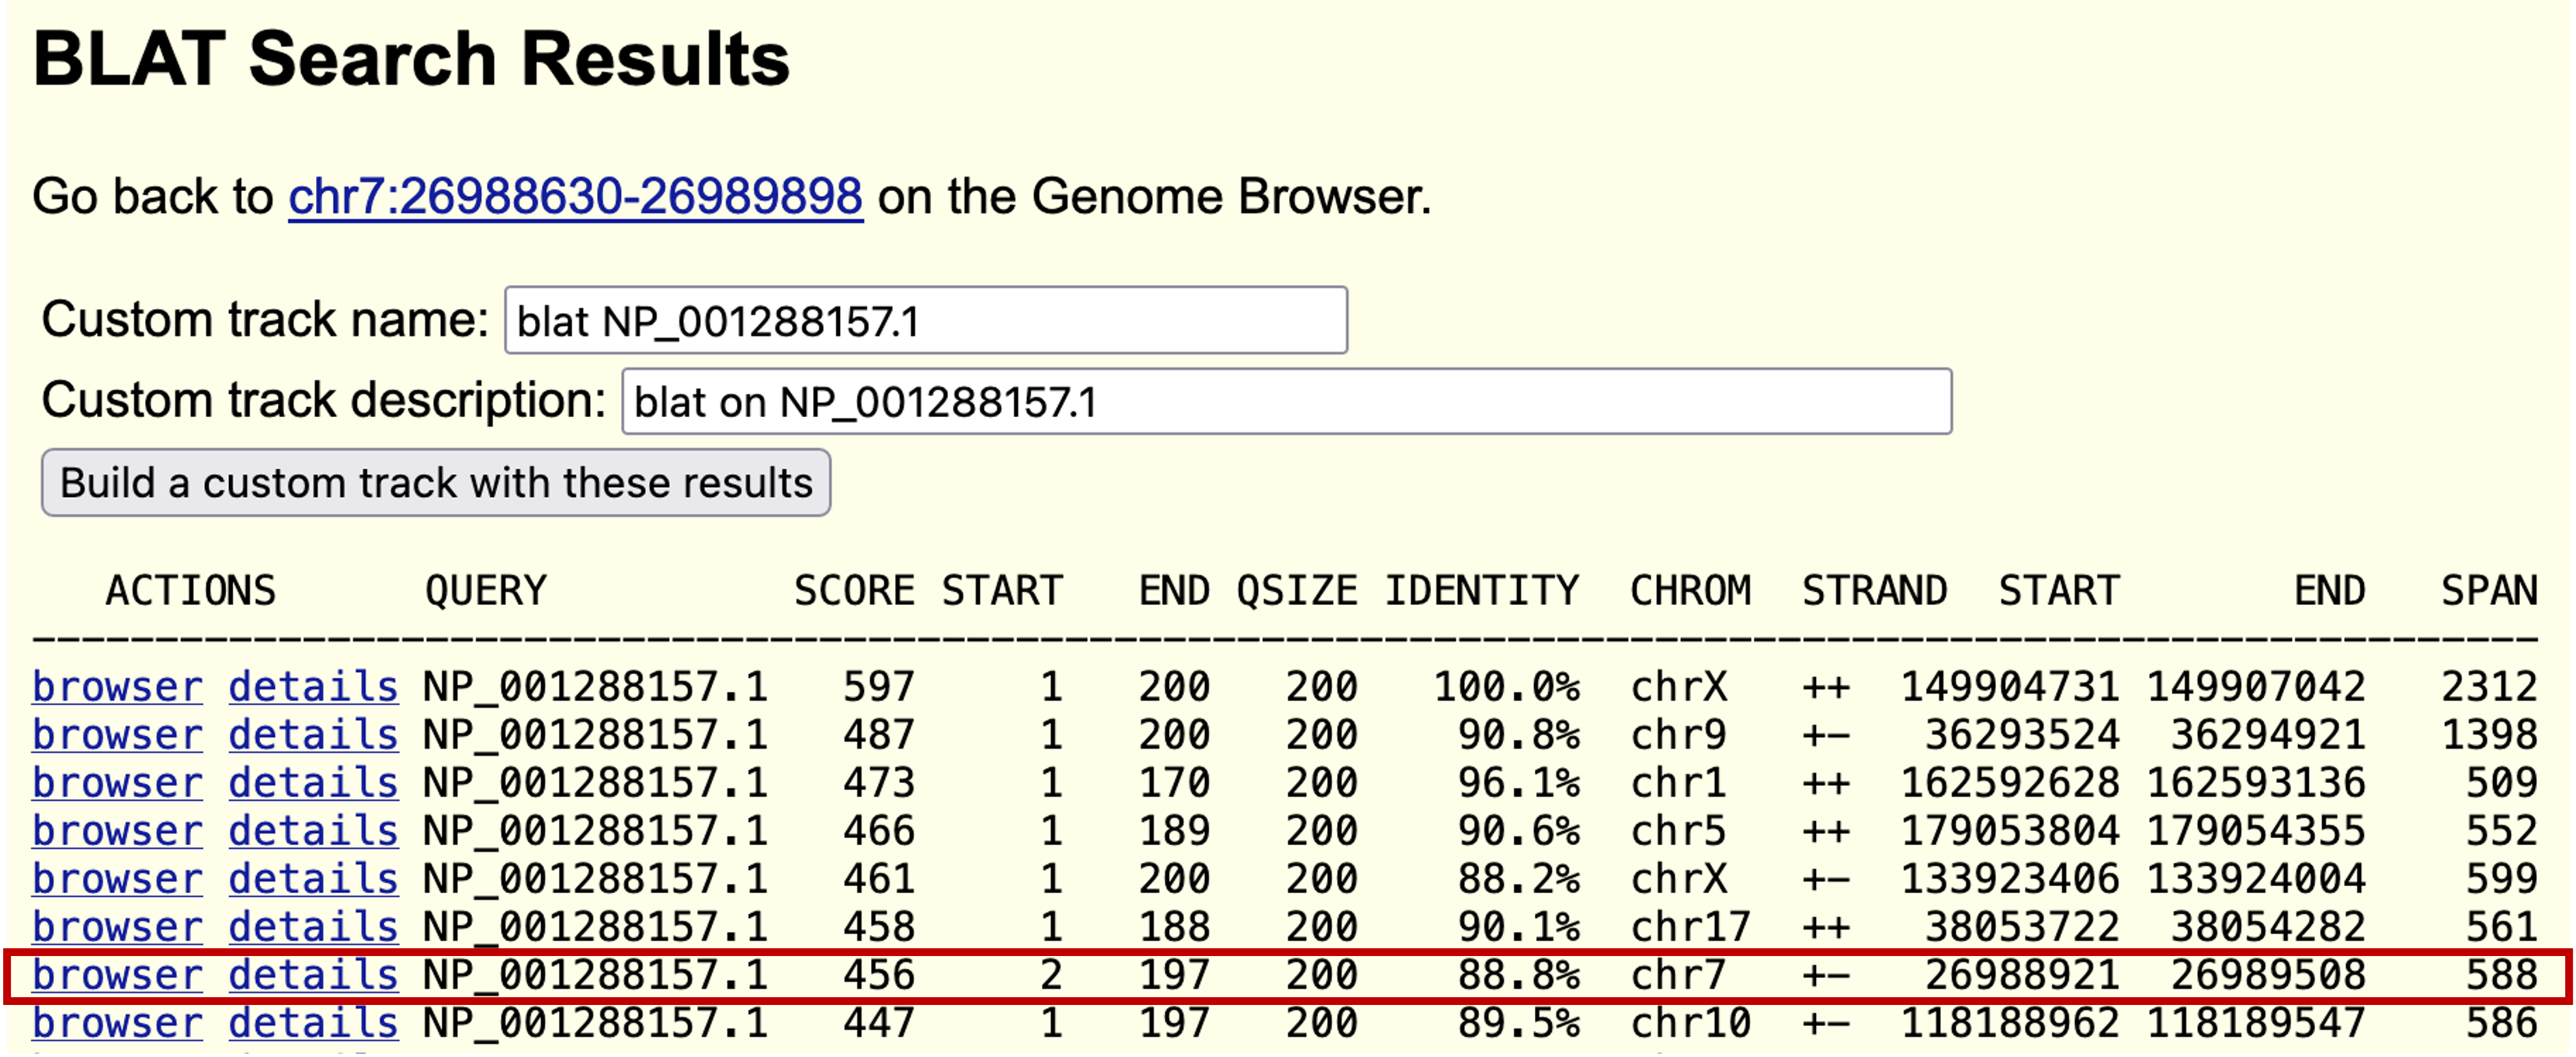
Go to the GenBank record for the human HMGB3 protein. Click on the "FASTA" link under the title of the GenBank record (Figure 19). Copy the sequence to the clipboard. Go back to the BLAT search page (under "Tools") at the UCSC Genome Browser. Paste the sequence into the textbox, and click "Submit" (Figure 20).
First, you should notice that the match to the part of human chromosome 7 we have previously identified is only the 7th best match, with a sequence identity of only 88.8% (Figure 21). We have previously suspected that our predicted protein is a paralog (arise through a duplication event) of HMGB3, so it is not surprising that the best match from human (the likely ortholog) is not in this region. An identity of 88.8% is actually quite good for a paralog.
Click on the "browser" link to see the corresponding region on human chromosome 7 and then zoom out 3x. The match appears as a single block that completely overlaps with the GENSCAN prediction but also extends beyond it in both directions (Figure 22). This evidence suggests that there might be a longer single-exon gene at this locus than the GENSCAN prediction. To understand why GENSCAN would predict a shorter gene, we need to examine the alignment.

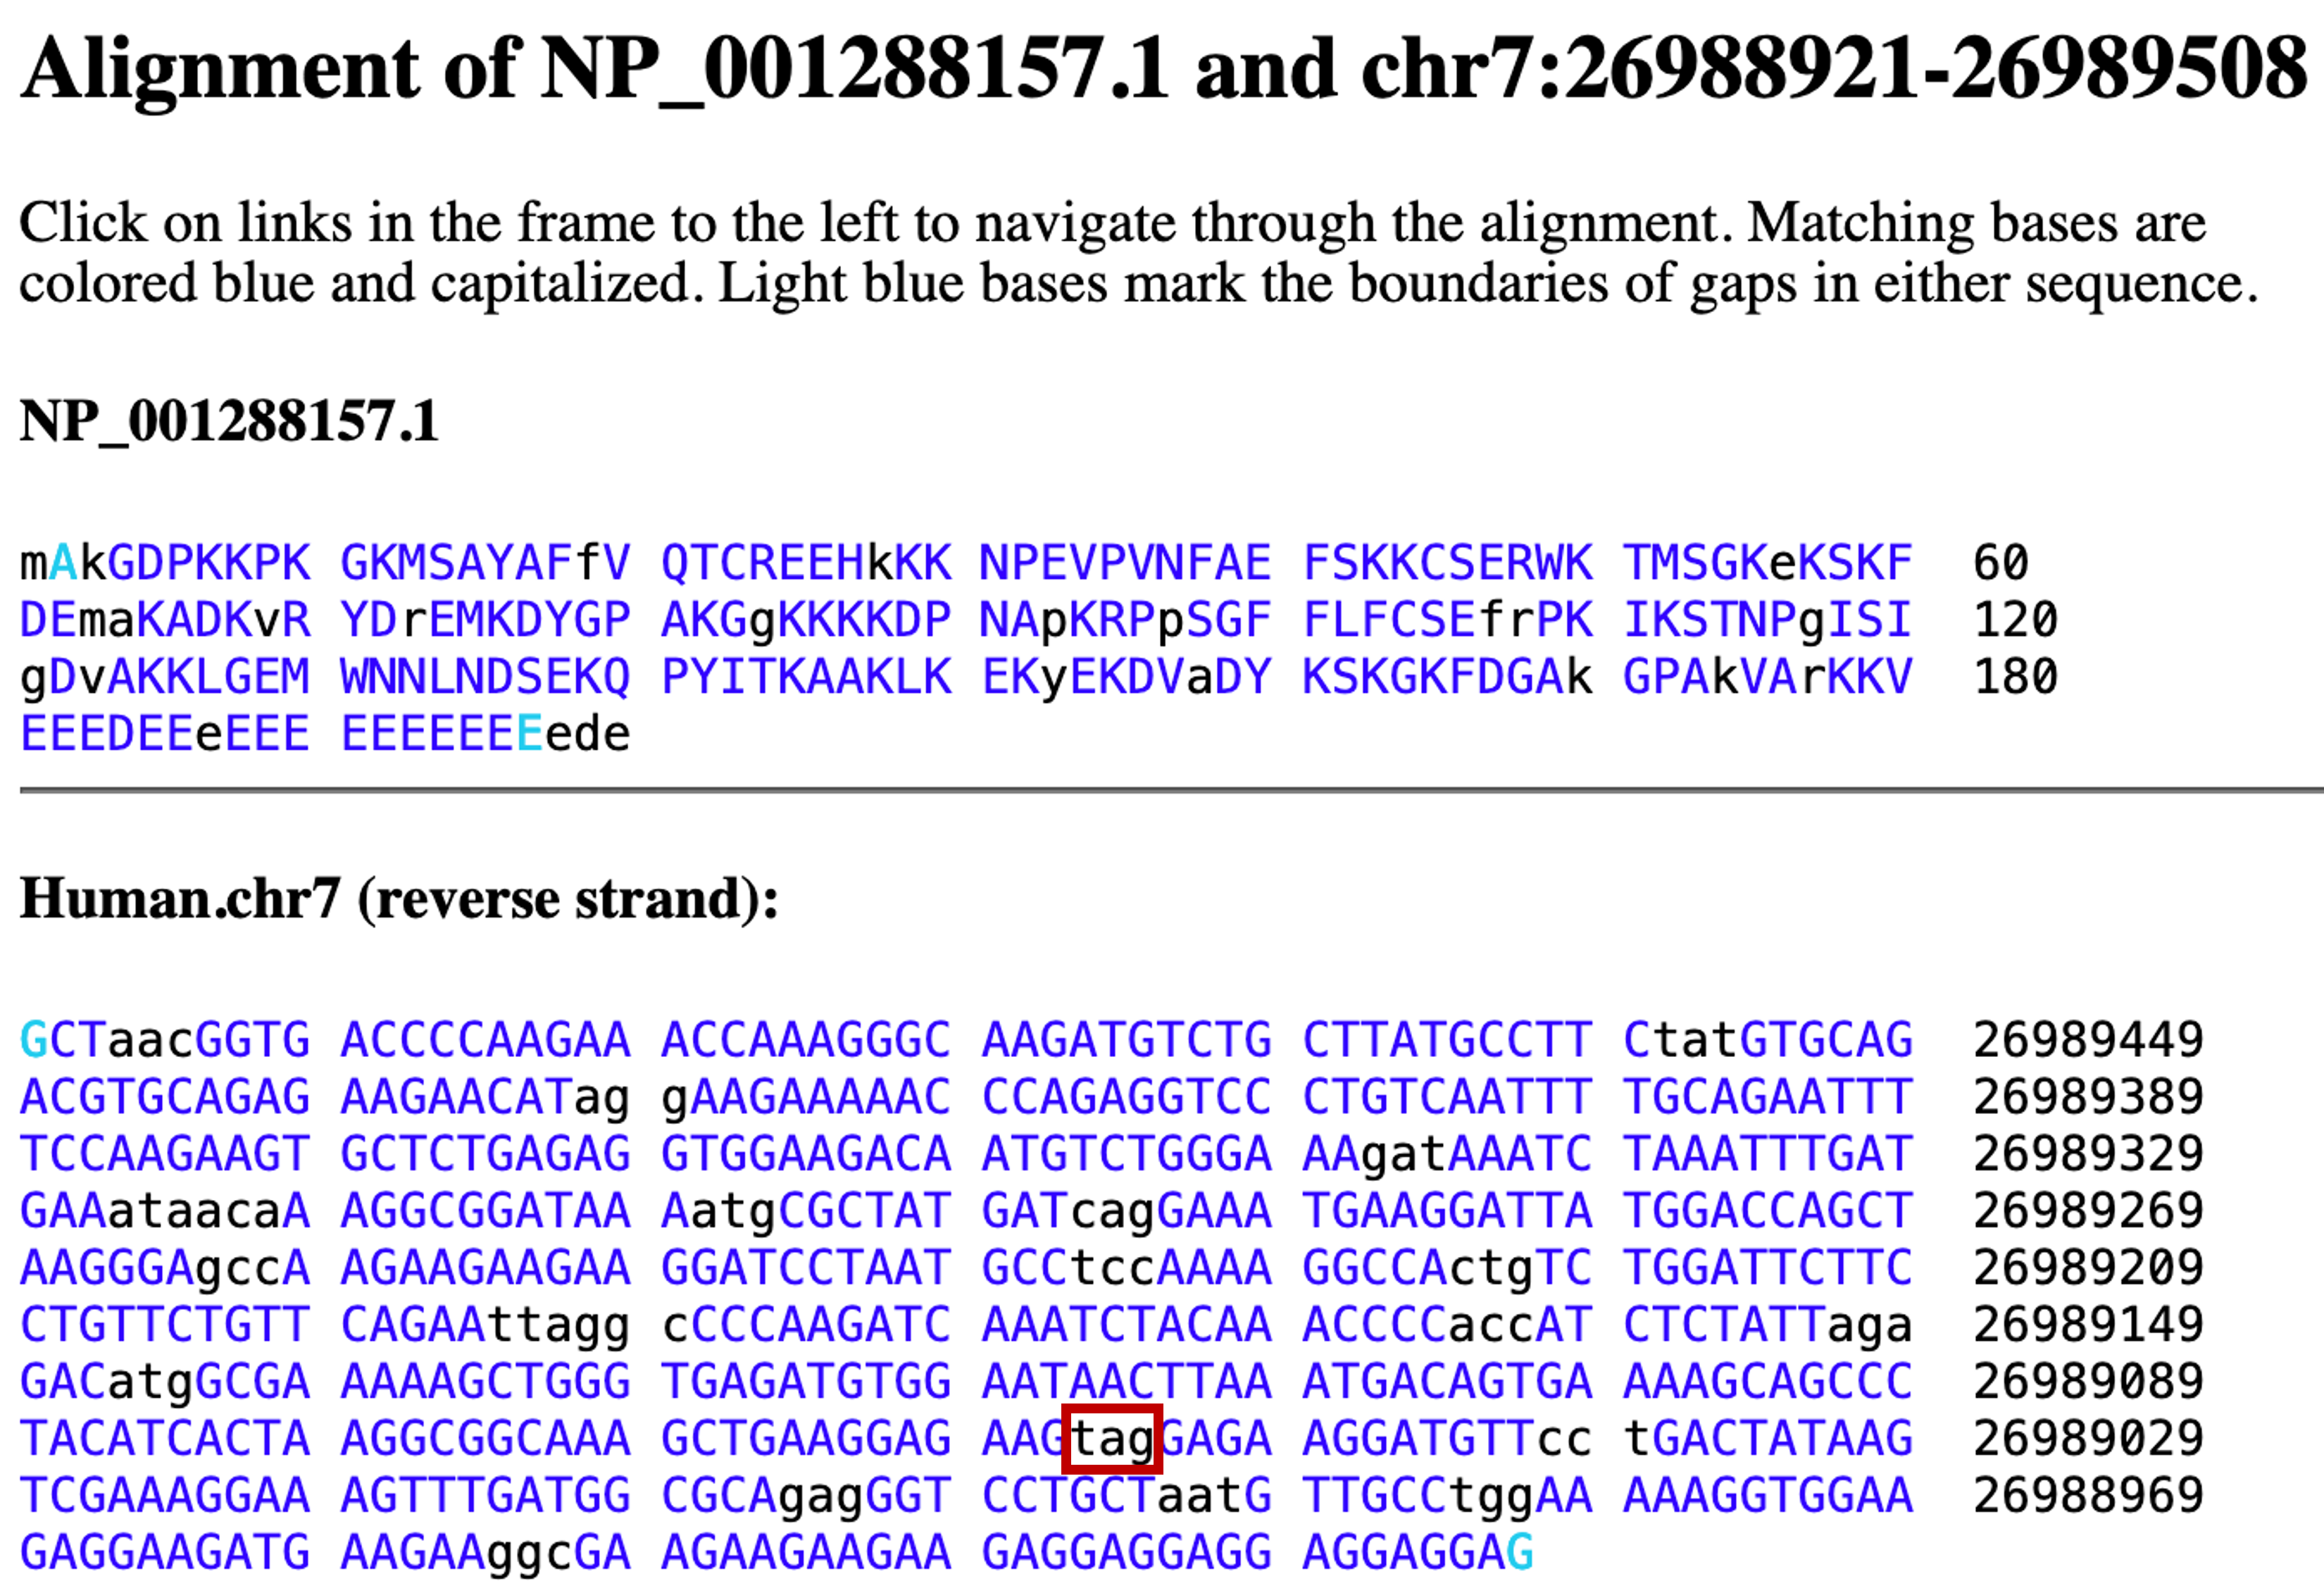
Go back to the BLAT results page, or resubmit the BLAT search using the human HMGB3 protein sequence from the GenBank record. Click on the "details" link to examine the alignment of HMGB3 to chromosome 7.
For each alignment block, matches are in blue capital letters while mismatched or unmatched residues are in black lowercase letters. In general, the alignment looks good except for a few amino acid changes. However, when we examine some of the unmatched (black) regions, we noticed that one of these mismatches has the sequence "tag" — which would encode for a stop codon if it were in the correct reading frame (Figure 23).
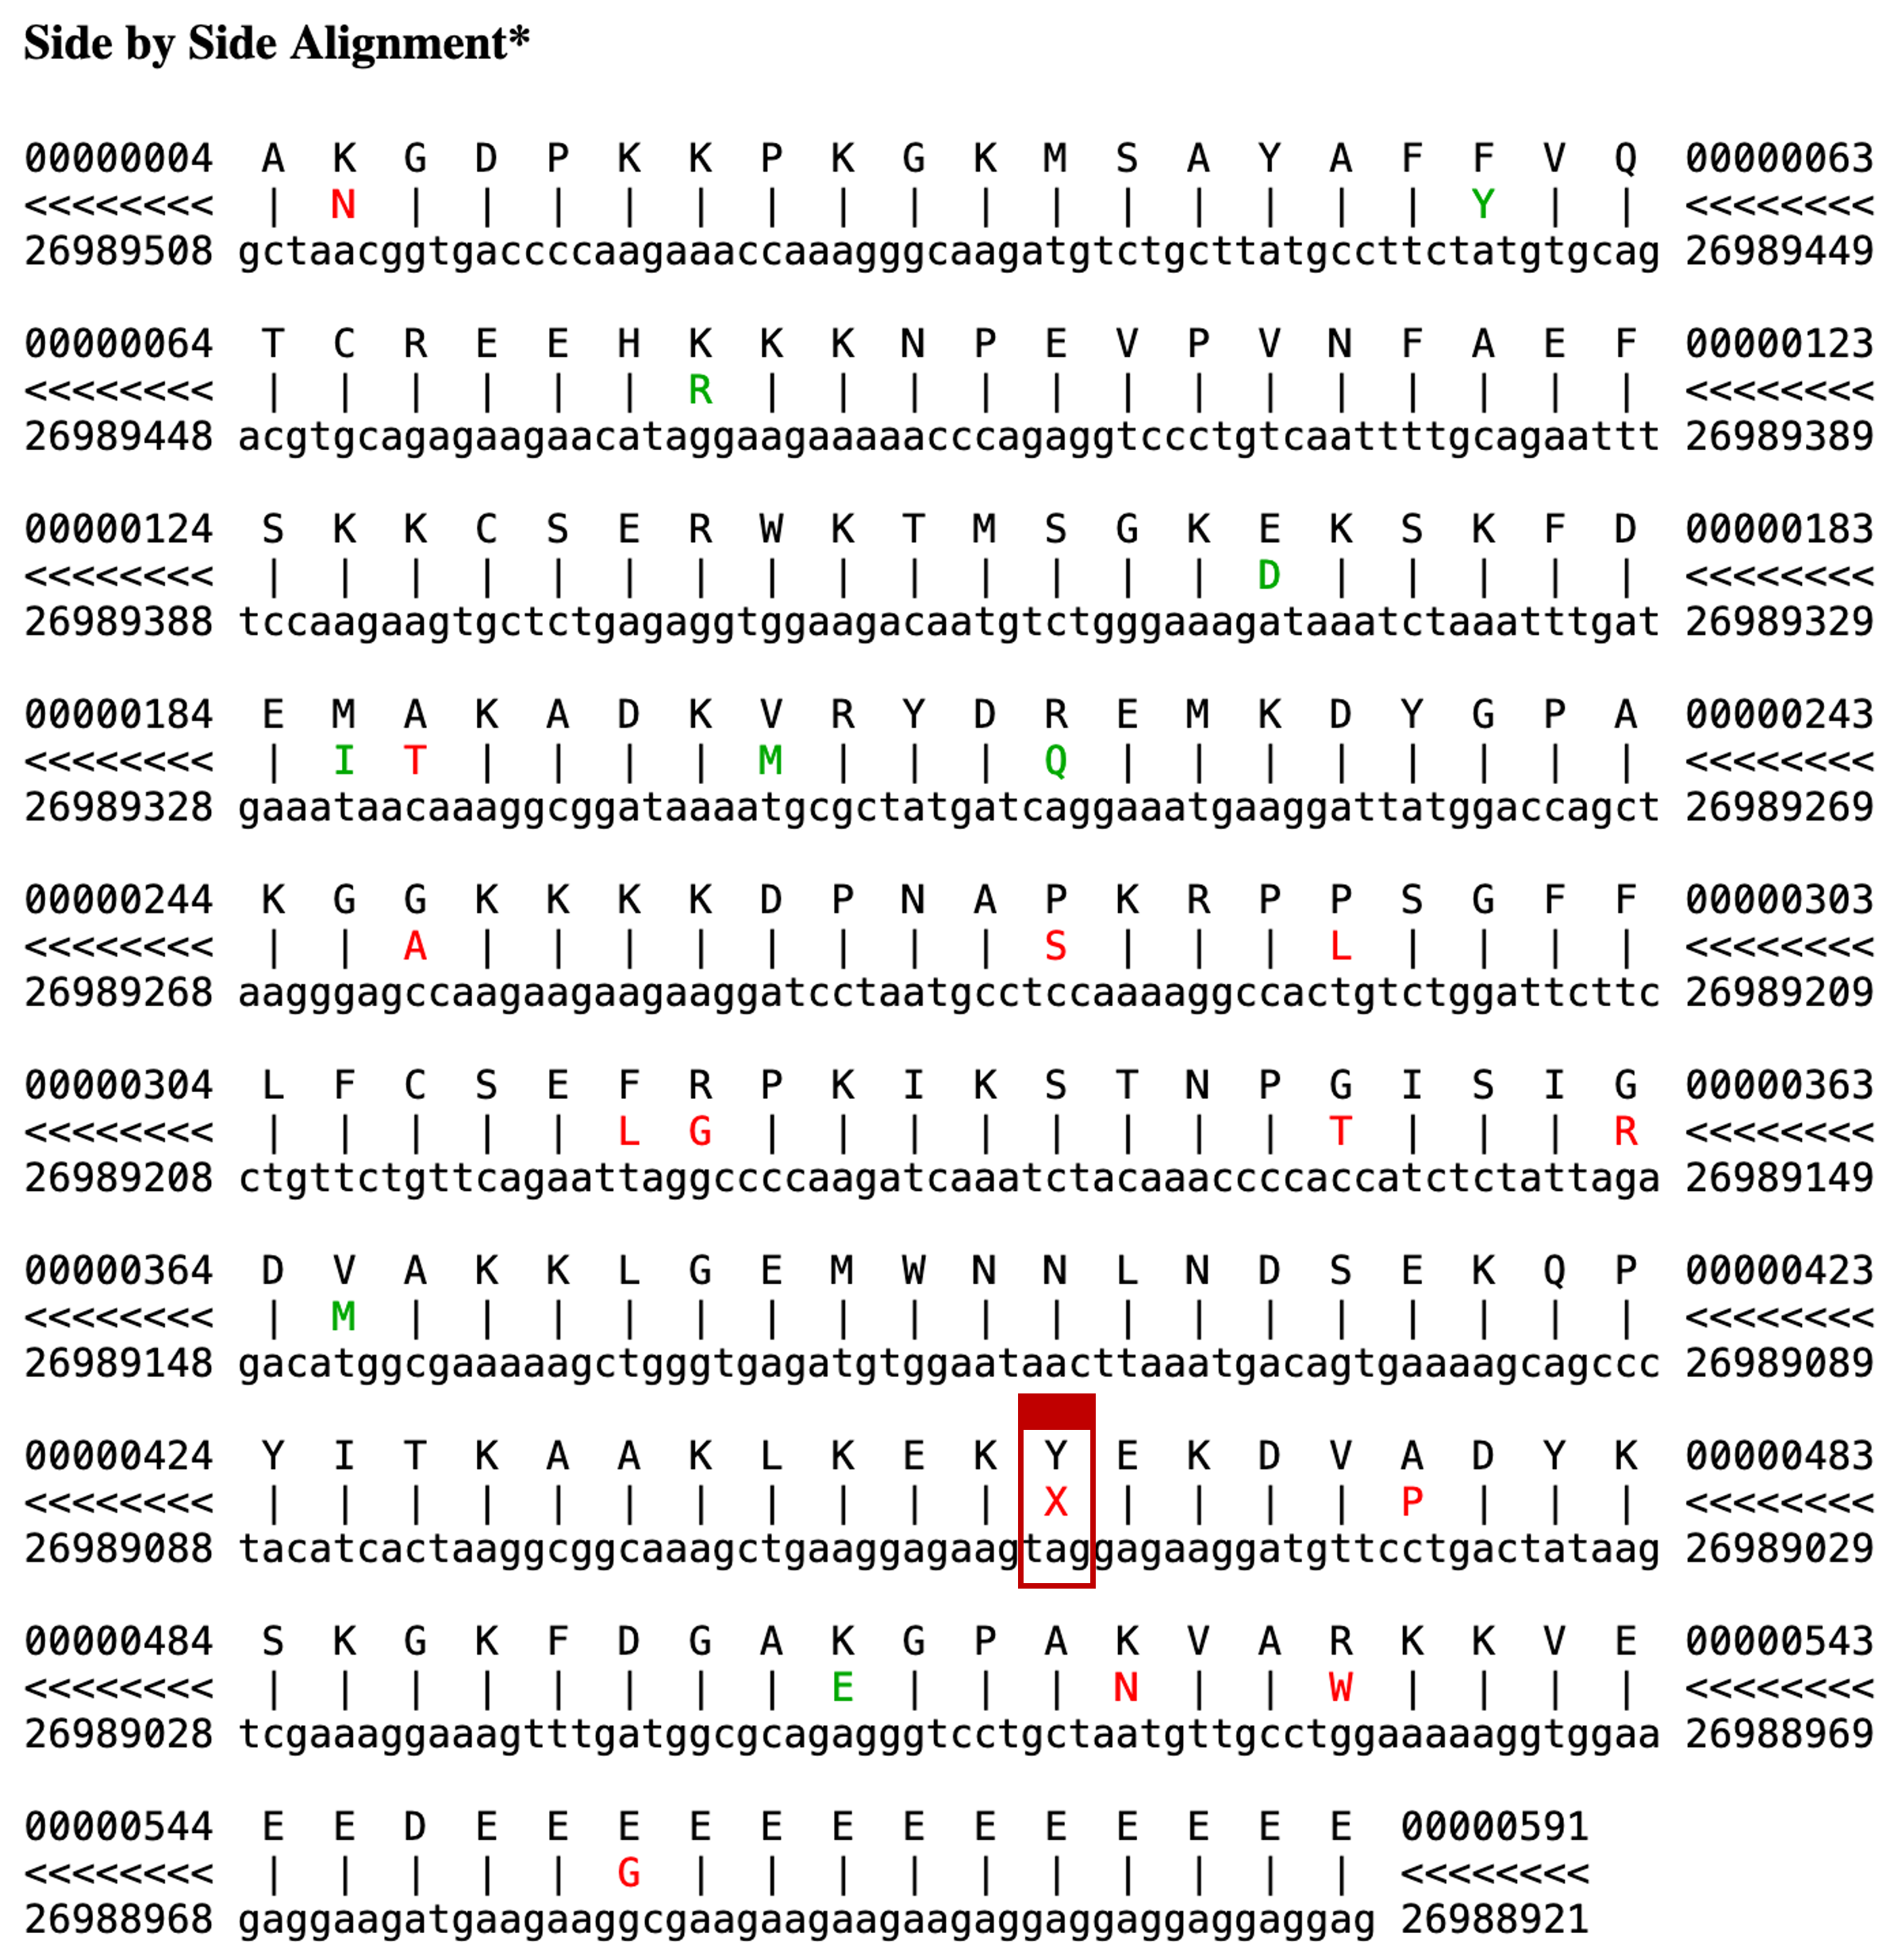
We can verify that this "tag" sequence is an in-frame stop codon by examining the "Side-by-Side Alignment" between the human HMGB3 protein and chromosome 7 (Figure 24). The color scheme for the Side-by-Side Alignment is as follows: a line for match, green for similar amino acids, and red for dissimilar amino acids. We see a red "X" (a stop codon) in the translated region of chromosome 7 that is aligned with a "Y" (tyrosine) in the human HMGB3 protein.
The fact that the protein alignment runs right over this stop codon, with no deterioration in similarity, strongly suggests that our prediction is a recently retrotransposed pseudogene, which has been inactivated by the mutation but has not yet diverged significantly from its source gene.
To confirm this hypothesis, go back to the BLAT results and click on the "browser" link to find the place where HMGB3 best matches the genome (i.e., 100% identity at the X chromosome) and then zoom out 10x. We observe that HMGB3 actually has four coding exons in the human genome (Figure 25)! Case closed.
Based on all the evidence we have collected, we can conclude that, as a processed cDNA, the four-exon HMGB3 gene from the X chromosome was retrotransposed into chromosome 7 and acquired a stop codon (i.e., a nonsense mutation) prior to the split of the chimpanzee and human lineages. However, this transposition event is relatively recent, because the pseudogene still retains 88.8% identity to its source protein.
But how do we explain all the supporting evidence (i.e., ESTs) for our prediction, given that it turned out to be a pseudogene? They are almost certainly due to the fact that our pseudogene has a high degree of similarity to the functional HMGB3 protein. To confirm this hypothesis, we can perform additional pairwise BLAST alignments of the ESTs against the pseudogene and the functional protein. If our hypothesis is correct, the ESTs should be more similar to the functional protein than to the pseudogene.
In order to estimate the age of this pseudogene, we can do a BLAT search using the pseudogene or the HMGB3 protein against the mouse or rat genome browsers. If we find the corresponding pseudogene in the syntenic regions of the rodent genomes, then the transposition event likely occurred prior to the divergence of rodents and primates.
Estimating the age of the pseudogene
To estimate the age of the pseudogene, go back to the BLAT results showing the human HMGB3 sequence compared to homologous region of human chromosome 7. We will examine the "Mouse Chain/Net" track more closely. The "Mouse Chain/Net" track actually consists of two different tracks. The "Chain" track attempts to map every part of the human genome to the mouse genome. It was built by "chaining" individual alignments together into long stretches that indicate regions of orthology between mouse and human. The "Net" track attempts to summarize the chains into multiple levels, with the longest chain classified as level 1. Chains at subsequent levels fill in the gaps in the Net levels above. Boxes in this track represent ungapped alignments, while lines signify the presence of gaps.
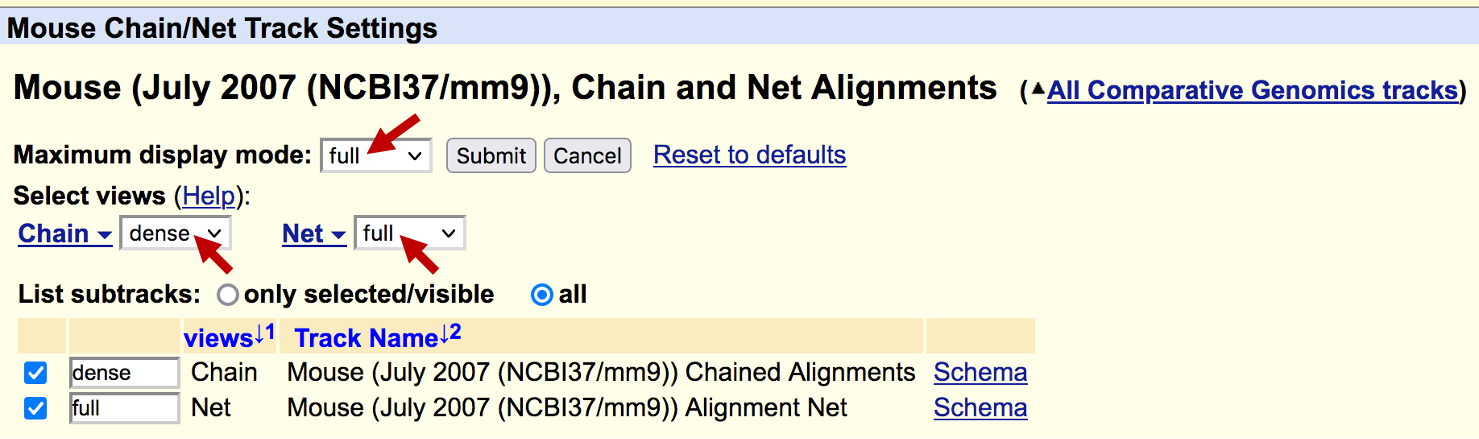
Because there are a large number of alignments in the "Chain" track, we will configure the UCSC Genome Browser so that it only shows the "Net" track. Scroll down to the track configuration section and click on the "Mouse Chain/Net" link under the "Comparative Genomics" section. Change the "Maximum display mode" to "full", the "Chain" drop-down box to "hide" and the "Net" drop-down box to "full." Click "Submit" and zoom out 10x (Figure 26).
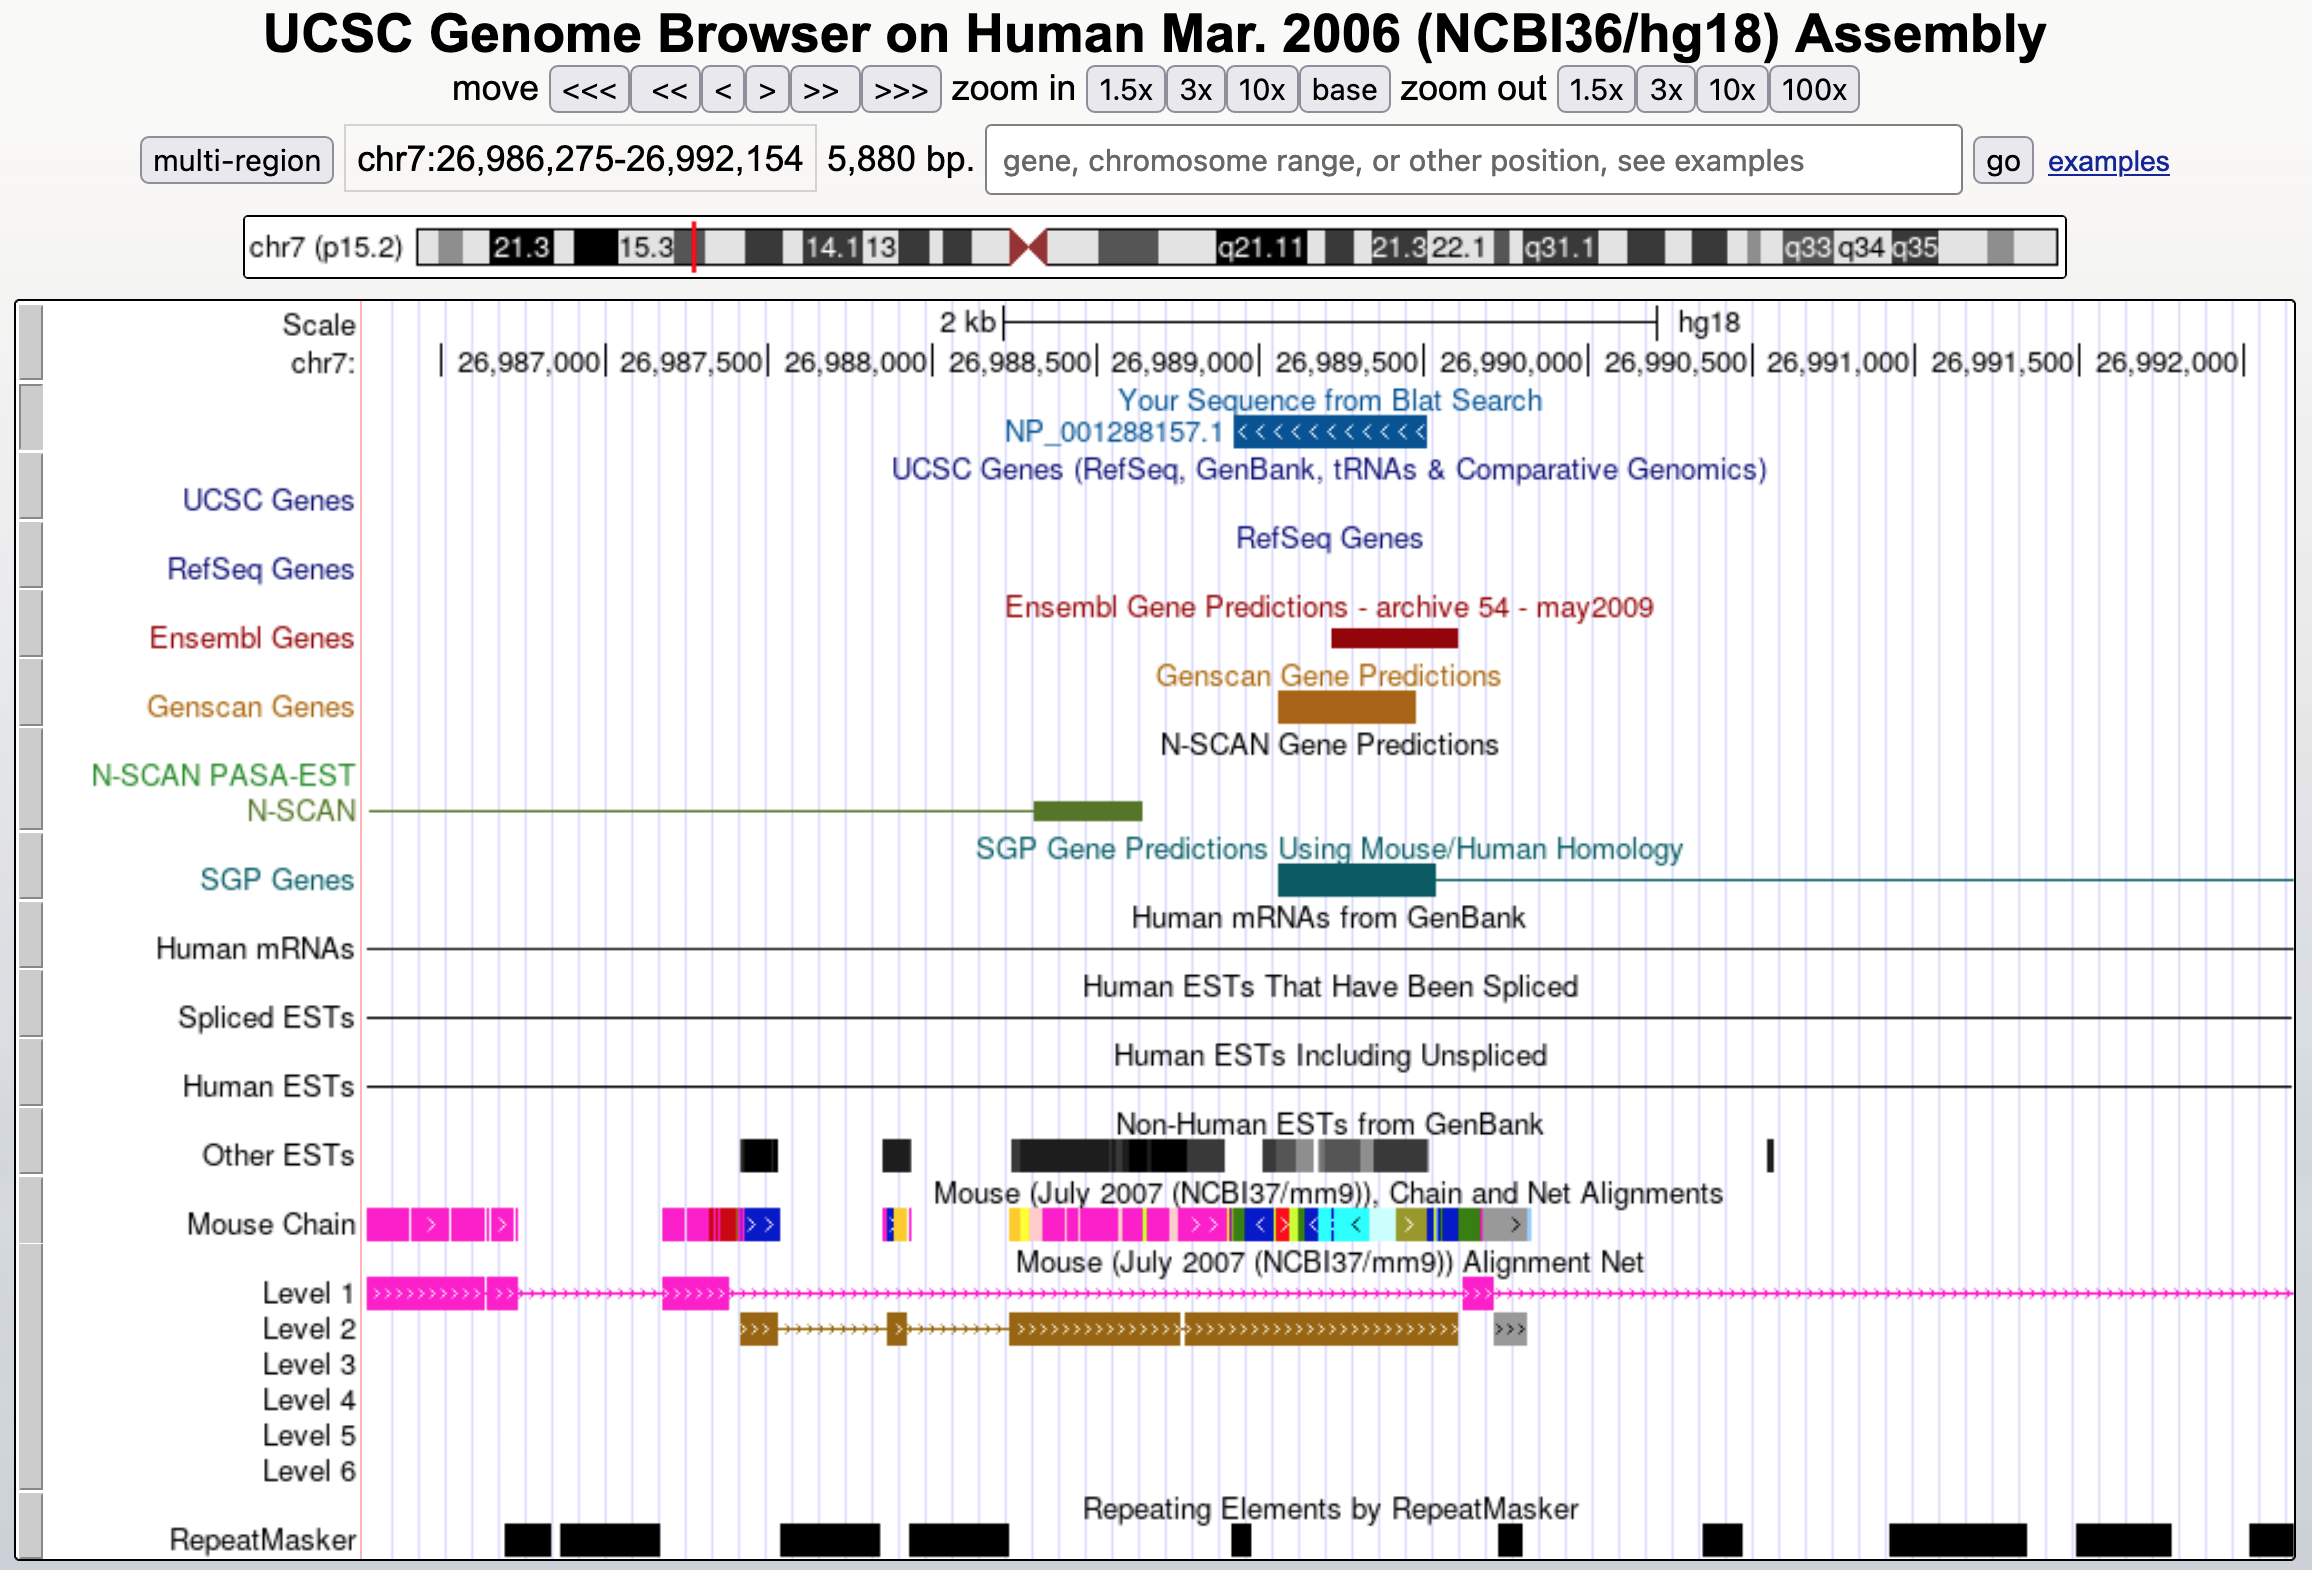
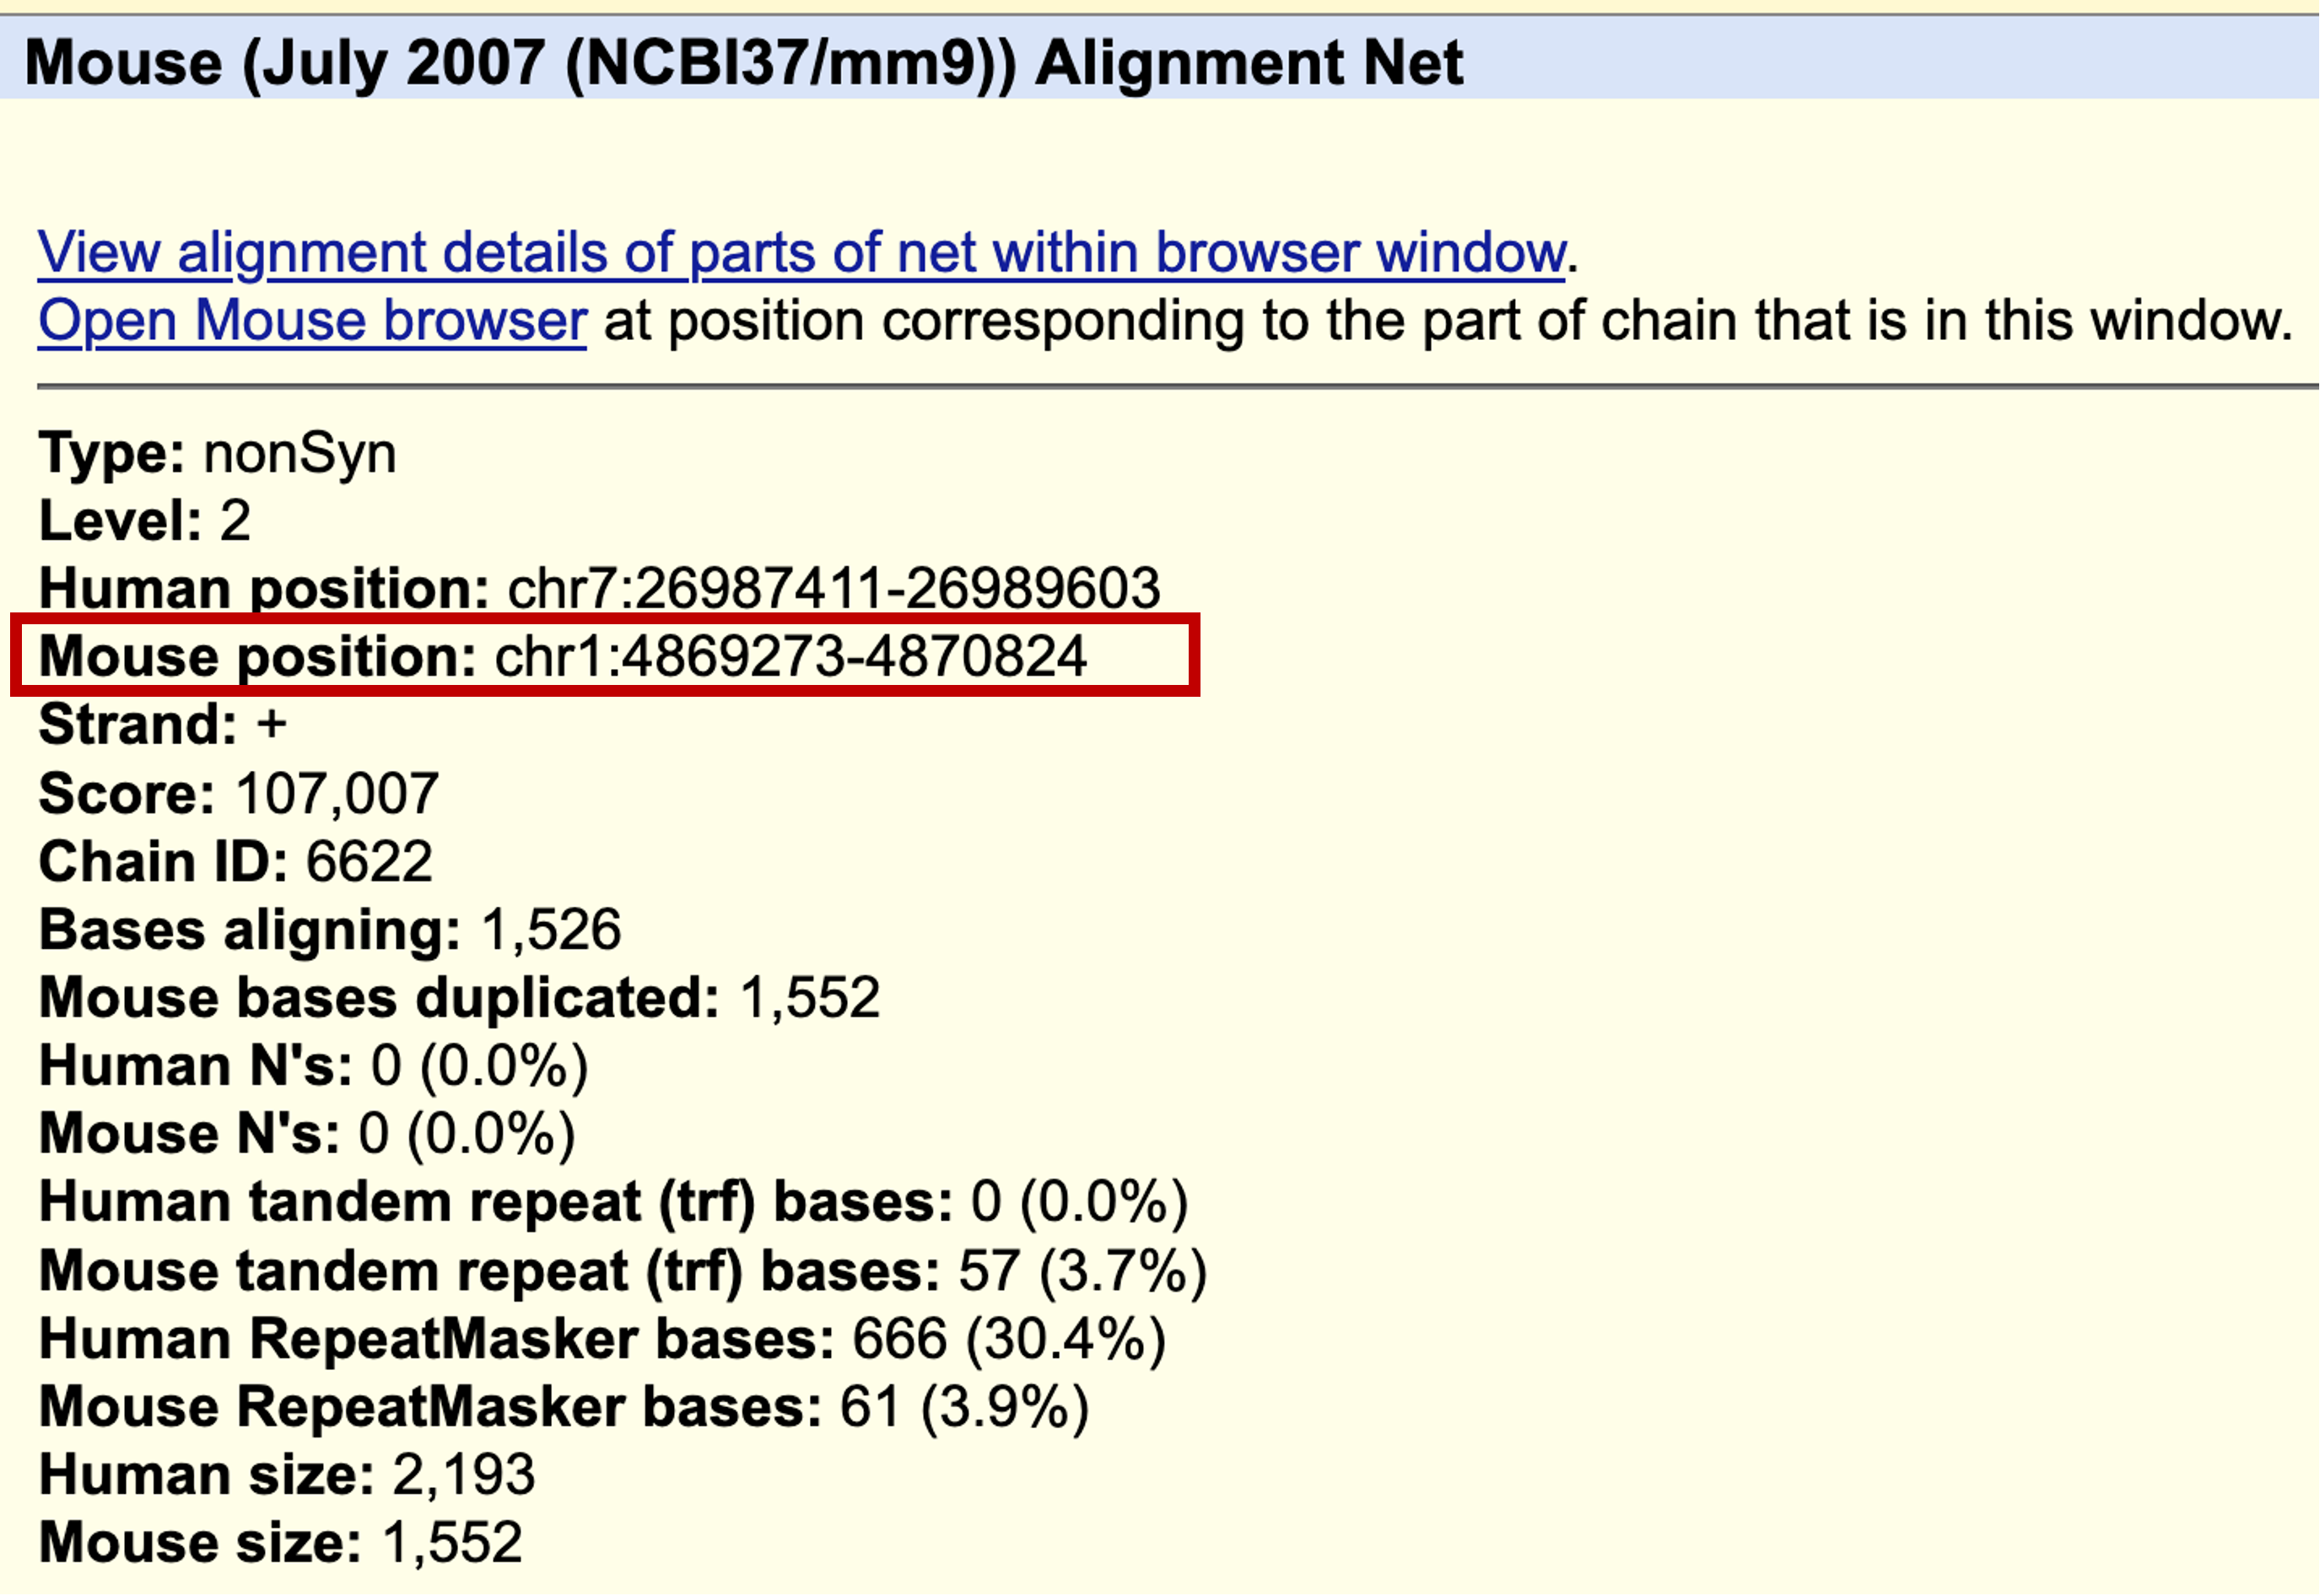
When we click on the level 1 feature in the Mouse Alignment Net track (i.e., the boxes in pink), we find that the region surrounding the pseudogene is most similar to chromosome 6 of the mouse genome. By contrast, when we click on the feature in level 2 of the Mouse Alignment Net track (i.e., the boxes in brown), we find that the region that overlaps with the pseudogene is most similar to chromosome 1 in the mouse genome (Figure 27).
To investigate this difference further, we will perform a BLAT search against the "Mouse" genome ["July 2007 (NCBI37/mm9)" assembly] using the human HMGB3 protein sequence (Figure 28).
The BLAT results show two regions in the mouse genome with high (>= 97%) sequence identity to the human HMGB3 protein (Figure 29). Both of these hits match the entire length of the HMGB3 protein.
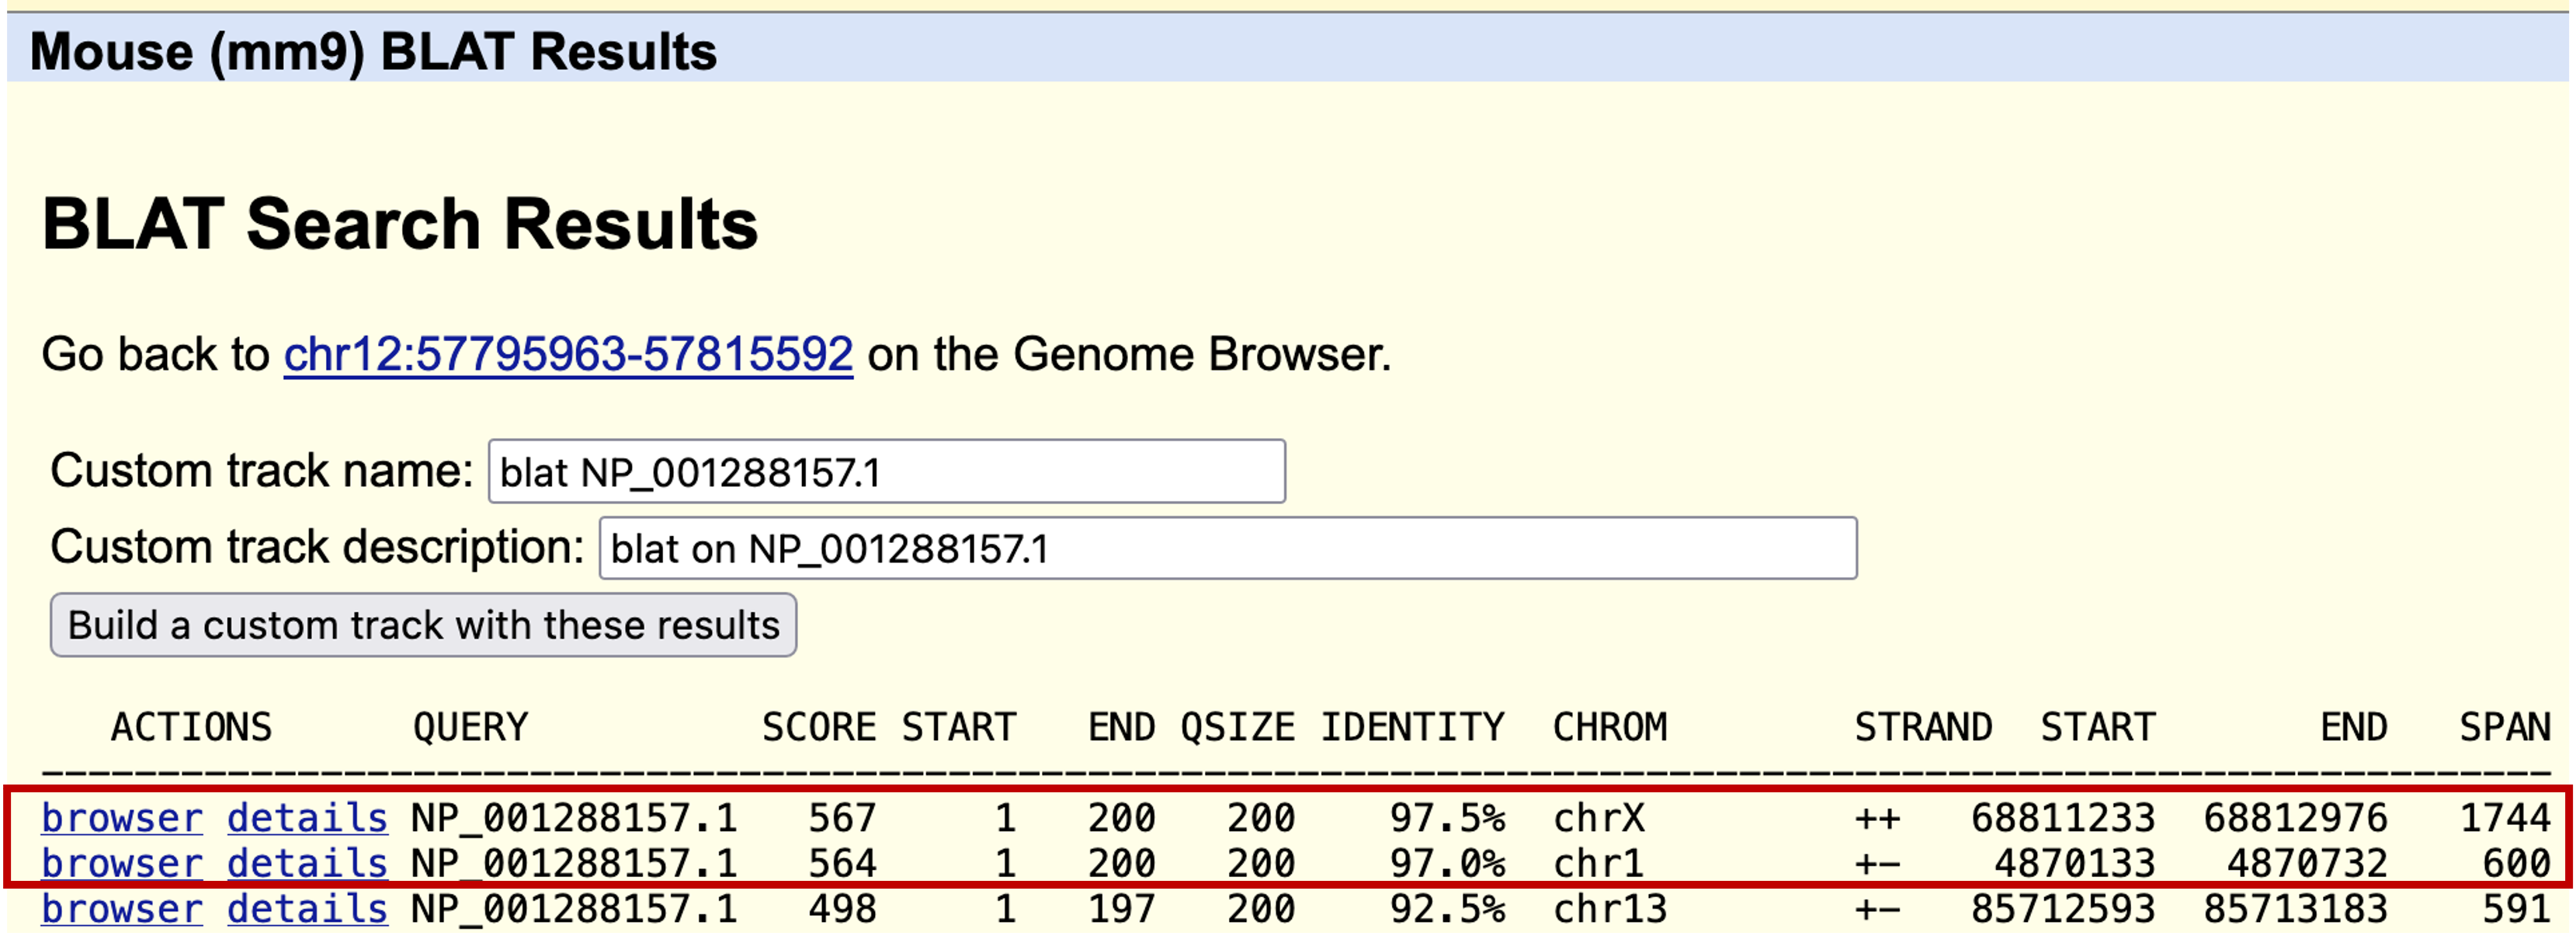
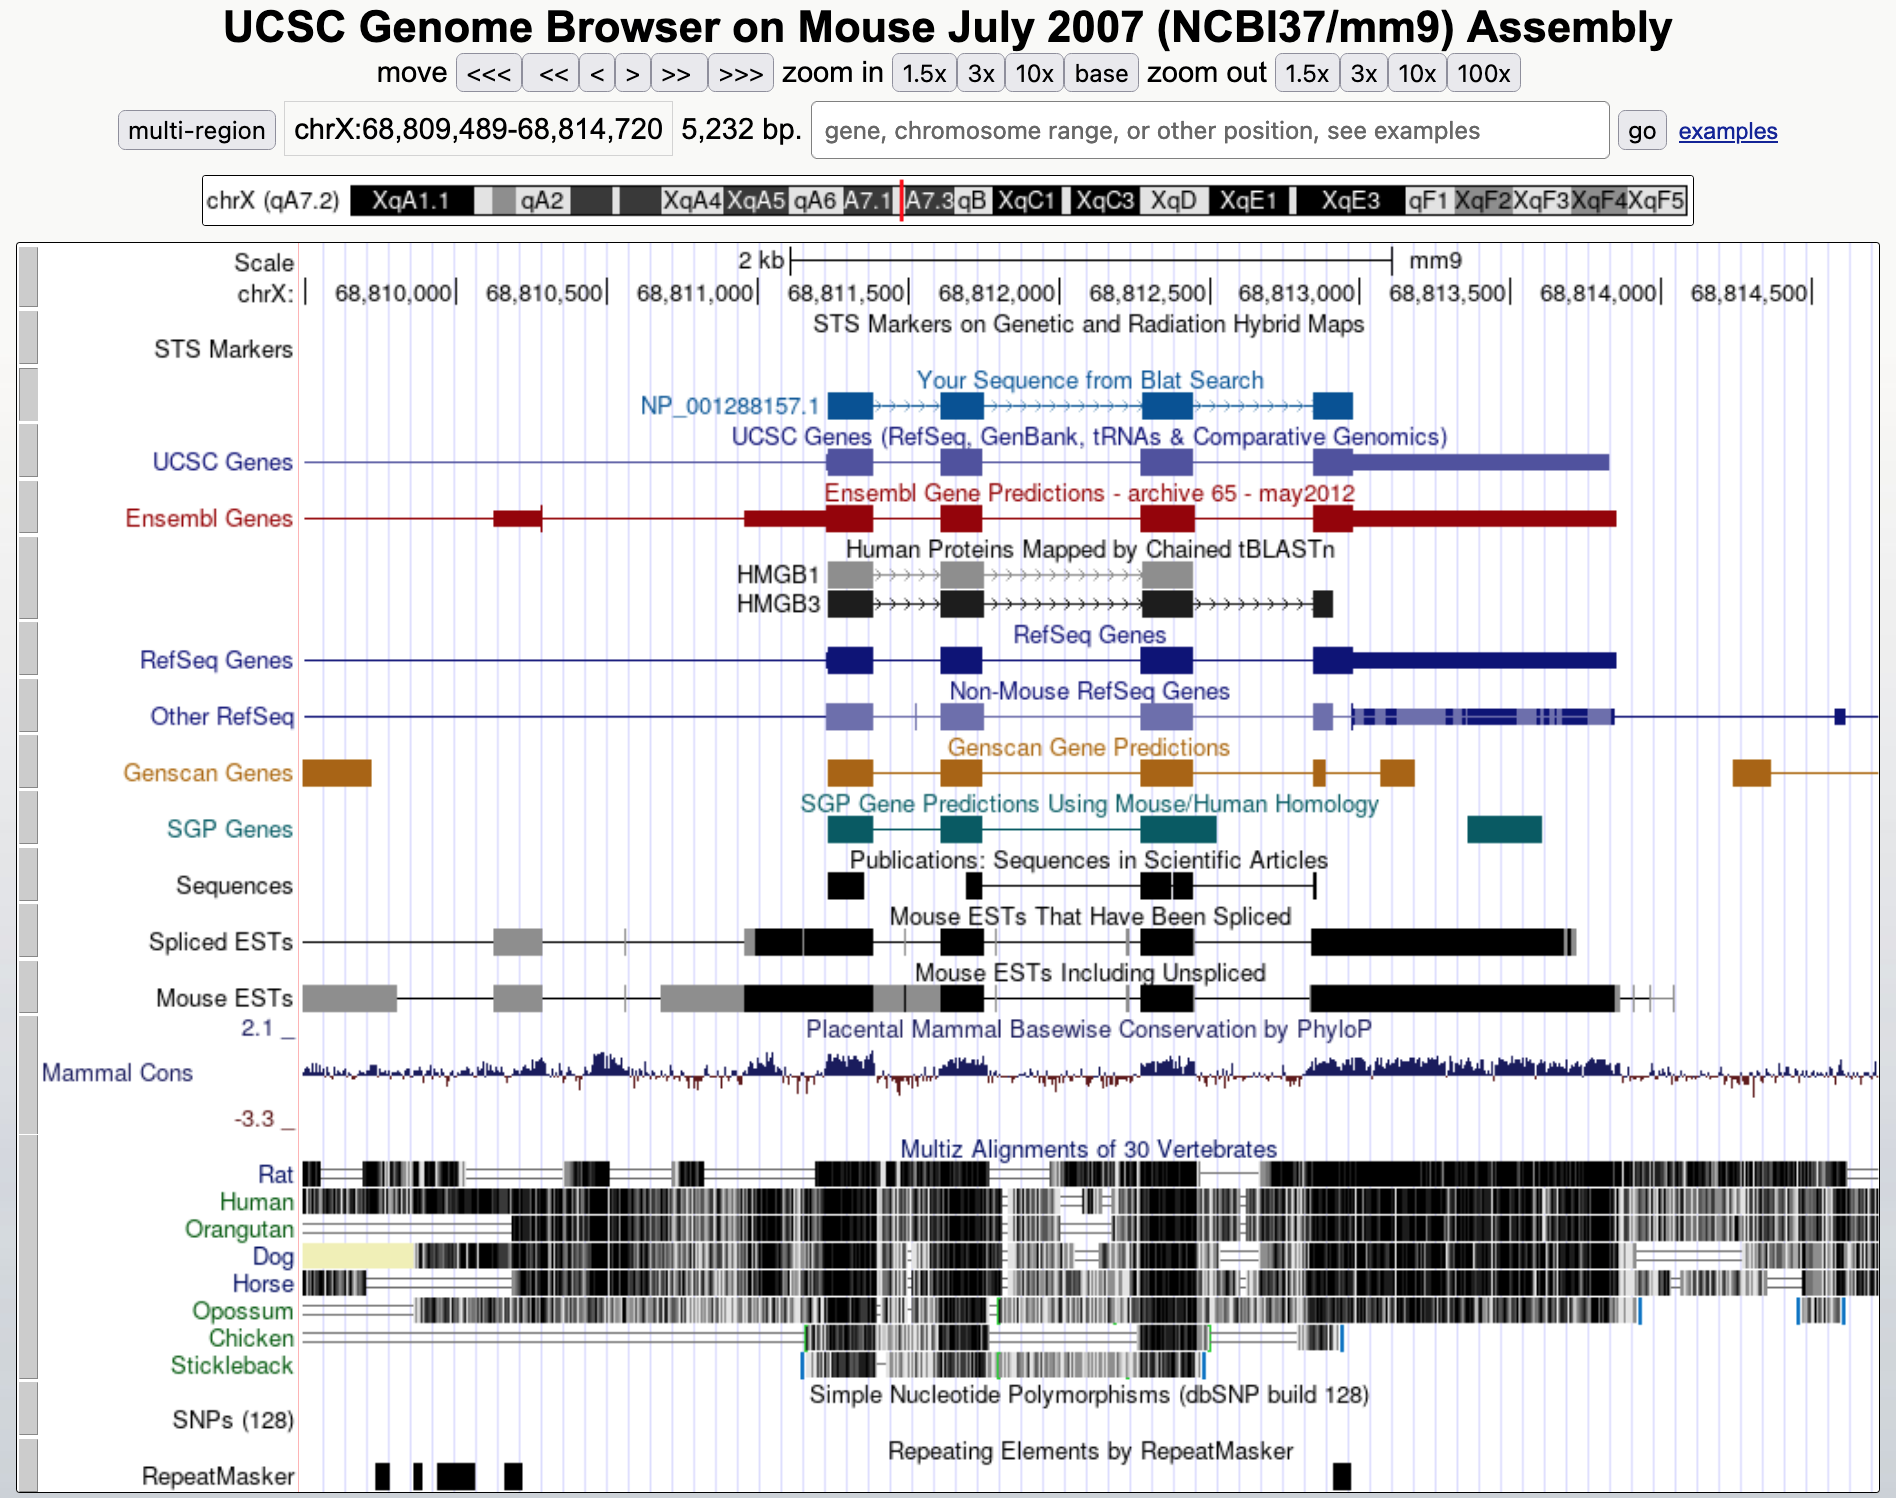
Click on the "browser" link for the match with the highest percent identity (97.5%) on the X chromosome and then zoom out 3x. We observed that this feature is supported by RefSeq mRNAs and spliced ESTs. The feature has four coding exons, similar to what we saw for the real ortholog of the HMGB3 gene in the human genome (Figure 30).
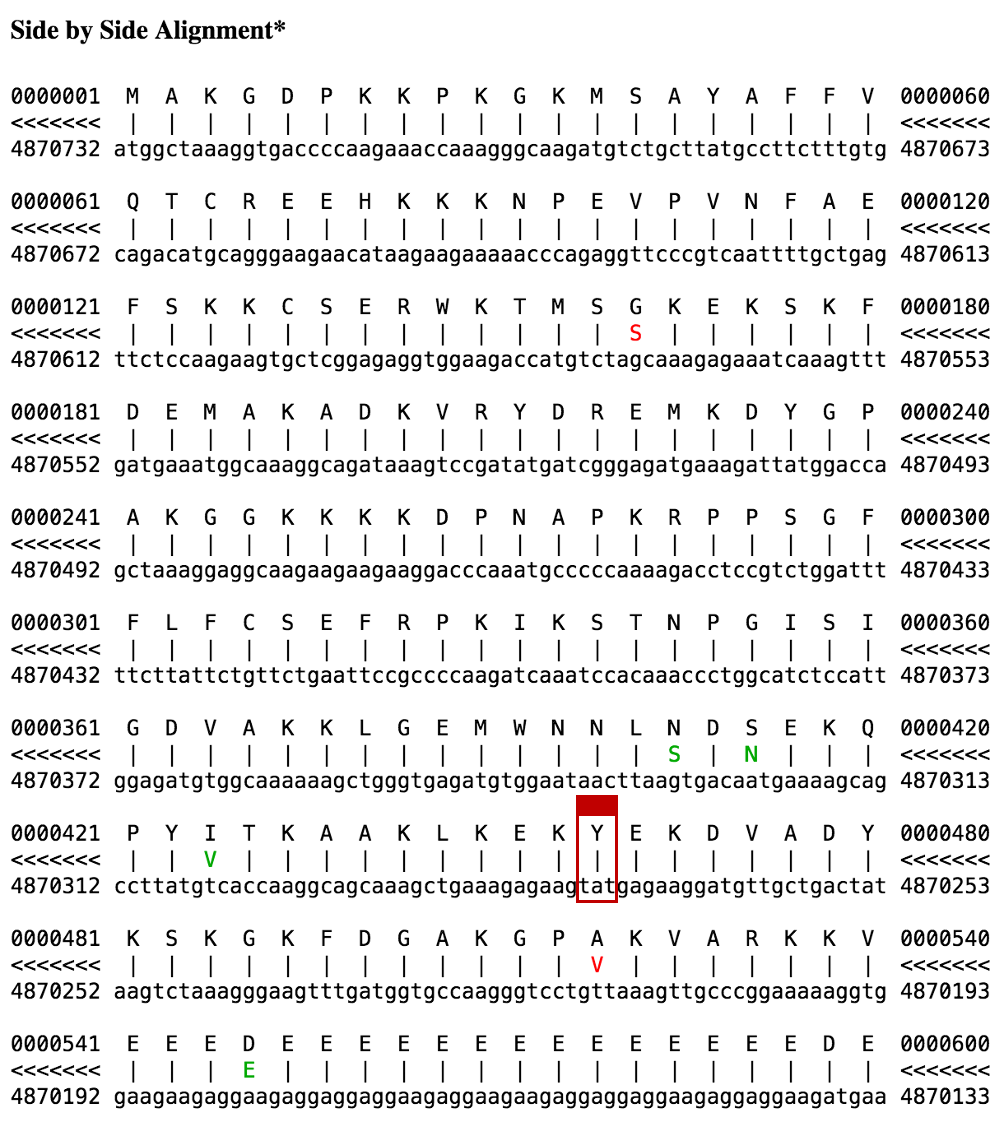
Now go back and click on the "details" link to examine the alignment to the match in chromosome 1 (with 97.0% identity). We see in the Side-by-Side Alignment that even though the feature consists of only a single exon, the in-frame stop codon has not yet been introduced into this sequence (Figure 31). Our analysis suggests the functional mouse ortholog of the HMGB3 protein is located on the X chromosome while the ortholog to the pseudogene is found on chromosome 1. In addition, our results suggest that the stop codon mutation was introduced into the pseudogene after the split of the primate and rodent lineages.
We can iteratively conduct the same experiment (i.e., perform BLAT searches against other genomes using the human HMGB3 protein) to obtain a better estimate as to when the pseudogene first acquired the stop codon. This analysis is left as an exercise for the reader.
Analysis of predicted gene 5 (three exons, 1017 coding bases)
Examine conserved domain matches from the blastp search of the predicted peptide against the nr protein database
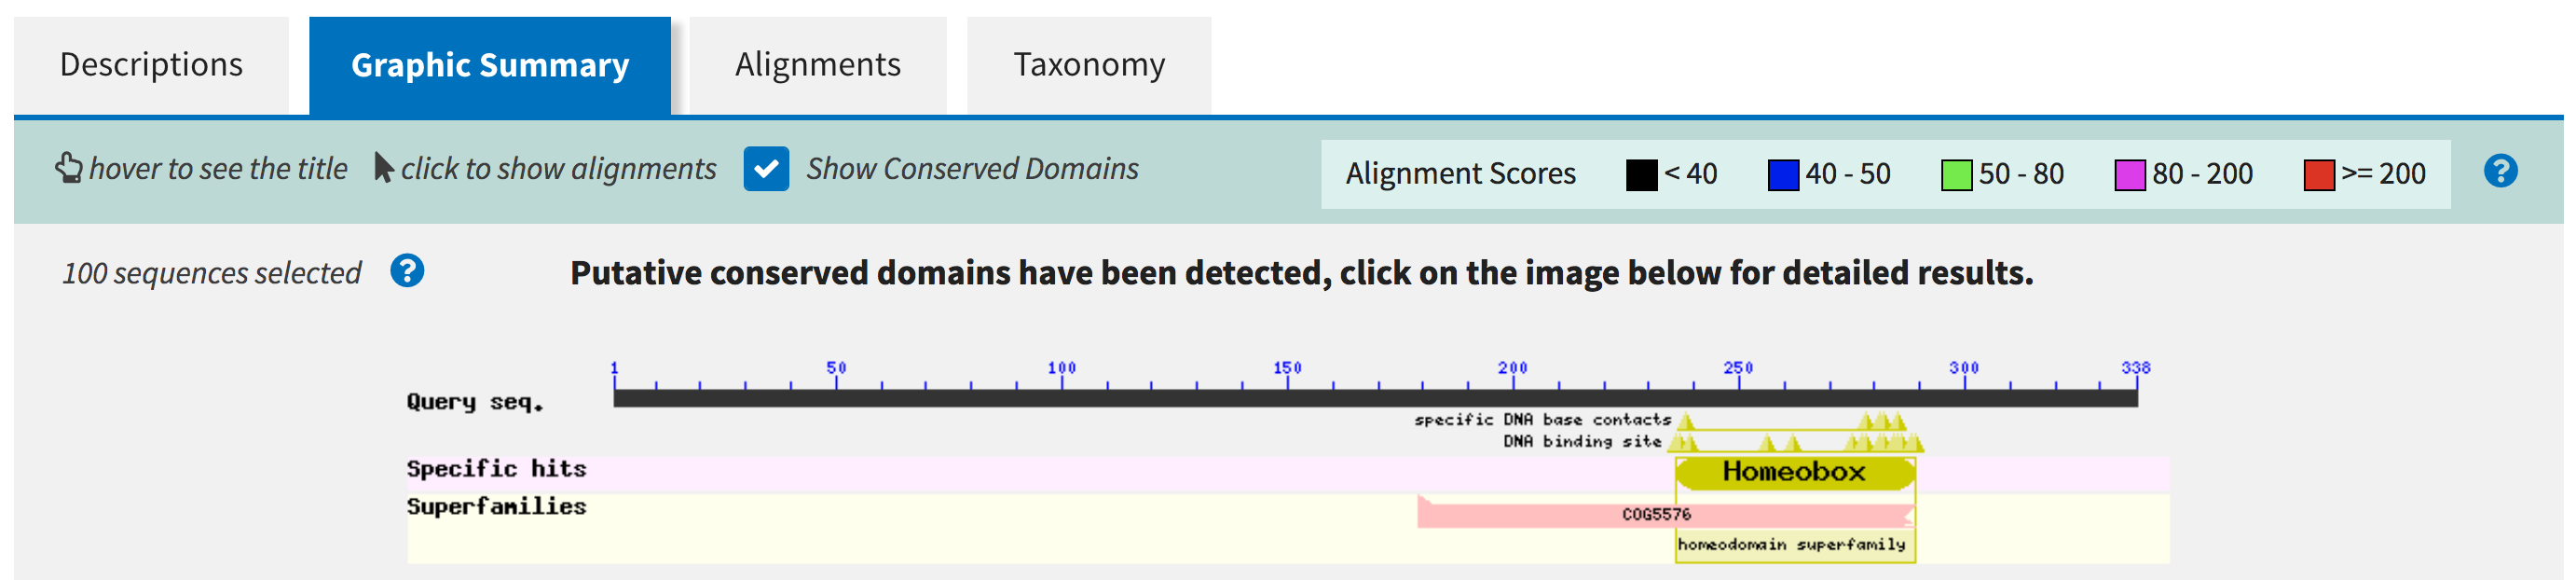
We begin our analysis of the fifth GENSCAN prediction with a blastp search against the nr database. The CDD search result under the "Graphic Summary" tab shows the predicted protein contains a conserved Homeobox domain (Figure 32).
|
|
The blastp results are available in the file blastpGene5.txt in the tutorial package. |
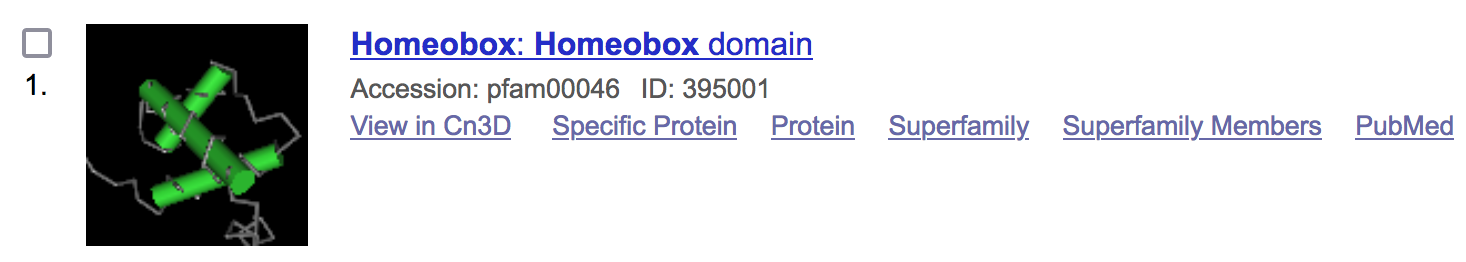
To obtain additional information regarding the function of the Homeobox domain, open a new web browser window and navigate back to the NCBI home page. On the top search bar, change the database to "Conserved Domains" and then search for "Homeobox" (Figure 33). Click on the first hit (with the accession number "pfam00046") to access the CDD record (Figure 34).

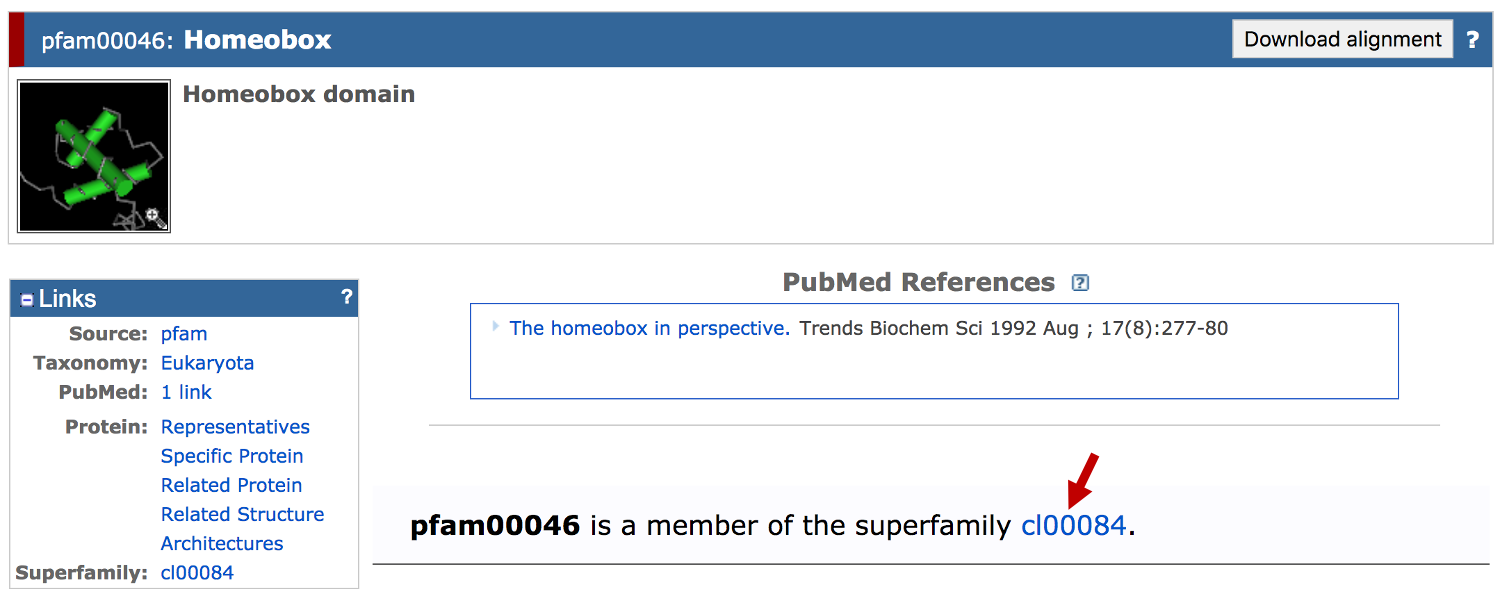
Click on the "cl00084" link to navigate to the superfamily record for the Homeobox domain. We can find out more about the function of the homeodomain superfamily from the description of the CDD record:
Homeodomain; DNA binding domains involved in the transcriptional regulation of key eukaryotic developmental processes; may bind to DNA as monomers or as homo- and/or heterodimers, in a sequence-specific manner.
Examine blastp alignments of predicted peptide against the nr database
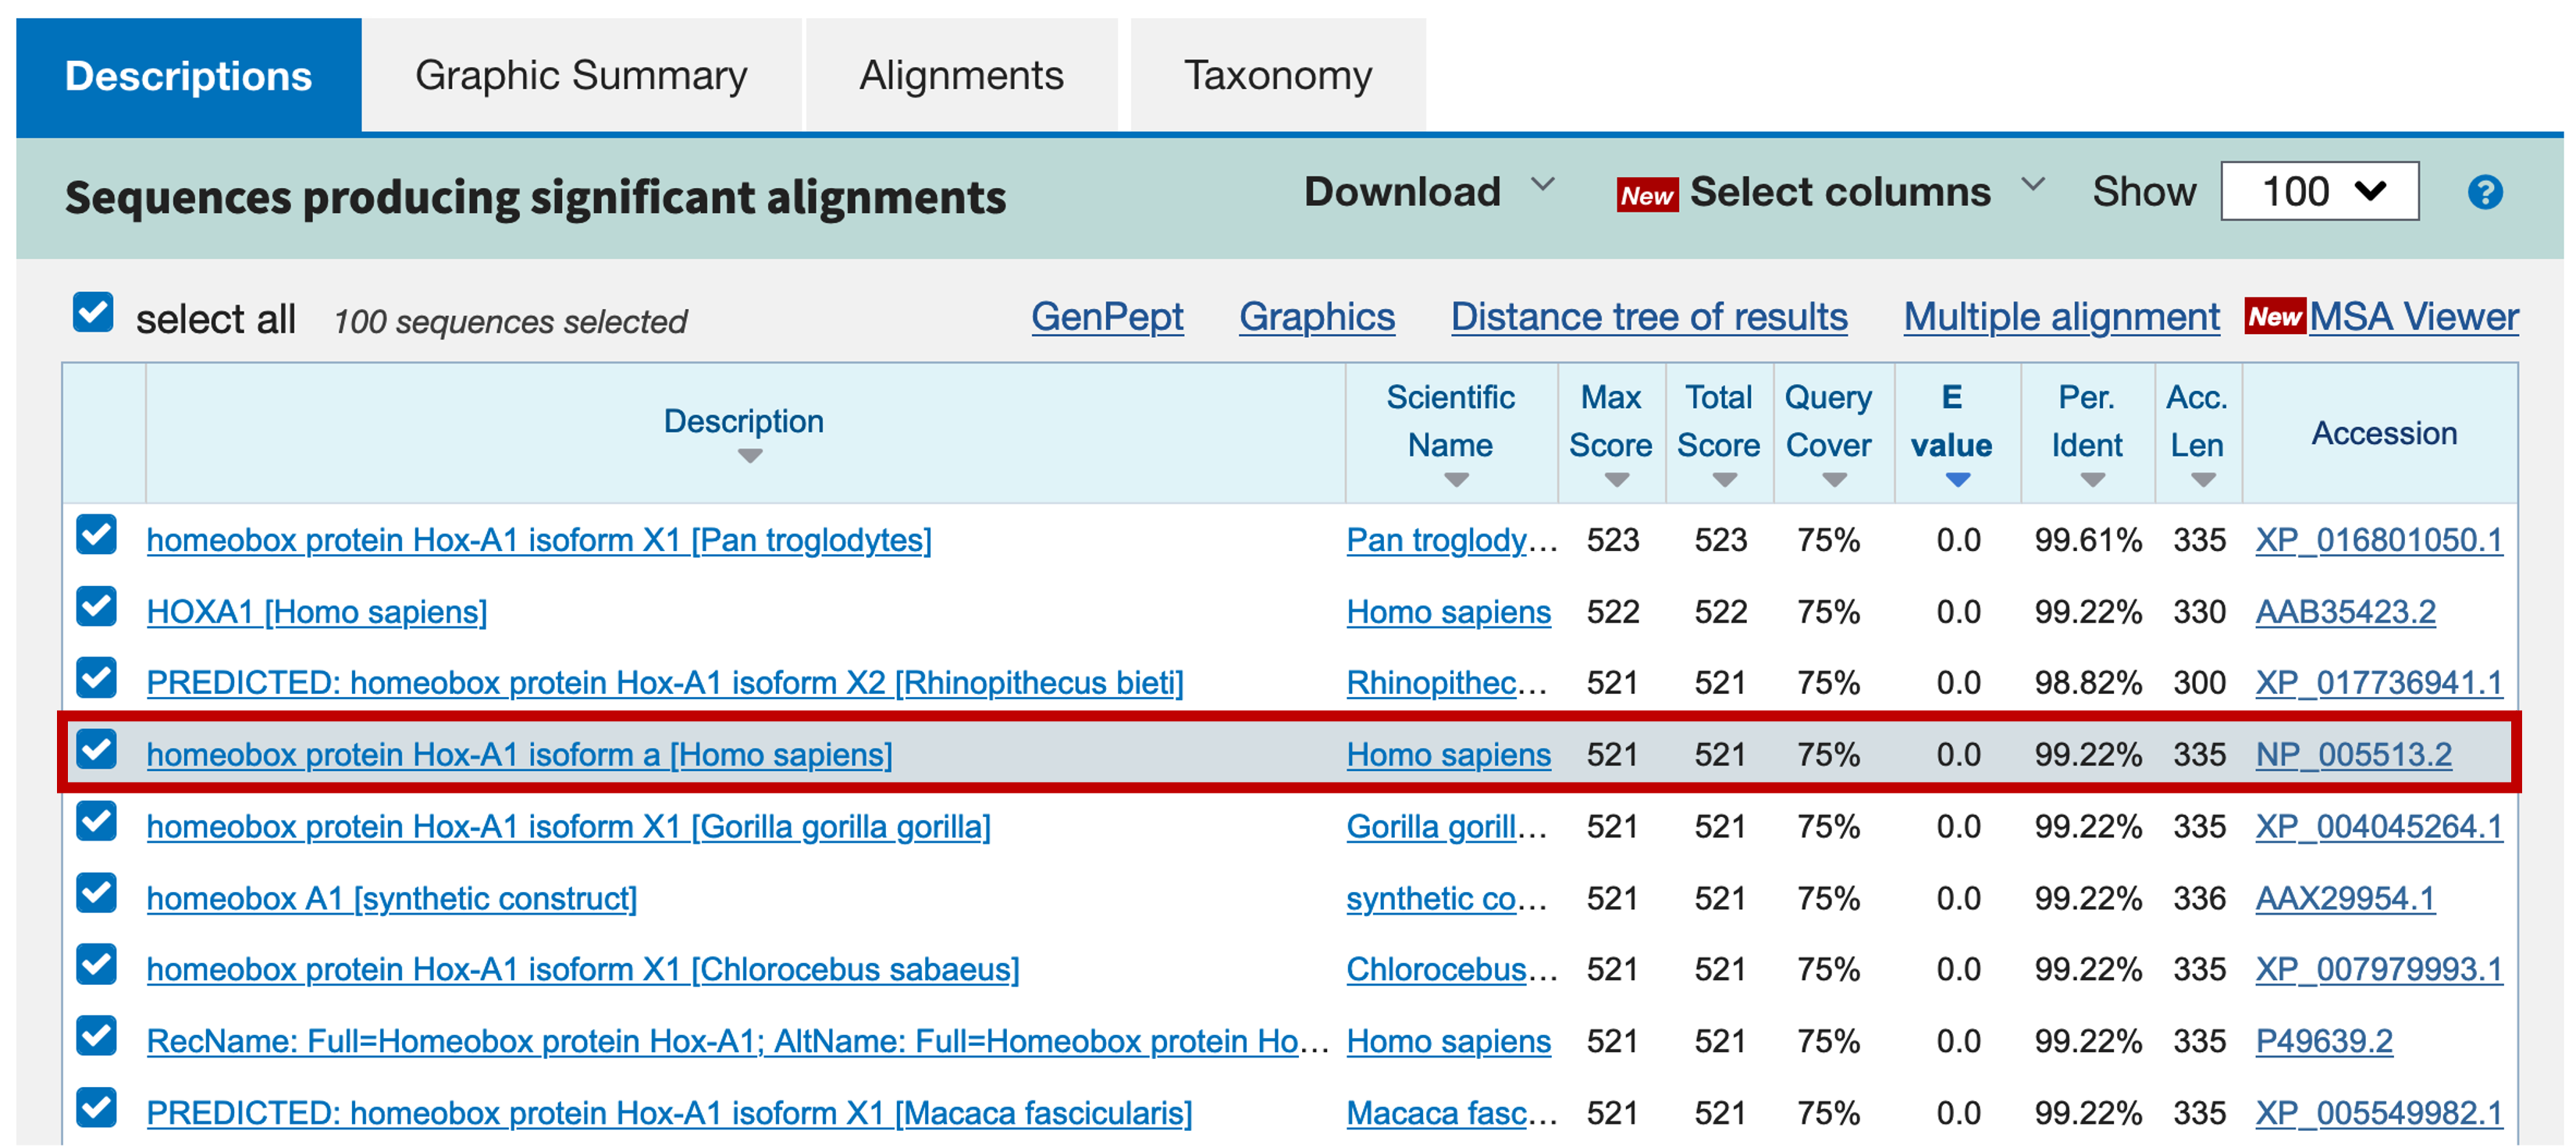
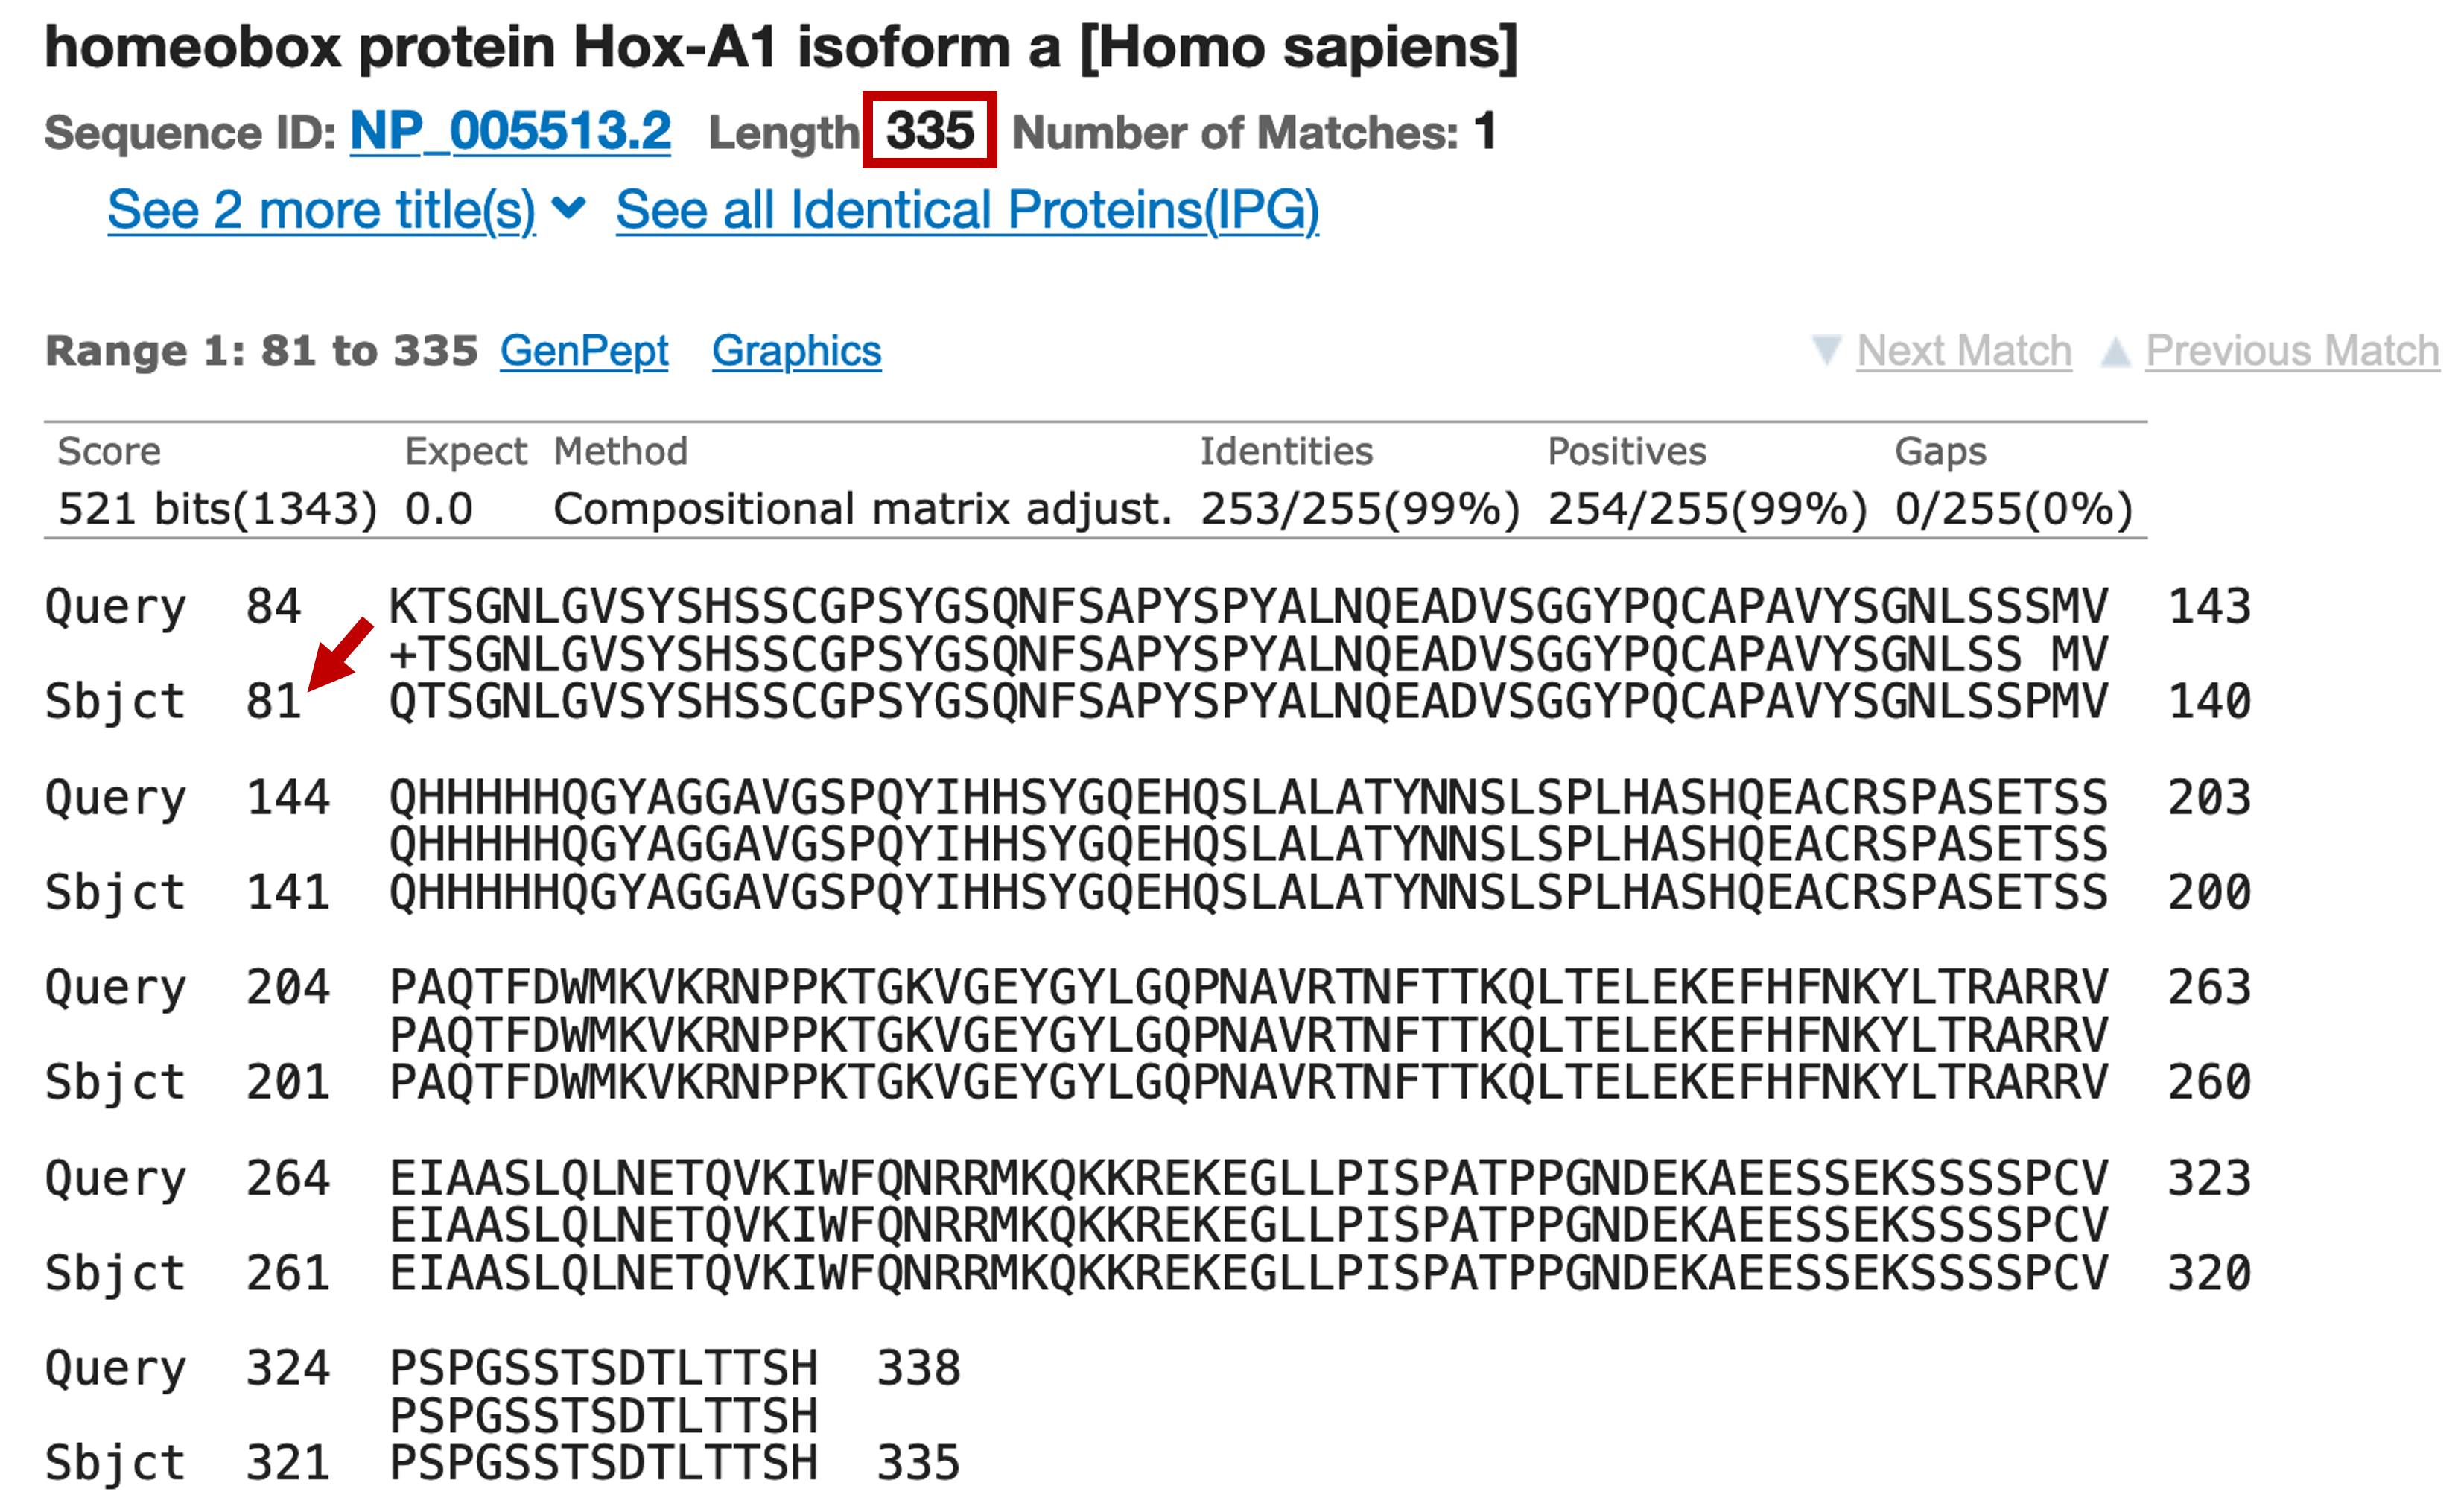
Go back to the blastp results page and then click on the "Descriptions" tab. The first RefSeq match with the "NP_" prefix is NP_005513.2 and it corresponds to the human homeobox protein Hox-A1 isoform a (Figure 35).
Click on the description link to jump to the alignments for this match (Figure 36). We find that the human Hox-A1 protein has a total length of 335 amino acids but the blastp alignment to the GENSCAN prediction only contains the last 255 amino acids (i.e., the first 80 amino acids of the protein are missing). However, the high degree of sequence similarity between the GENSCAN prediction and the human protein suggests the match is not spurious. To figure out what happened, we will have to perform BLAT searches with both the human Hox-A1 protein and our GENSCAN predicted peptide against the human genome.
Analysis of predicted and known proteins using the UCSC Genome Browser
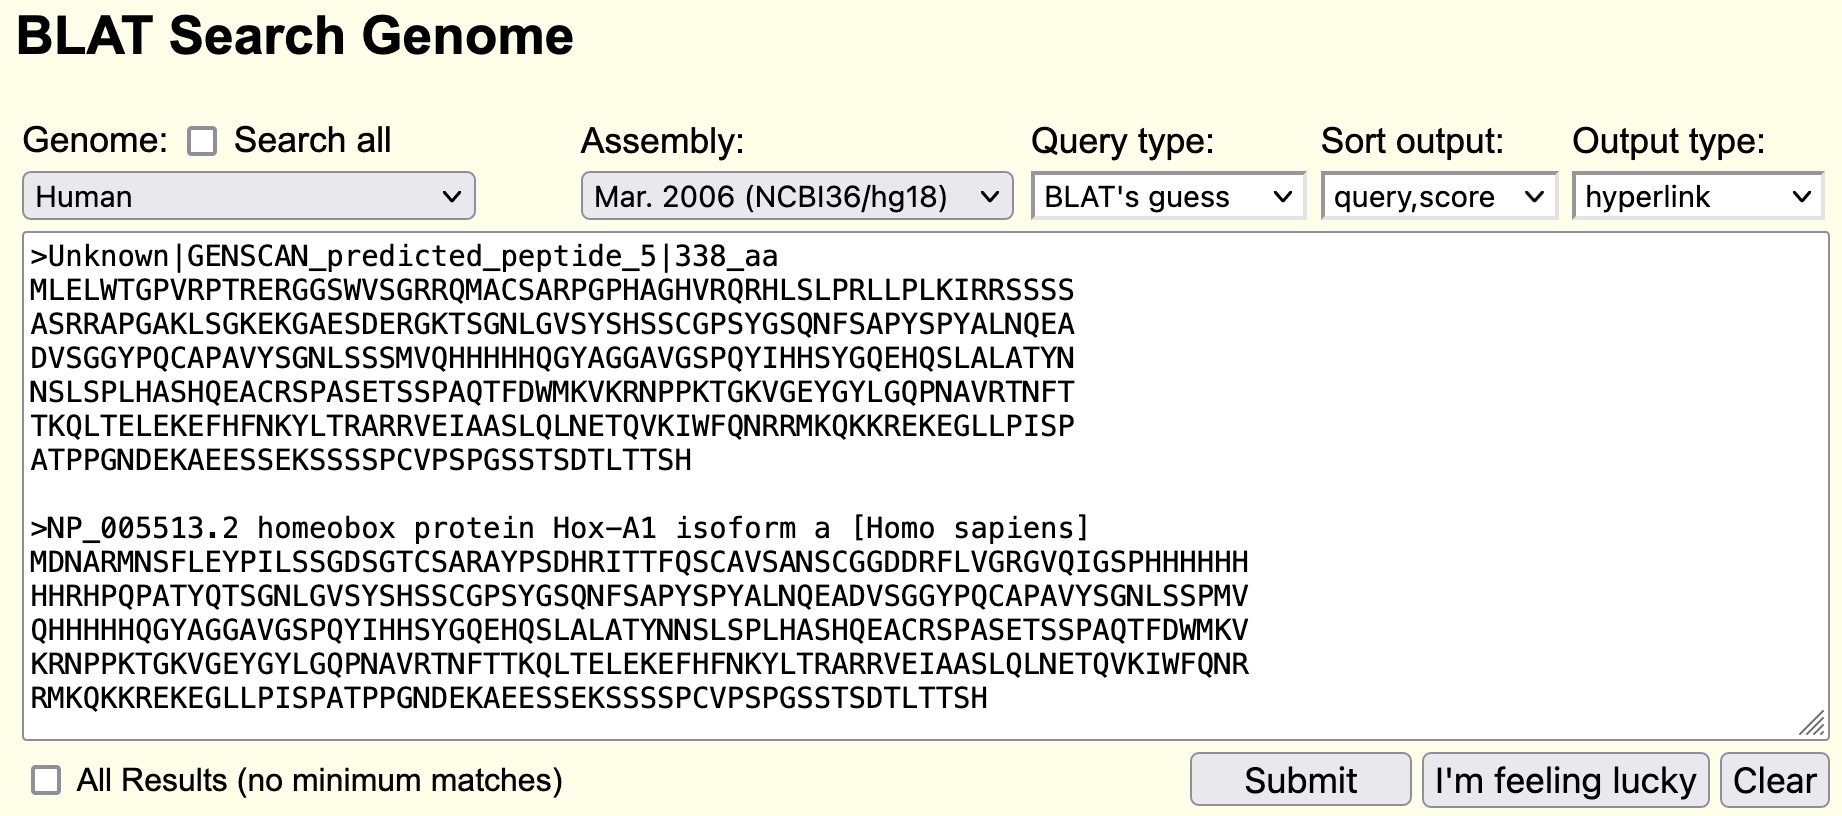
For this analysis against the human genome, we will perform a BLAT search using both the human Hox-A1 protein and our predicted protein. To demarcate the two sequence records, each of these two sequences must be preceded by a line starting with the ">" symbol followed by a description of the sequence. Obtain the predicted protein from the GENSCAN page and the Hox-A1 peptide sequence from its GenBank entry as we have done previously. Paste the peptide sequences from the GENSCAN prediction and the human Hox-A1 protein into the BLAT search box (Figure 37). Change the "Genome" to "Human", the "Assembly" to "Mar. 2006 (NCBI36/hg18)", and then click "Submit".
The top hits for our predicted protein and the human Hox-A1 protein are to the same region on human chromosome 7 (Figure 38). This result is consistent with the hypothesis that our predicted protein is the chimpanzee ortholog of the human Hox-A1 protein.
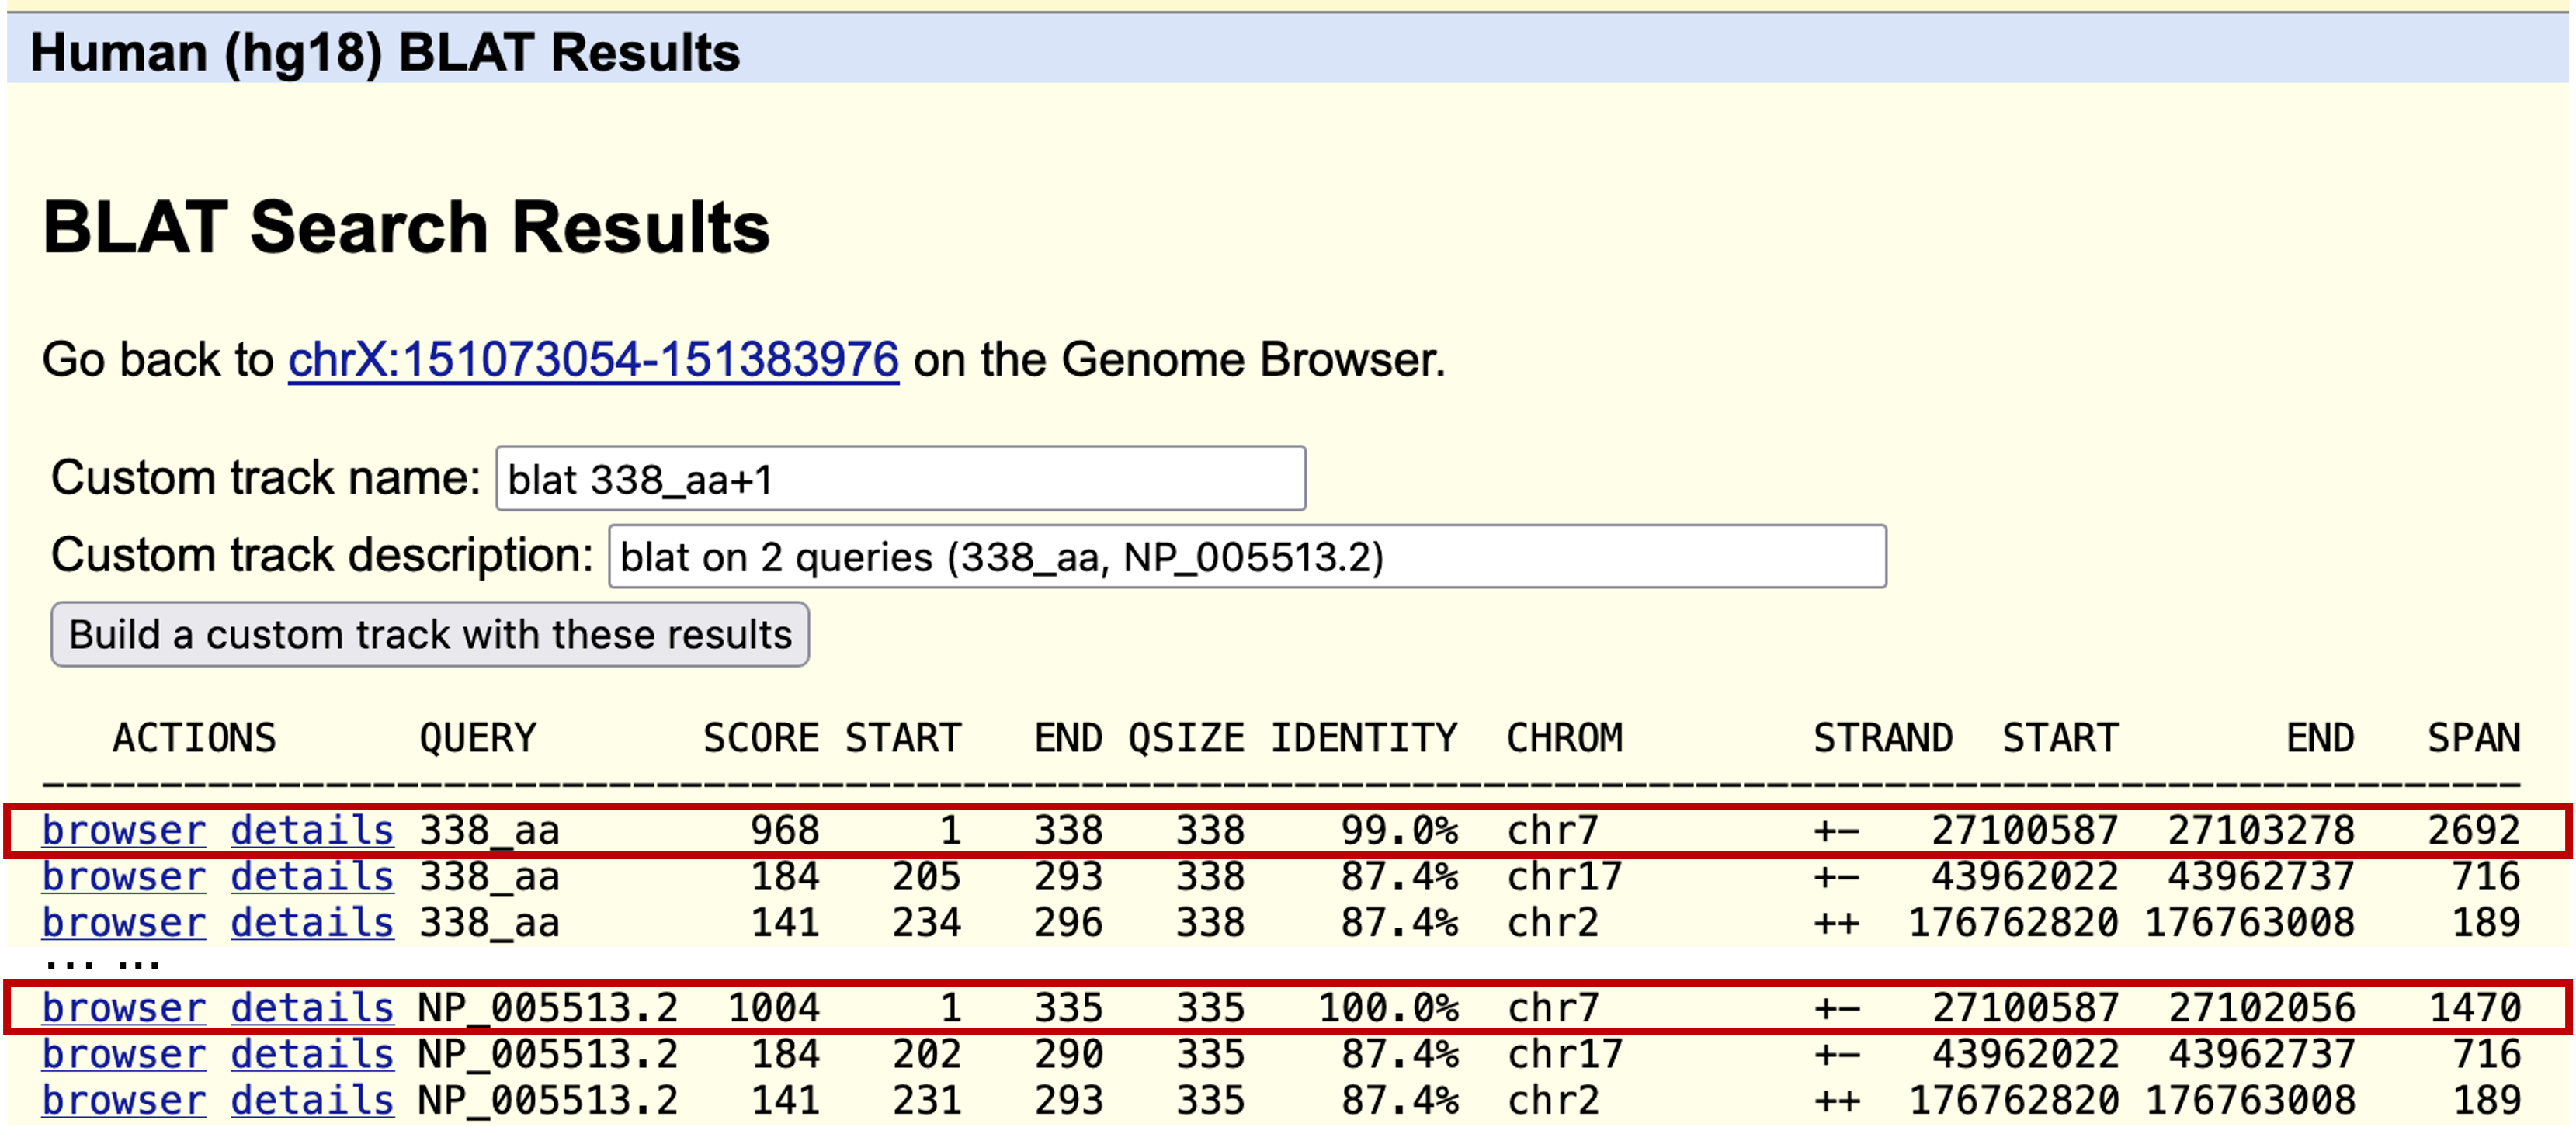
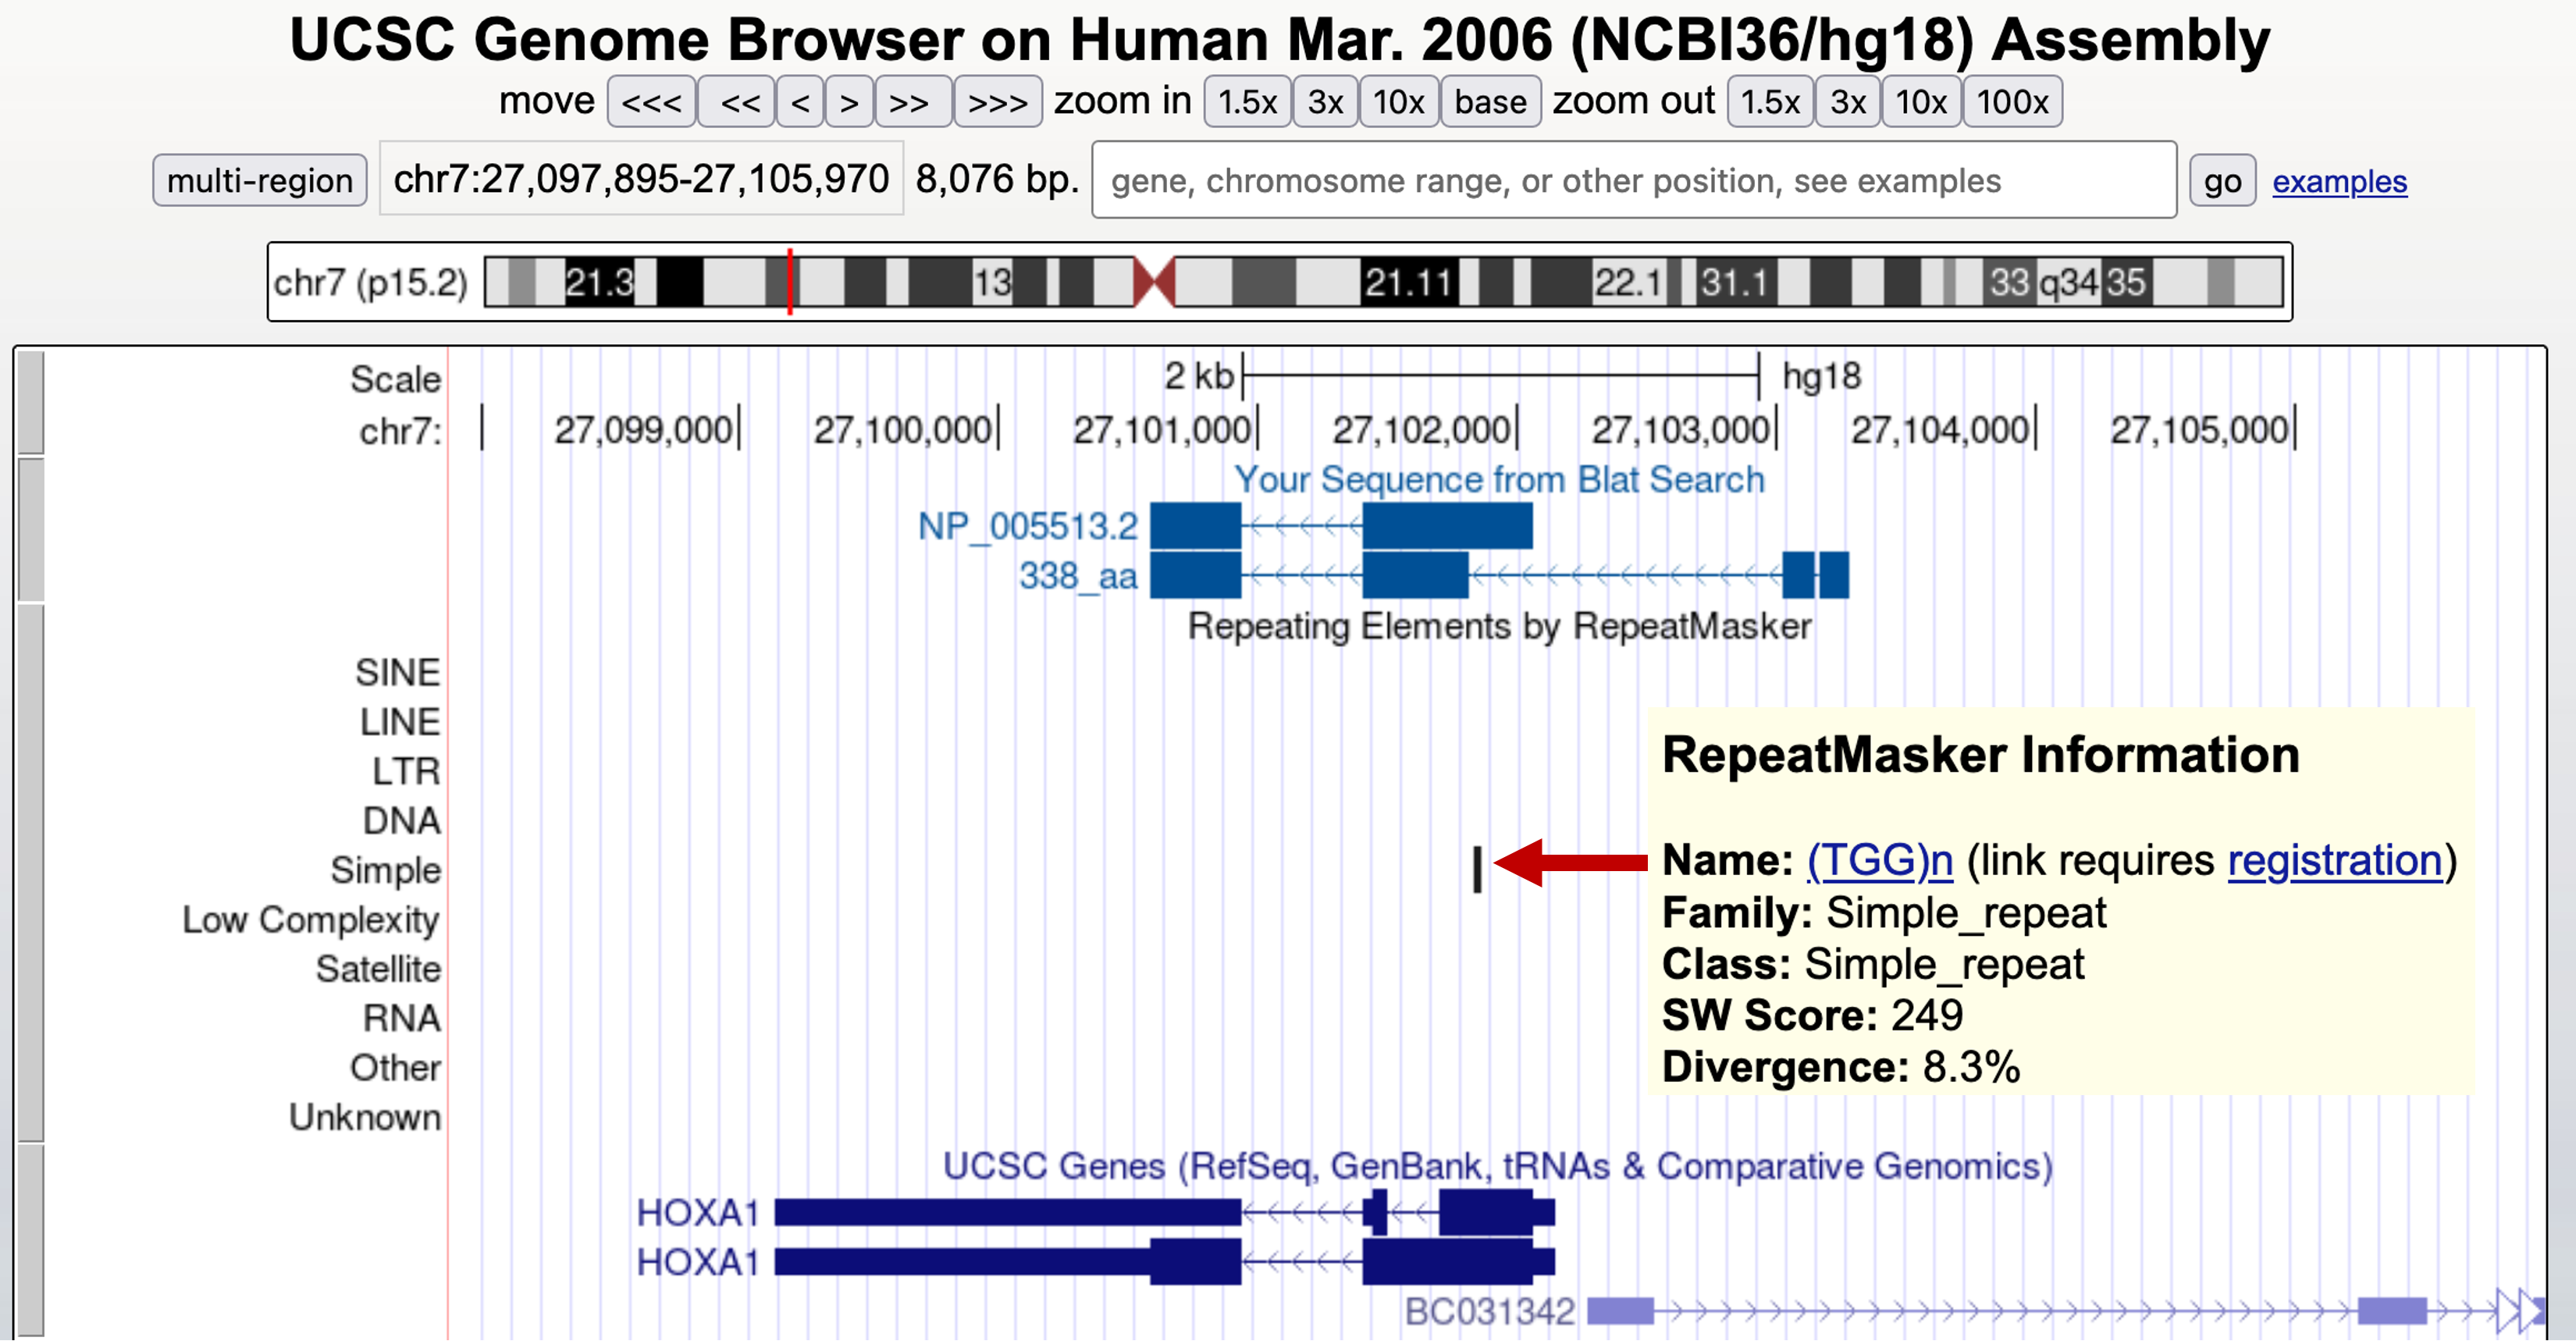
Click on the "browser" link for the best match on human chromosome 7 to examine the genomic region that contains the best hit to the GENSCAN prediction. Zoom out 3x and compare the two features under "Your sequences from Blat search." The names of the two features are identified by the names you entered after the ">" in the query textbox. The prediction (338_aa) and the Hox-A1 gene (NP_005513.2) cover the same region of the genome, except that the prediction has an additional intron stuck in the first exon of Hox-A1 (Figure 39).
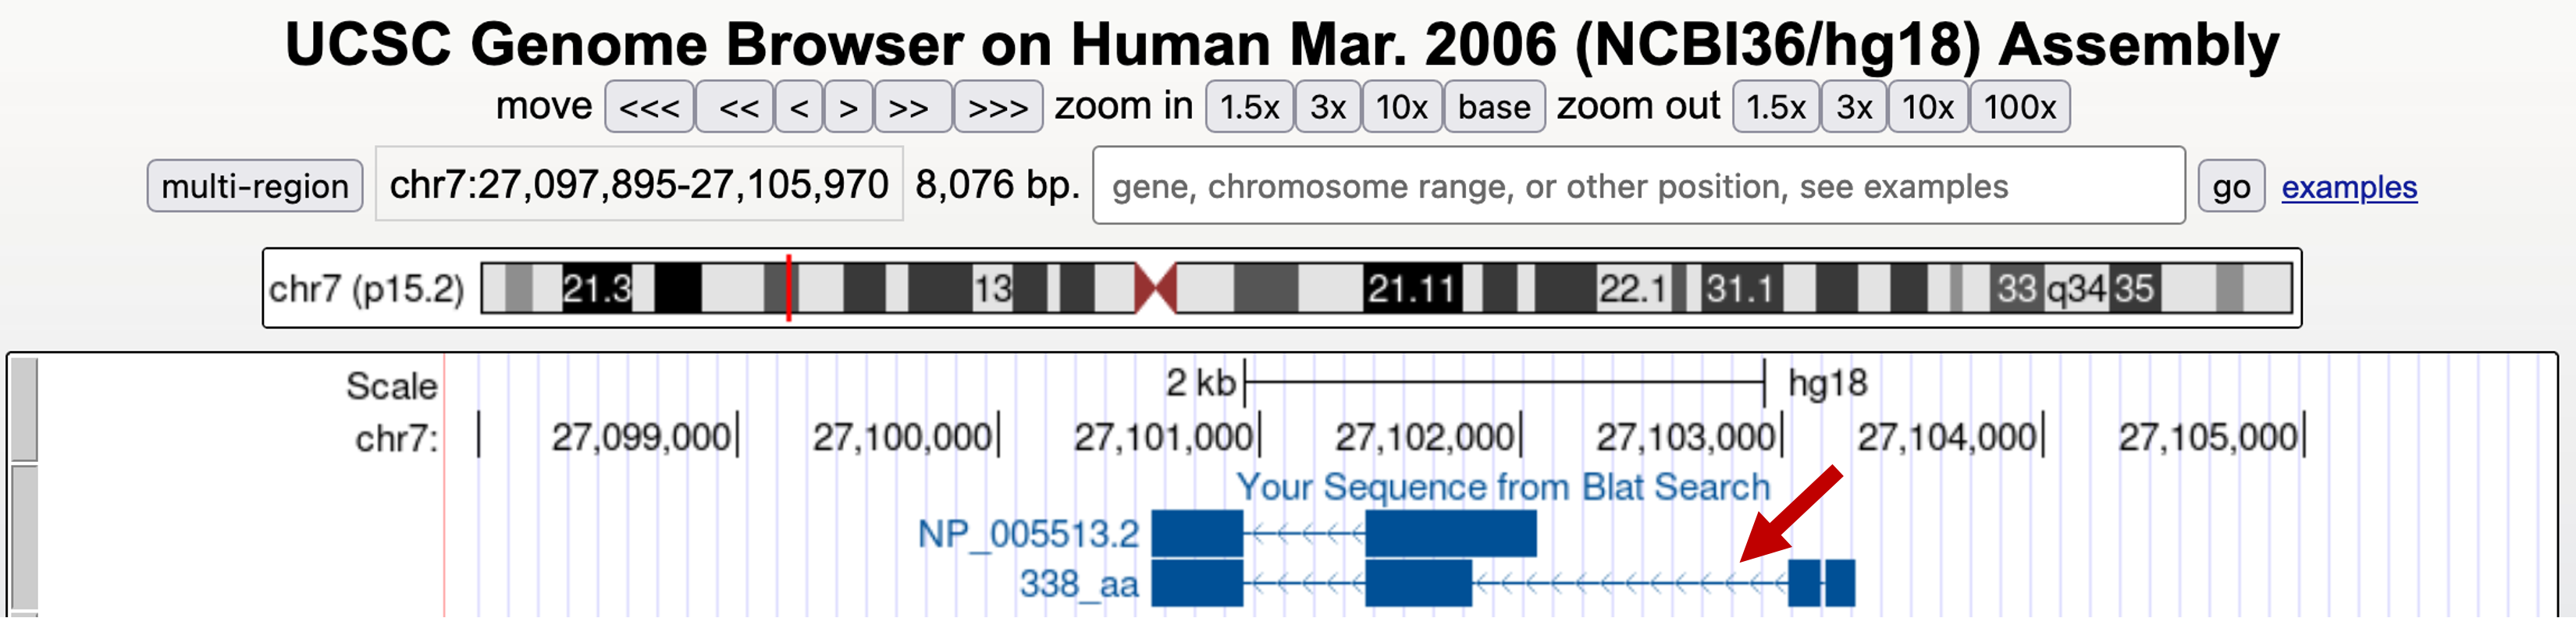
If you change the "RepeatMasker" track to "full" and look at that track below the spurious intron, you will see why GENSCAN predicted this intron (Figure 40). There is a simple repeat [(TGG)n] that covers the end of the predicted intron. It is not GENSCAN's fault that it got the prediction wrong; rather, it was because GENSCAN was run after low complexity sequences were removed. The presence of this masked sequence caused GENSCAN to make a faulty prediction. You can try to run GENSCAN without masking the sequence first. However, this could substantially increase the amount of time needed to complete the search.
Annotation of the remaining GENSCAN gene predictions
Now that you have seen the process of how to annotate potential genes using GENSCAN, BLAST, and the UCSC Genome Browser, you can try to annotate the remaining six genes predicted by GENSCAN in our chimp BAC, or in other regions of interests. Are they genes or pseudogenes? What kind of evidence can you obtain to support your hypothesis?