Prerequisites
-
BLAST Exercise: Detecting and Interpreting Genetic Homology
-
Familiarity with the concepts in the “Annotation Instruction Sheet”
Resources
-
The GEP UCSC Genome Browser Mirror and the Gene Record Finder are available through the “Resources & Tools” section of the F Element project page on the GEP website
Introduction
This worksheet will guide you through a series of basic steps that have been found to work well for the annotation of species closely related to Drosophila melanogaster. It describes a technique that can also be the foundation of annotation in other, more divergent species but in those cases more specialized techniques will probably be needed. The example given in this exercise uses a gene that is very highly conserved between D. melanogaster and D. grimshawi. Readers should consult the “Annotation Instruction Sheet” and the “Annotation Strategy Guide” for additional advice on how to approach annotation of genes with lower levels of sequence similarity.
While this worksheet will do some click-by-click guidance, some familiarity with the genome browser and the NCBI BLAST pages is assumed. Users who are completely unfamiliar with these sites may wish to familiarize themselves with the use of these pages before attempting to use it in this annotation exercise. There are online tutorials and user guides available on the use of the browser at the “Getting Help with the UCSC Genome Browser” webpage. Training materials for BLAST are available online through the NCBI and GEP websites.
Identifying the Ortholog
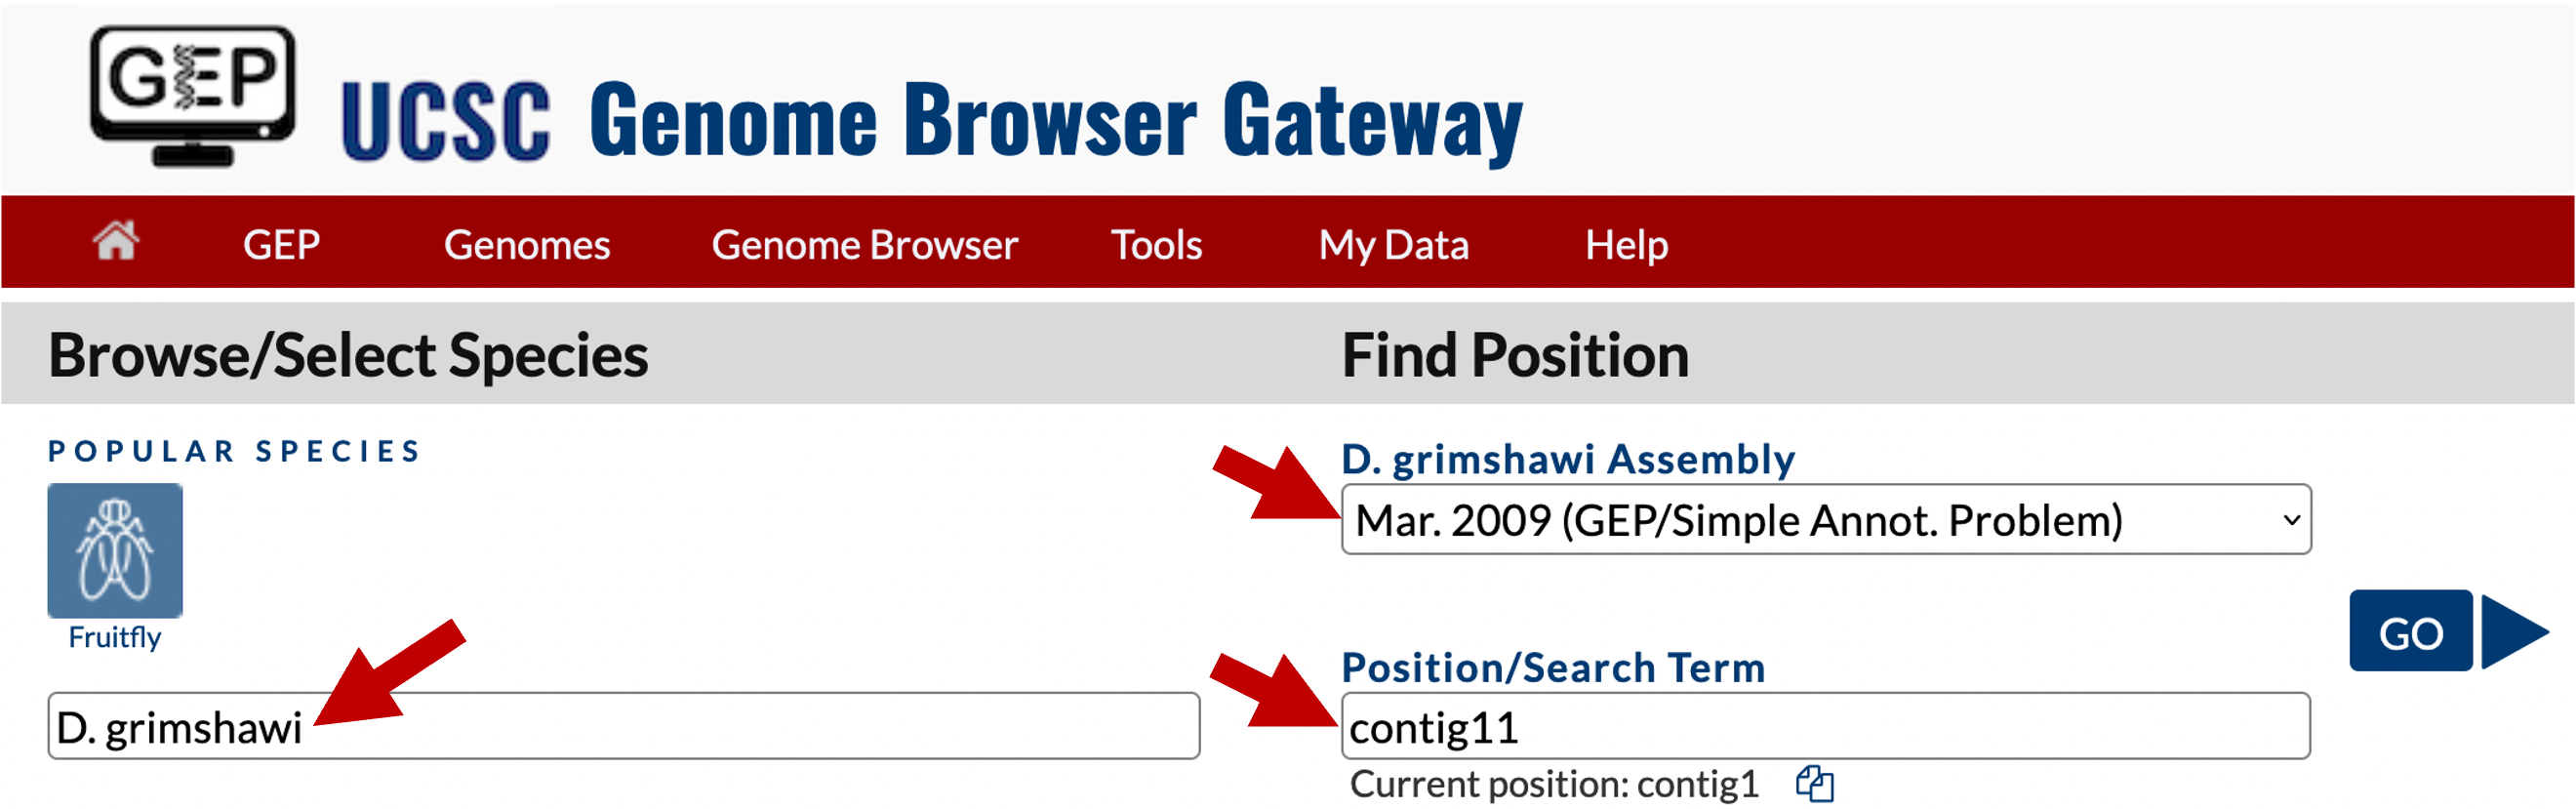
The first step in annotating a potential feature is to identify the D. melanogaster ortholog. Go to the UCSC Genome Browser Mirror site. Click on “Genome Browser” in the left-hand column and then enter “D. grimshawi” in the “Enter species, common name or assembly ID” text box. Select “Mar. 2009 (GEP/Simple Annot. Problem)” under the “D. grimshawi Assembly” field. Enter “contig11” in the “Position/Search Term” field, and then click on the “GO” button (Figure 1).
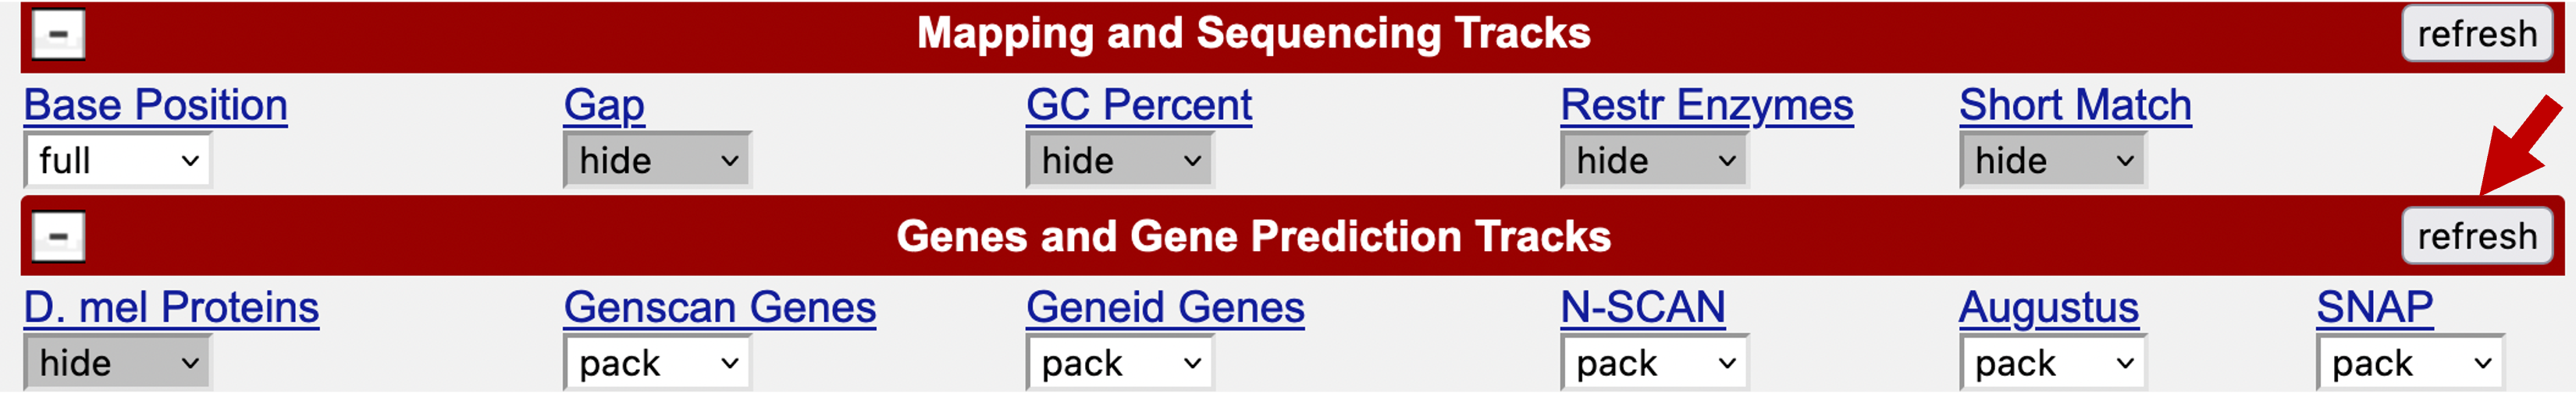
Because the genome browser remembers the previous display settings, we will hide all the evidence tracks and then turn on the evidence tracks that we will use in this exercise. Click on the “hide all” button beneath the genome browser image. Scroll down to the track configuration section at the bottom of the page. Use the drop-down boxes to change the display mode for the “Base Position” track to “full”, and the display modes for all the gene predictors (i.e., Genscan Genes, Geneid Genes, N-SCAN, Augustus, and SNAP) to “pack”. Click on one of the “refresh” buttons to update the image (Figure 2).
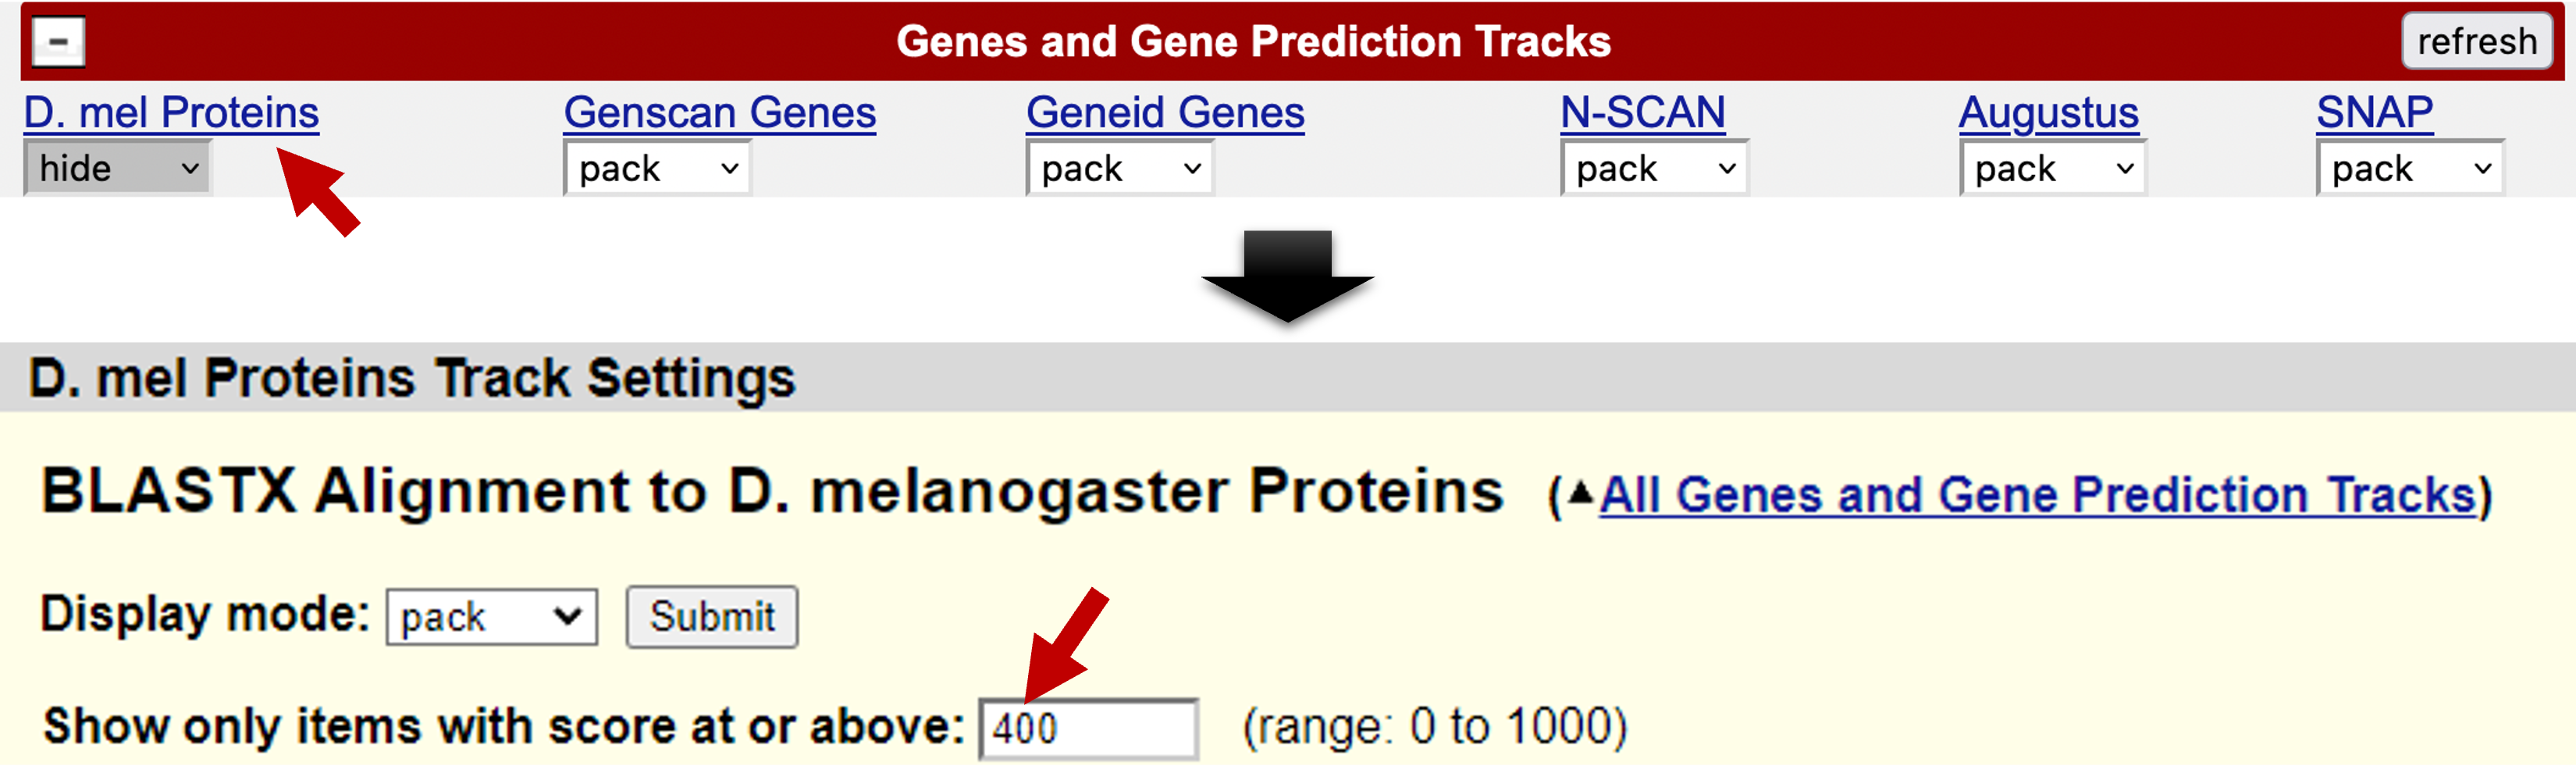
You can learn about each evidence track and access additional display settings when you click on the title of each track. For example, to change the display settings for the “D. mel Proteins” track so that it matches the images in this worksheet, click on the title “D. mel Proteins” in the track configuration section (Figure 3, top). On the page that comes up, select “pack” on the drop-down menu next to “Display mode” and enter 400 in the box labeled “Show only items with score at or above:” (Figure 3, bottom). Finally, click the “Submit” button.
This will take you back to the main image with the new display settings where this track has been expanded to give more detailed information (Figure 4).
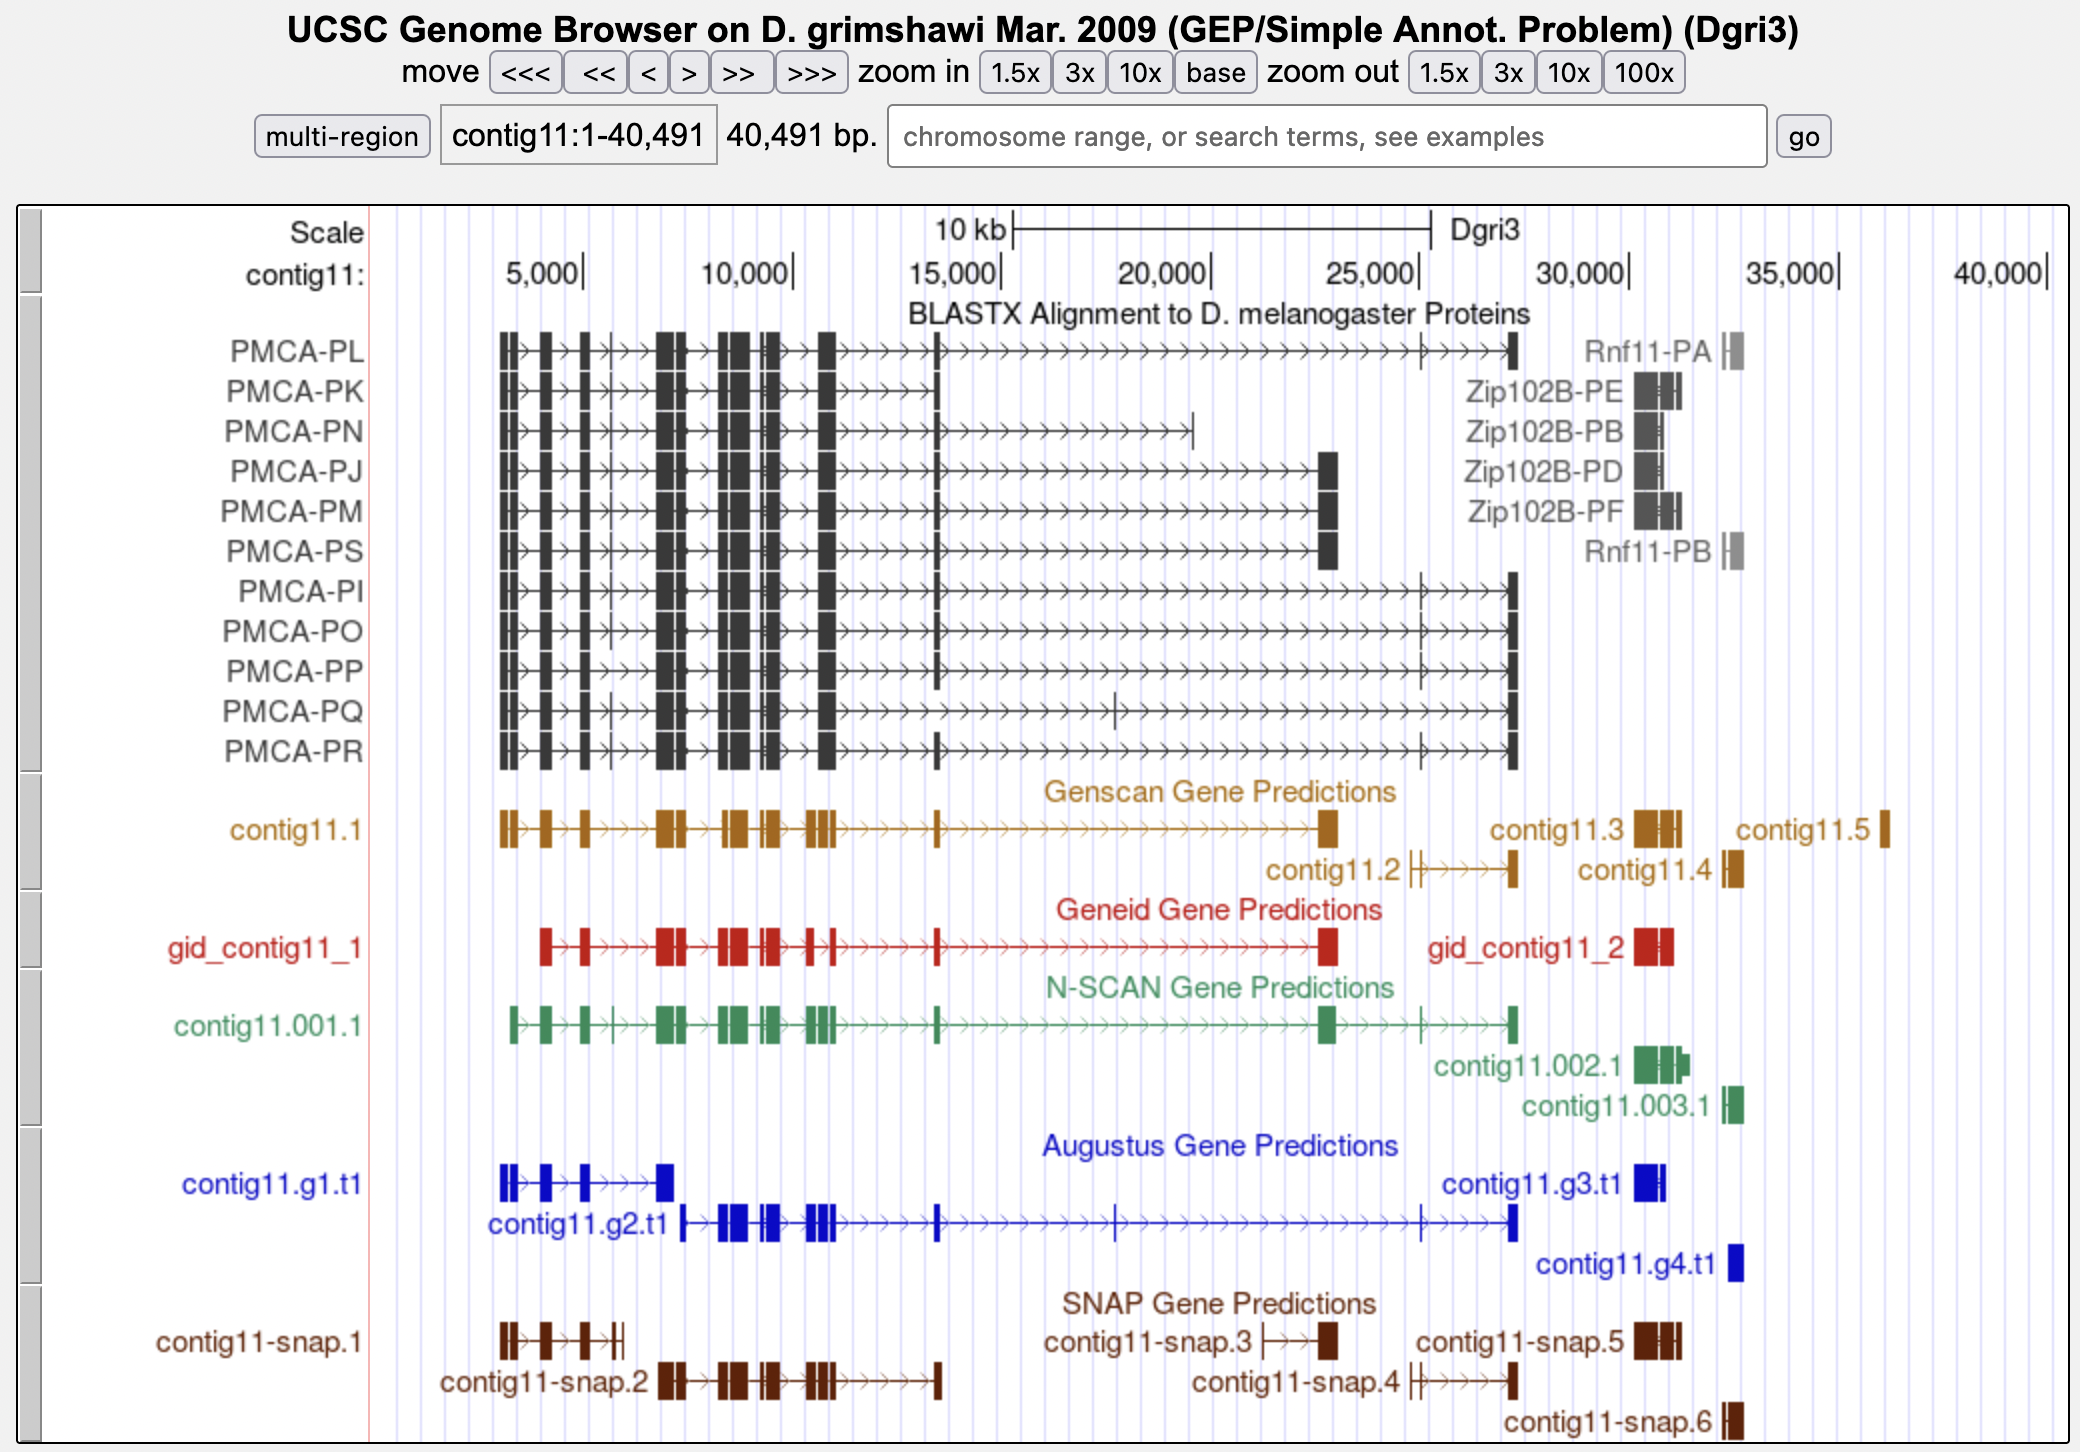
The “BLASTX alignment to D. melanogaster Proteins” track shows the location of all the BLAST alignments that resulted from using this sequence (contig11) to search the database of all D. melanogaster proteins. It is used in the D. grimshawi projects to indicate conservation. You may find when working with projects from other species that this track is replaced by a track called “RefSeq Genes”. These two tracks are both used to show regions of similarity with D. melanogaster proteins but use slightly different search algorithms. For the purposes of annotation these differences are trivial and unimportant. For either track, there are a few things to note.
-
If more than one alignment block comes from the same protein, the blocks are connected with a thin line covered with arrowheads
-
Sometimes these alignment tracks show directionality. Be aware that the arrow showing directionality is in general unreliable, especially in cases where the matches are DNA to DNA. You should confirm the directionality of the match by performing an additional BLAST search.
-
Note that the alignment blocks are only showing regions with high sequence similarity. These tracks will only mark an entire exon if conservation extends across the whole exon. The extent of the alignment will mostly depend on how closely related the species is to D. melanogaster. Hence it is not possible to infer gene structure (number and placement of exons) based on these tracks. Exons with little or no conservation may be missed while large exons with multiple conserved domains may be broken into multiple smaller alignment blocks.
Which D. melanogaster proteins appear to match well to the Genscan feature contig11.1 based on the blastx alignment track?
Now that we are done examining the “D. mel Proteins” track in detail you may wish to change the setting back to “dense” to simplify the display. While the blastx alignments shown on this track can give us some hints as to the potential for an ortholog, this should be confirmed with a BLAST search at FlyBase.
Use the protein sequence of Genscan contig11.1 to search a database of all D. melanogaster proteins. To do this, click on Genscan contig11.1 in the browser window. This will take you to an information page. Select Predicted Protein and copy the resulting data. Now you can use the FlyBase BLAST service to do the search. Provide a copy of the top 20 hits and briefly describe the results.
We will proceed with our analysis with the assumption that this region does indeed contain the ortholog for PMCA.
Exon by Exon searches
While the Genscan prediction show significant matches to PMCA, it does not necessarily mean that the predicted gene model is correct. In fact, published accuracy rates for most ab initio gene prediction algorithms are in the range of 20–30%. Hence it is more likely than not that the Genscan prediction is actually wrong (i.e., not perfect). Without detailed analysis of the alignment between the contig11.1 and PMCA we have no way of knowing. Common errors generated by Genscan and other ab initio gene prediction algorithms include skipped exons and errors involving the ends of the gene (e.g., split genes, fused two genes).
For now, all we know is that BLAST has aligned at least some of contig11.1 with at least some of PMCA in D. melanogaster and the total sum of all the alignments gives us a good E-value. Therefore, the similarity searches have convinced us that PMCA is probably in here somewhere and it overlaps with the Genscan prediction to a large enough extent to give a very good BLAST E-value. The next step then is to use BLAST searches to find the best matches to the D. melanogaster PMCA exons, as these matches will be the best evidence we can gather as to the structure of this new gene in D. grimshawi. By using exon-by-exon searches, we will avoid confusion that often comes from the way BLAST calculates alignments. For this exercise, we will only work on the first few exons of the whole gene, full annotation of this gene would require mapping ALL coding exons for ALL isoforms and creating viable gene models of each isoform.
In order to do exon-by-exon searches we will need the sequence of each exon. These sequences can be obtained from many different databases. However, this information is most easily obtained from the “Gene Record Finder”. This tool is available through the “Resources & Tools” section of the F Element project page on the GEP website. Enter “PMCA” into the search box to obtain the information on this gene and click on the “Find Record” button.
Put a copy (screen capture) of the CDS usage map (under the Polypeptide details tab) for the gene PMCA in your response and answer these questions: How many isoforms exist for this gene? How do these isoforms differ with respect to the coding exons?
To map each putative exon position, we will use the “Align two or more sequences” functionality in NCBI BLAST to compare two sequences (i.e., bl2seq). In this case, we will compare the entire contig11 sequence against the D. melanogaster CDS sequence to search for any region within the contig11 DNA sequence that could code for a similar CDS.
Go to the NCBI BLAST website and compare the entire contig11 sequence against the amino acid sequence of the first coding exon of PMCA using the blastx program. You can retrieve the sequence for CDS 1_12094_0 by clicking on the first row in the CDS sequence table at the bottom of the Gene Record Finder output. You can obtain the contig11 sequence through the “DNA” link under the “View” menu of the main toolbar on the GEP UCSC Genome Browser mirror.
Be sure that the “low complexity regions” are NOT filtered and that neither masking technique is being used. (You can find these settings under the “Algorithm parameters” subsection.) In addition, we will change the “Compositional adjustments” field to “No adjustment” because we are only comparing two sequences. The figure below shows the results of this blastx search (available under the “Alignments” tab; Figure 5):
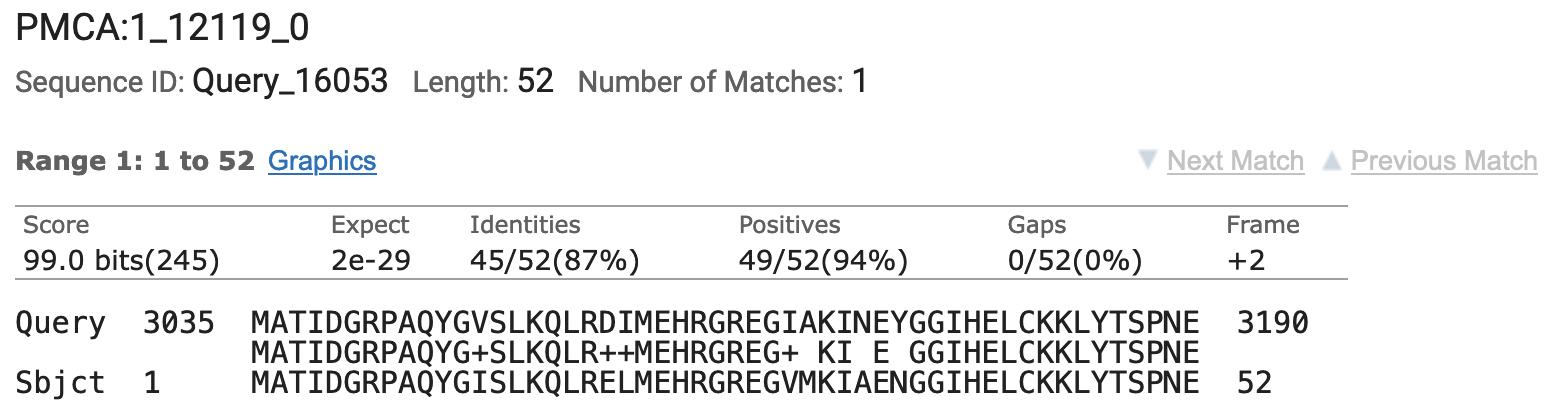
By using the whole contig11 in our search we can read the base coordinates of the alignment directly. The beginning of this gene appears to be very highly conserved between D. melanogaster and D. grimshawi. The blastx alignment begins at base 3035 and ends at 3190. These bases were translated in frame +2 to obtain the similar amino acids. Finally, we note that the entire 52 amino acids of the coding exon aligned to this region of the contig11 and the alignment begins with the translation start site (M) at 3035.
Repeat the same BLAST searches with the next two exons; copy the best alignments below, (when copying alignments be sure to include the header information). What is the DNA base coordinates of the start and end of each alignment? Which frame was translated to give the amino acids in each alignment?
If you were going to annotate this entire gene you would continue down the line searching for sequences similar to each exon. You may find some exons difficult or impossible to find, especially if they are small and/or not well conserved (e.g. CDS 5_12094_2). See the “Annotation Instruction Sheet” for strategies on how to deal with small or difficult to find exons. For this worksheet, we will attempt to find the exact boundaries for the first few exons and will leave the rest of the gene as an exercise for the reader.
Annotating exon boundaries
Now that we have identified the putative positions for the first few exons we can attempt to find the exact splice positions that would create a gene that links these exons together.
Use your genome browser to navigate to the end of the first exon. From the alignment above we suspect the end to be very close to base 3190. We can enter the coordinates “contig11:3170-3220” in the “enter position or search terms” text box to jump directly to this region. This region is shown in Figure 6.
|
|
Make sure that the “Base Position” track is set to “full” so that you can see the amino acid translation. Change the “Predicted Splice Sites” track to “dense” so that you can see the splice site predictions. |
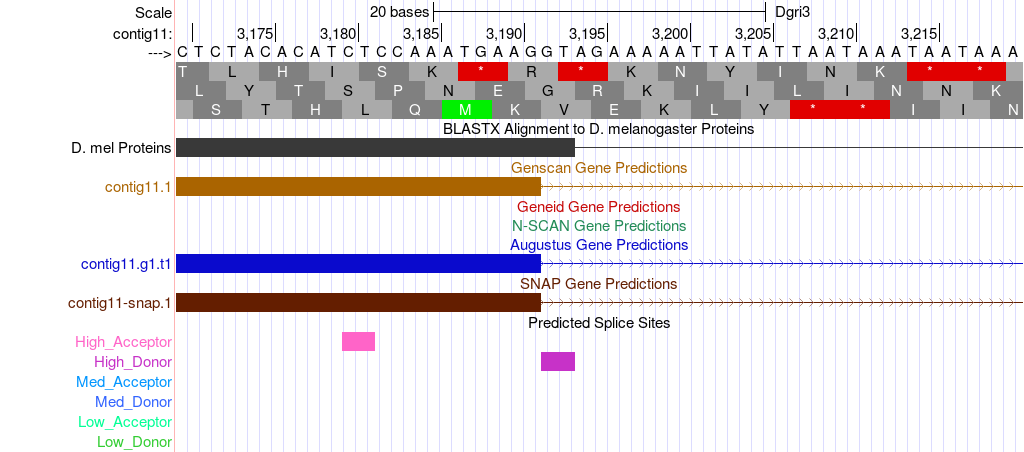
From the alignment above we know that the similar amino acids are found in frame +2. We should screen this region for potential splice donor sites. In this case there is only one potential “GT” donor at bases 3192-3193. This donor site puts the end of the exon at base 3191. We can see by careful inspection that a cleavage here would leave a single nucleotide (G) after the last complete codon in frame +2 (the E). We use the term “phase” to describe these left-over bases, in this case the exon that ends at 3191 is said to be in phase 1 since one nucleotide is left after the last complete codon. To make a complete gene we must find an acceptor site such that this one base will join with two other bases in the next exon to make a complete codon. For now, we simply note that the only available donor site in this region is in phase 1.
Using your genome browser, navigate to the region where you suspect the next exon begins based on the alignments you found in question 4. Intron acceptor sites usually have the sequence “AG” just before the first base of the exon.
Look around the region where the alignment to exon 2_12094_2 begins. How many acceptor sites can you find? Considering the frame of the conserved amino acids you found in question 4, what is the phase of each putative acceptor site you find? Using just the phase information which, if any, of these acceptor sites is/are usable to maintain the proper translation frame throughout the first two exons. Itemize what other evidence you could consider if you have two or more possible donor/acceptor pairs. Finally record the base coordinates for exon 1 and the beginning of exon 2 based on your complete analysis.
Use the results of the alignment of the second and third exons in question 4 to locate the coordinates for the second and third exons. Report the coordinates for the first three exons of PMCA below:
| Exon | Start Position | End Position |
|---|---|---|
Exon #1 |
||
Exon #2 |
||
Exon #3 |
Full annotation of this gene would proceed to each subsequent exon, putative donors and acceptors would be analyzed for phase and all putative combinations would be compared to find the donor/acceptor pair with the most support.
Now use the same process to annotate one more exon as assigned in class.
Assigned Exon: __________
Exon Start Position: __________
Exon End Position: __________