Prerequisites
Resources
-
The package containing the files for this exercise is available through the “Using mRNA and EST Evidence in Annotation” page on the GEP website.
Introduction
One approach to identifying potentially interesting genes or gene-like features is to use a database of cDNAs. cDNAs are useful for gene identification because they are made from mRNAs and reflect the expressed regions of a genome. To make large-scale cDNA sequencing both temporally and financially feasible, cDNA clones are taken at random, and either one or both ends of the cDNA are sequenced. Each cDNA clone is sequenced in just one pass, much like individual genomic reads. These sequences are generally referred to as Expressed Sequence Tags (ESTs). Hence, ESTs are low-quality nucleic acid sequences with all the same problems as single reads. Most ESTs represent only a part of the cDNA (one end or the other). However, they can be used as building blocks for constructing more completely annotated mRNAs, such as some of the sequences found in the RefSeq mRNA database.
In addition to the relatively low quality of EST reads (approximately 2% error), ESTs also have other limitations. Typically, normalization procedures are used to allow rare transcripts to be sampled. However, there still exists the possibility that, by chance, rare transcripts may be missed entirely due to their low level of representation or because it is not in a given library. Transcripts may also be missed because they are not expressed in the tissues, cell types, or developmental stages that were used to construct the various cDNA libraries. (See the NCBI Handbook for more information.) In this exercise, we will use mRNA and EST sequences to direct and verify our annotation efforts.
Much of this exercise consists of questions, which you should try to answer as you work through this tutorial. As you work, you should make note of the BLAST and RepeatMasker parameters and the databases you used for your searches to ensure that the results can be reproduced. Since the sequence and the corresponding BLAST output are large, we recommend that you either use the pre-computed RepeatMasker and BLAST output included in the tutorial package, or run the searches using the command-line version of RepeatMasker and NCBI BLAST. Running these searches using the publicly available web interfaces might require substantial amount of time.
|
|
The command-line version of RepeatMasker is available as part of the TETools Docker and Singularity images provided by the Dfam consortium. The Docker images for NCBI BLAST+ (ncbi/blast) are available on Docker Hub. |
Masking interspersed repeats in the contig sequence
In this exercise, we will annotate a contig (contig95.fna in the tutorial package) from the chimpanzee genome. Before we begin our analysis, we should first mask interspersed repeats in the sequence using RepeatMasker. We will then search the repeat masked sequence against the manually curated Swiss-Prot database using blastx.
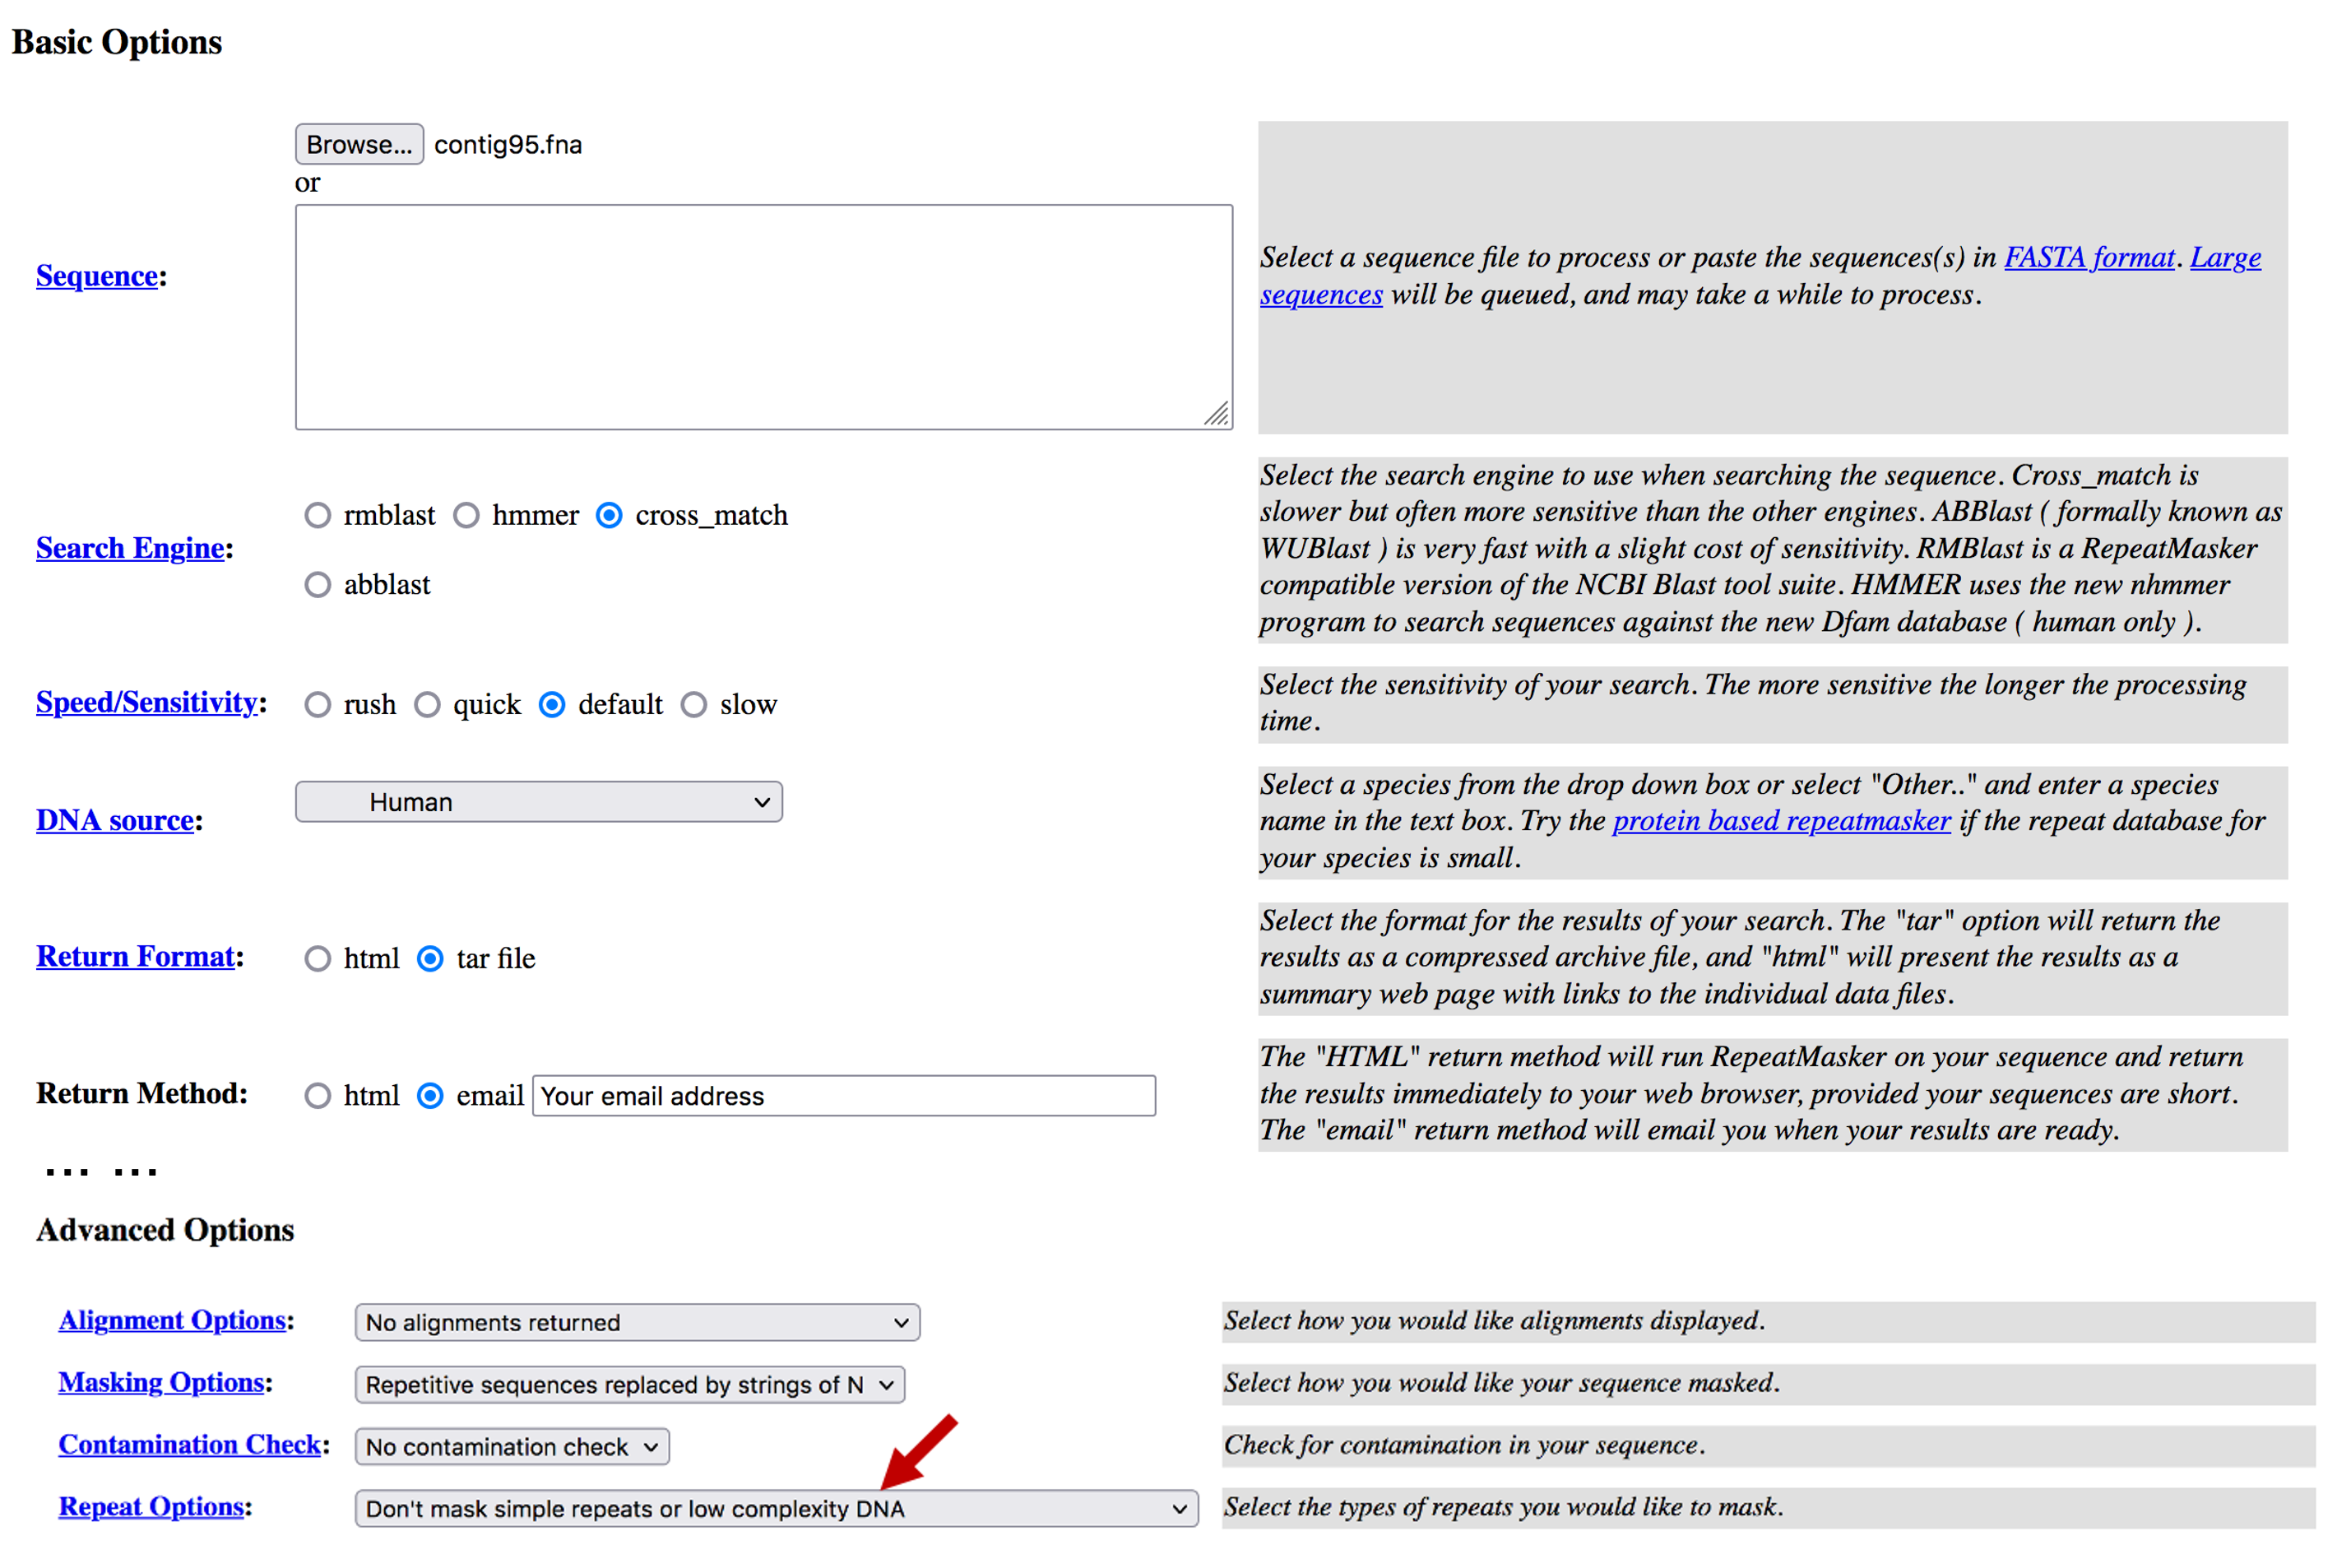
Navigate to the RepeatMasker web server and click on the “RepeatMasking” link under “Services”. Customize the RepeatMasker search by setting the following parameters (Figure 1):
-
Click on the “Browse” or the “Choose File” button and select the input sequence file “contig95.fna”
-
Change the “Search Engine” to “cross_match”
-
Select “Human” under “DNA Source” to use the Dfam human repeat library
-
Change the “Return Format” to “tar file”
-
Change the “Return Method” to “email”, and enter your Email address
-
Since BLAST will filter out low complexity regions when appropriate, we will tell RepeatMasker not to mask low complexity regions. Under “Advanced Options”, change “Repeat Options” to “Don’t mask simple repeats or low complexity DNA”
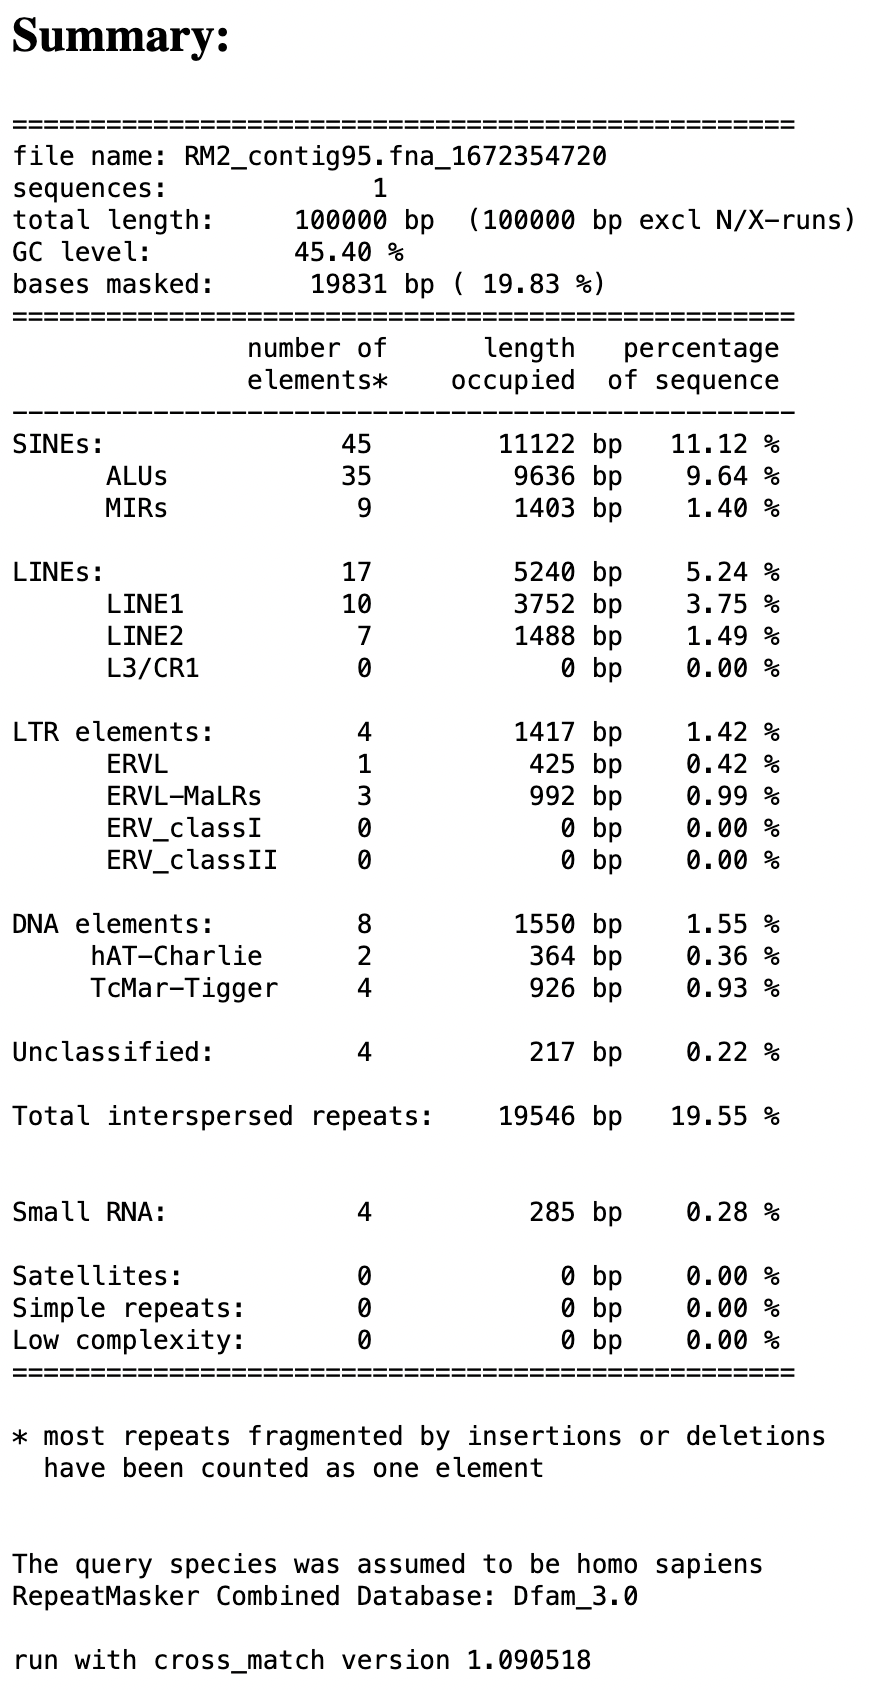
For the purposes of this exercise, RepeatMasker has already been run on our sequence (Figure 2). The output from RepeatMasker is available in the tutorial package inside the “RepeatMasker_results” folder. The folder contains the following files:
| Suffix | File Name | Description |
|---|---|---|
.masked |
contig95.fna.masked |
The input sequence with the repetitive regions masked with the character N |
.tbl |
contig95.fna.tbl |
Summary of the total repeat content of the input sequence |
.out |
contig95.fna.out |
List of repetitive elements in the input sequence and their locations |
.align |
contig95.fna.align |
Alignments between the input sequence and the repetitive elements identified by RepeatMasker |
.out.html |
contig95.fna.out.html |
Web page which contains the list of repetitive elements in the input sequence, their locations and alignments |
Initial analysis: blastx search of contig against the Swiss-Prot database
Now that we have the masked the repetitive elements in the contig sequence, we can annotate our sequence by comparing it with a database of known proteins. In the initial analysis, we will perform a blastx search using the repeat masked sequence and look for sequence homology to proteins in the manually curated Swiss-Prot database. We will configure our blastx search using the following steps:
-
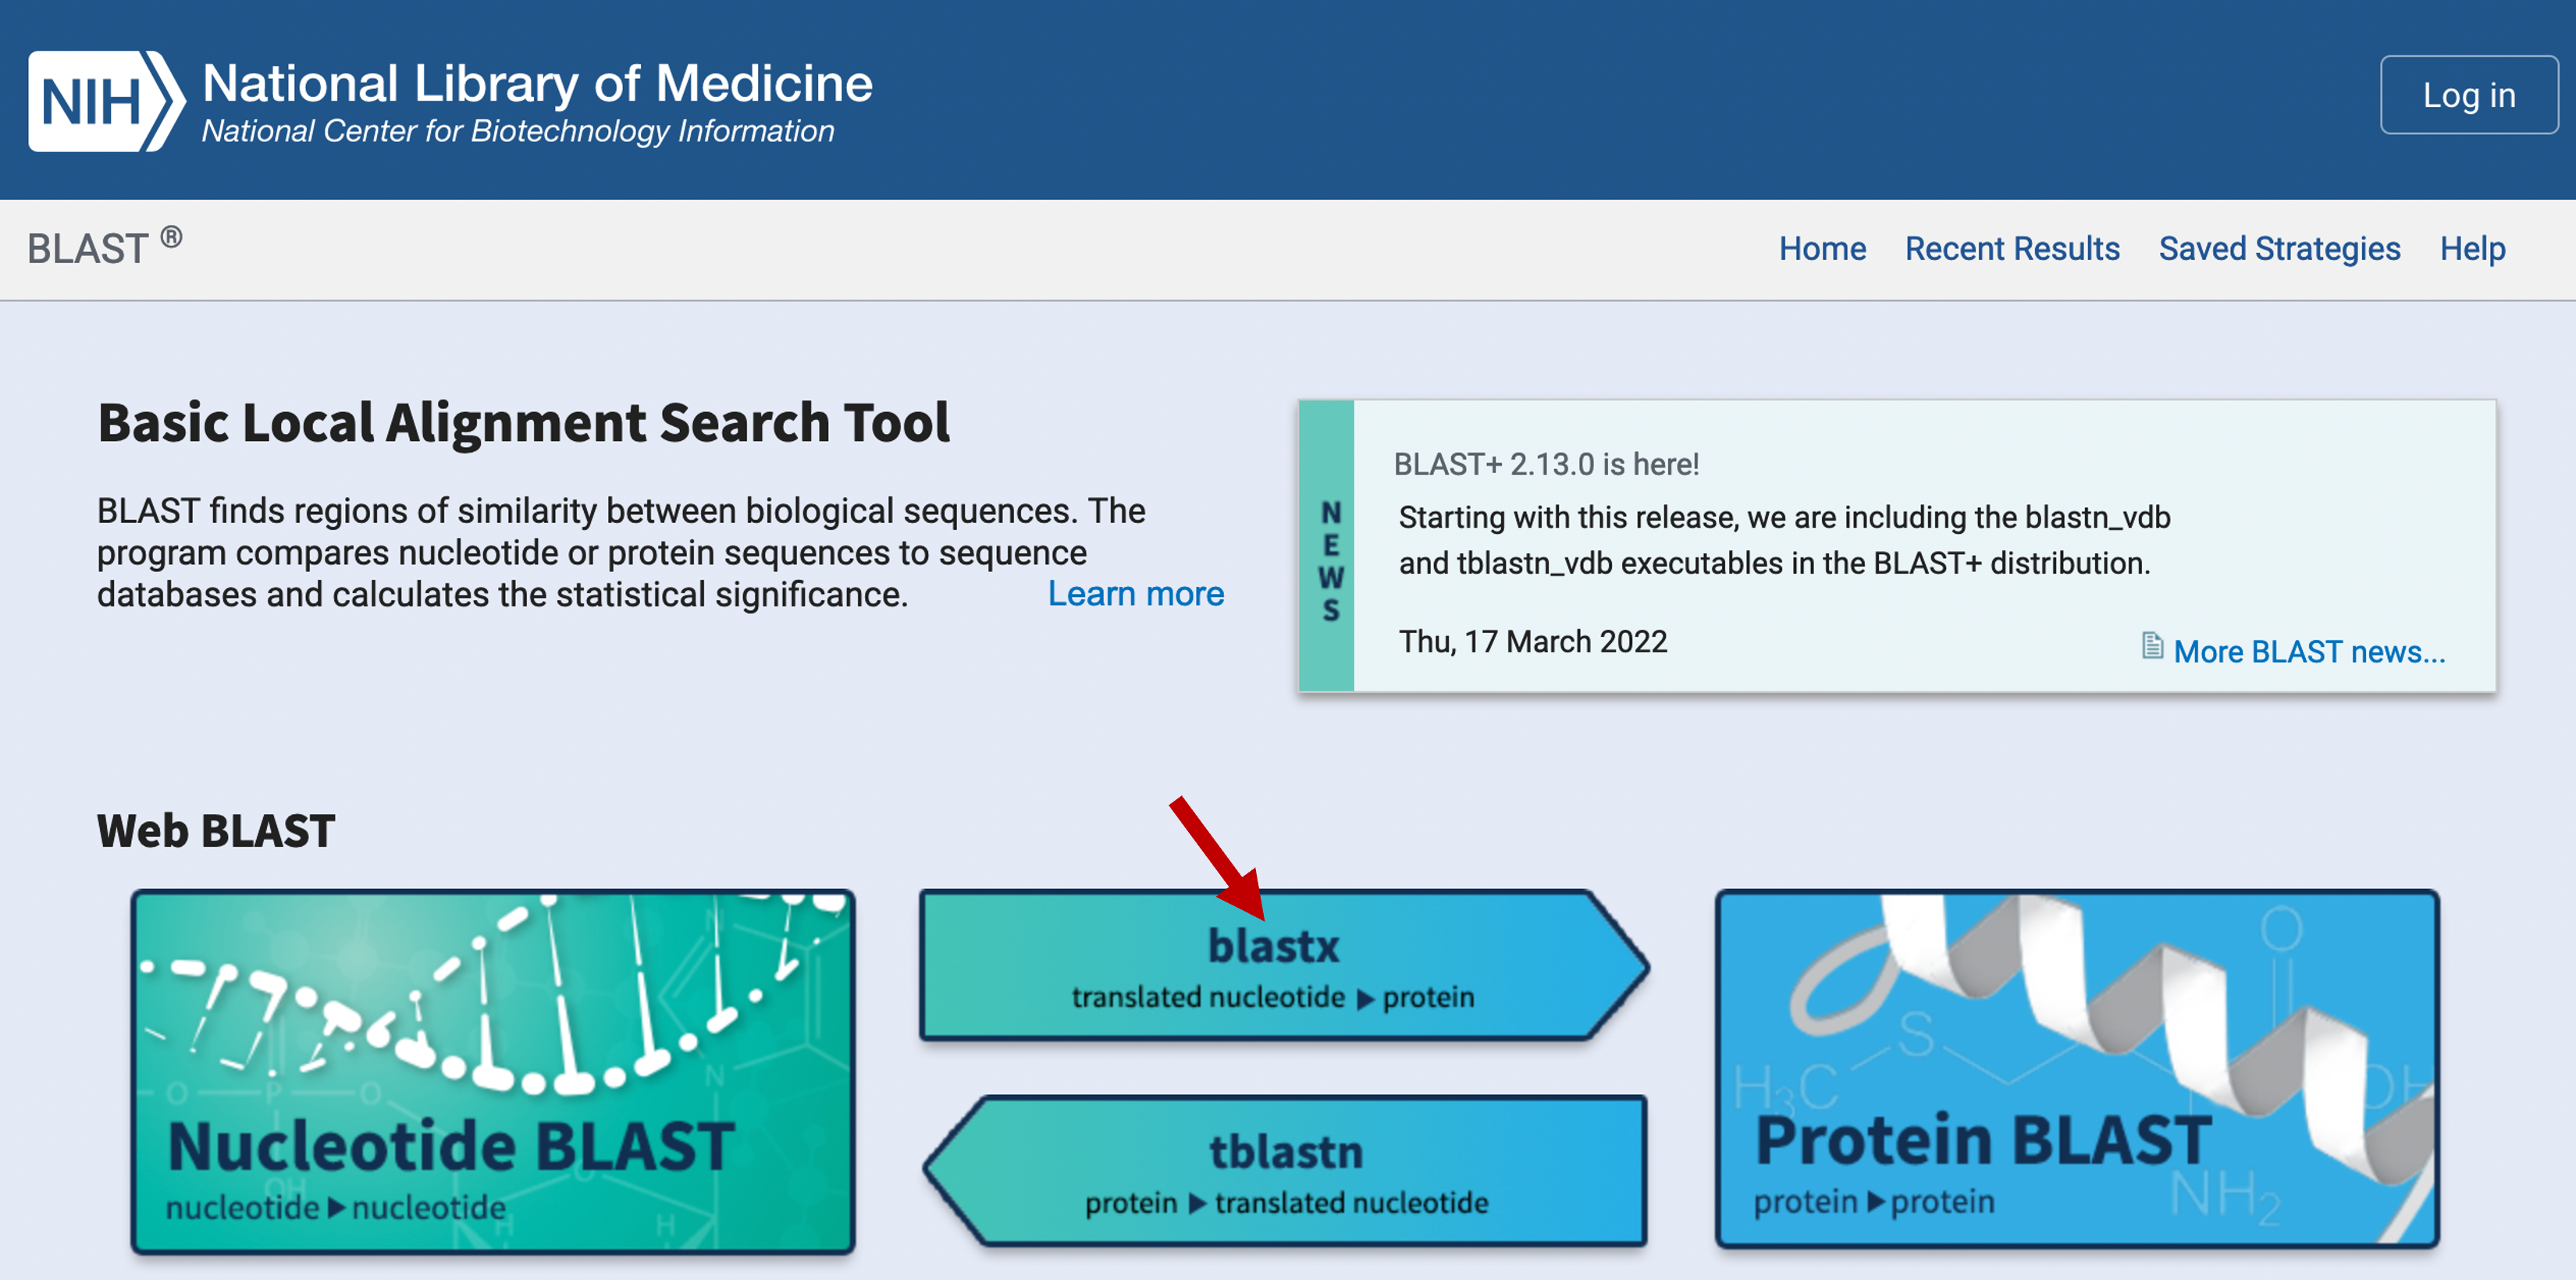
Navigate to the NCBI BLAST web server and click on the “blastx” image under the “Web BLAST” section (Figure 3)
-
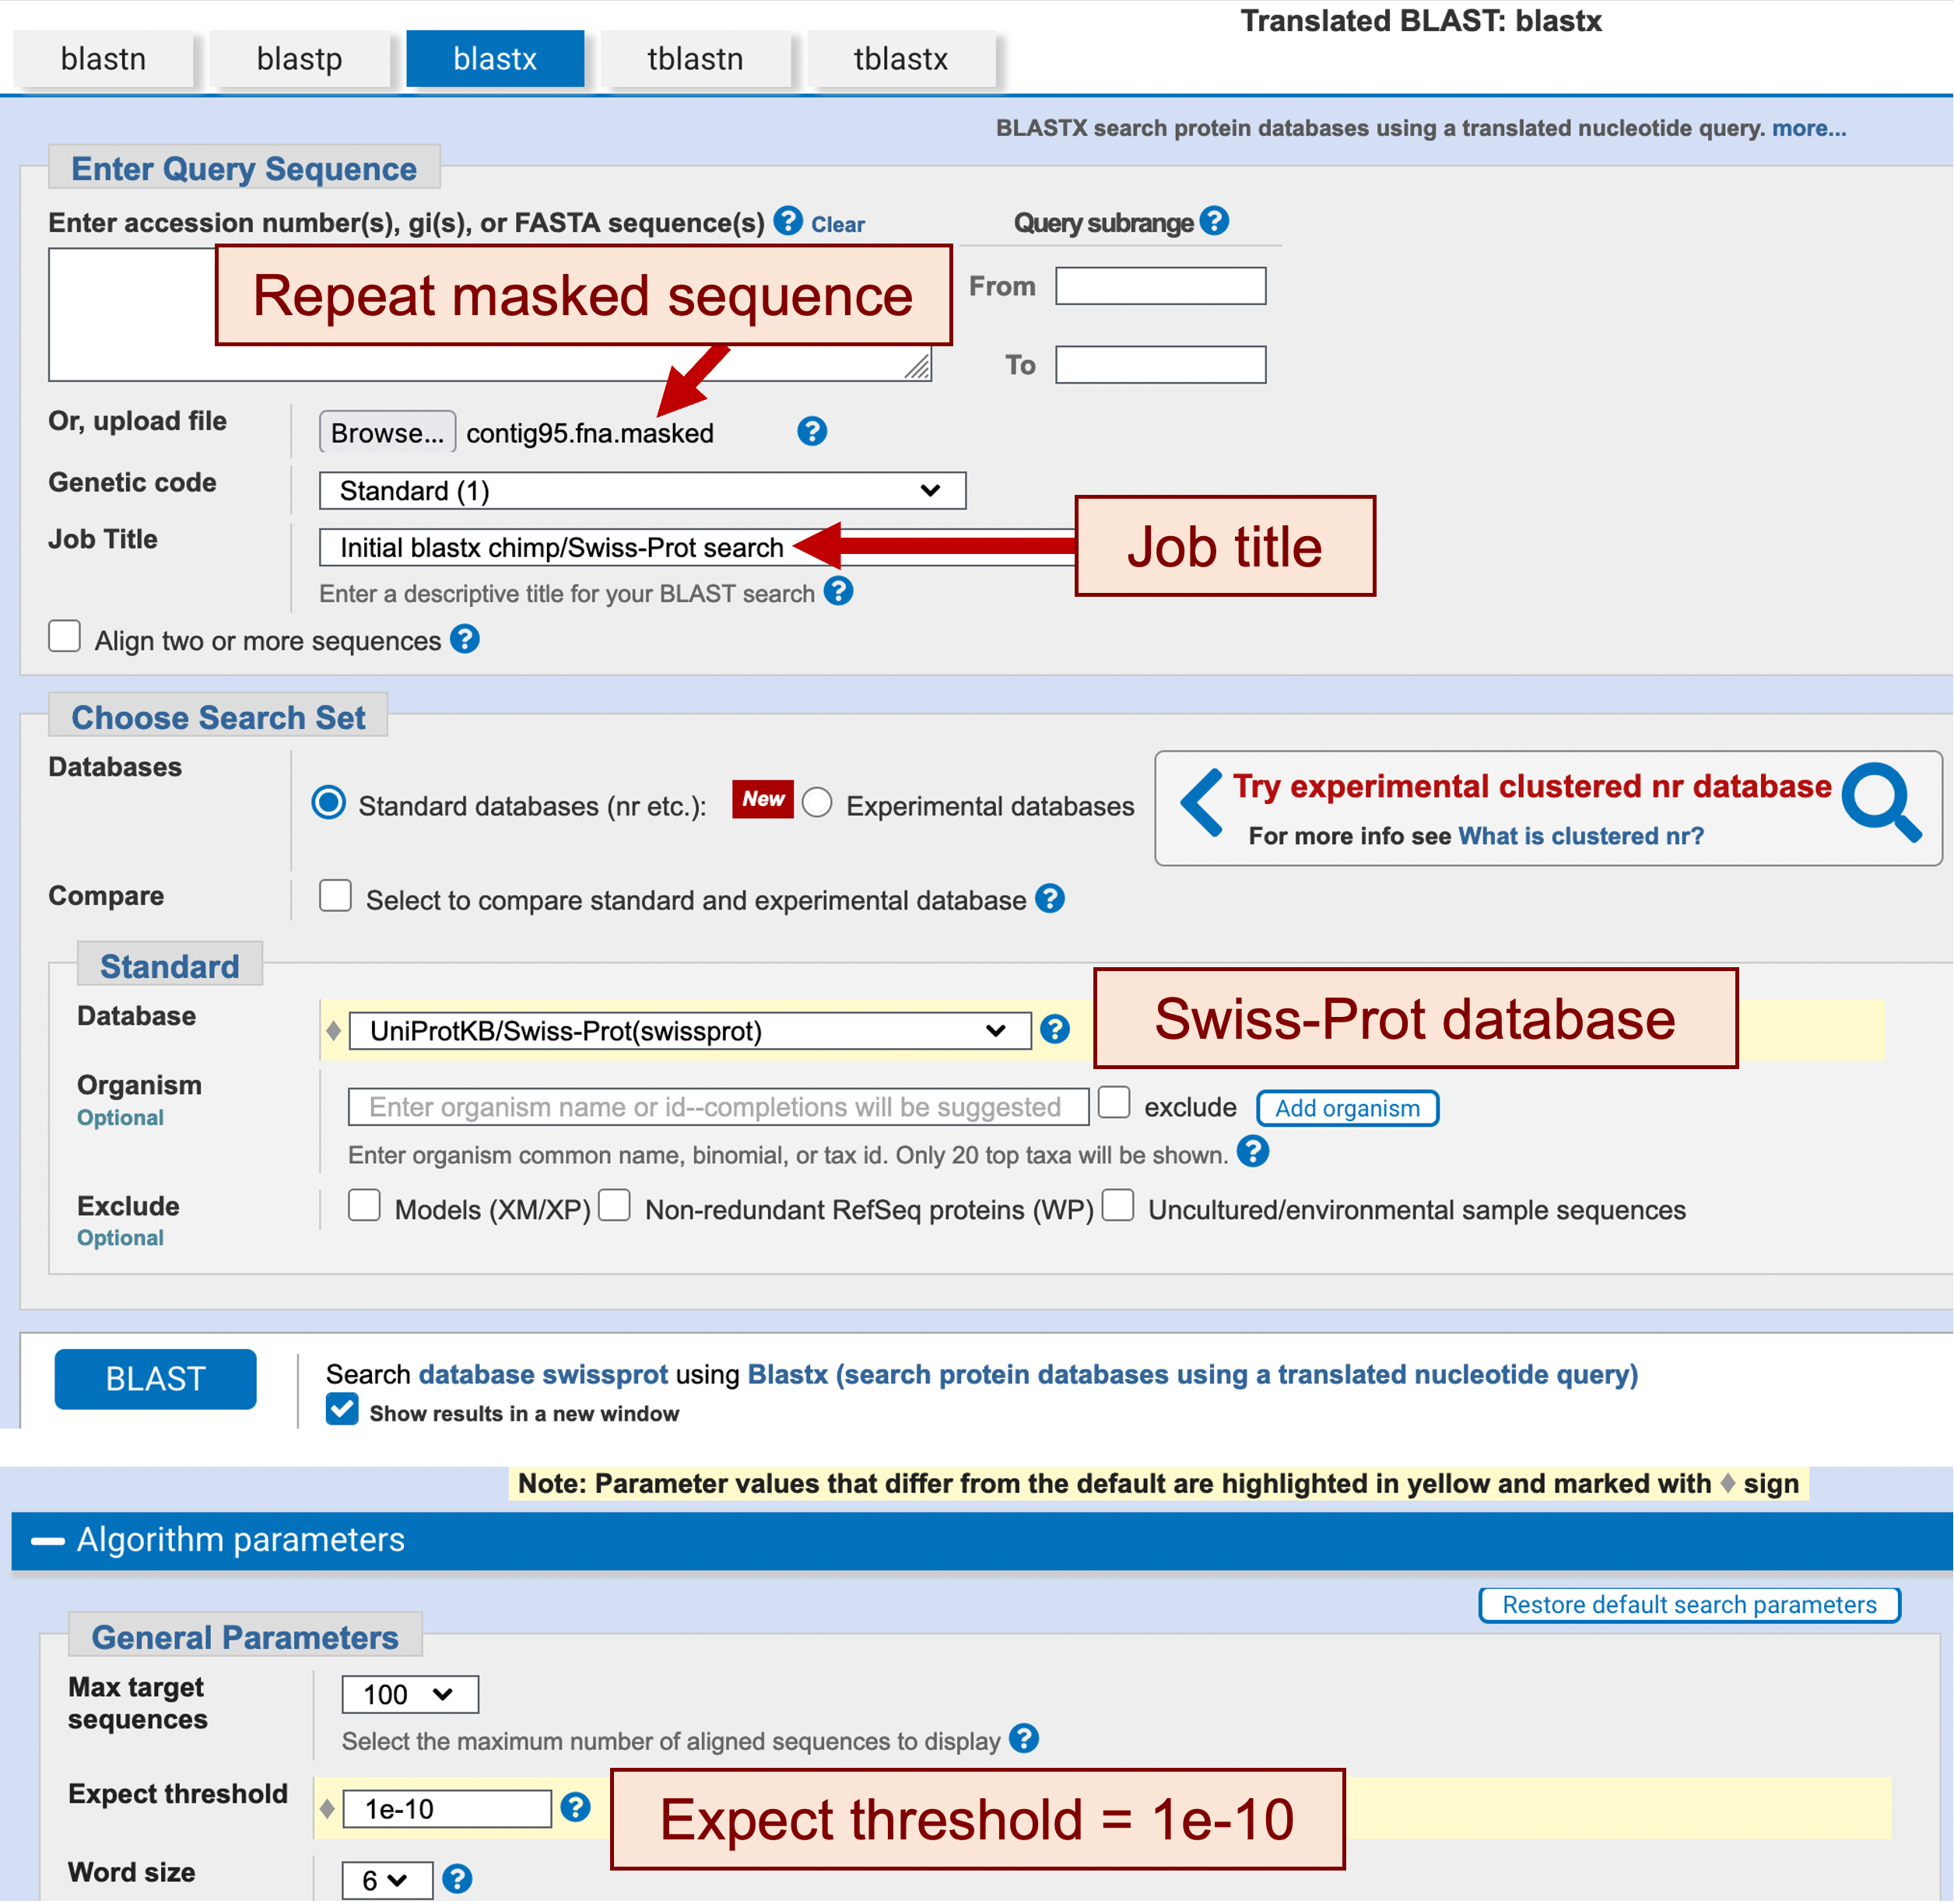
Under the “Enter Query Sequence” section, click on the “Browse” or the “Choose File” button, and select the repeat masked sequence file (i.e., contig95.fna.masked) (Figure 4)
-
Enter “Initial blastx chimp/Swiss-Prot search” into the “Job Title” field
-
In the “Choose Search Set” section, change the database to “UniProtKB/Swiss-Prot (swissprot)”
-
Click on the “Algorithm Parameters” label to expand this section. Change the “Expect threshold” to “1e-10” to reduce the number of spurious matches (Figure 4)
-
Click on the “BLAST” button
This blastx search may take a long time to complete, so be patient. Alternatively, for teaching purposes, the result of the blastx search is available in the file contig95_swissprot_blx.txt within the “blast_results” directory of the exercise package.
Click on the “Graphic Summary” tab of the blastx output. The tab includes a diagram that displays the locations of the BLAST hits relative to the query sequence (Figure 5). The alignments depicted in this diagram correspond to the selected BLAST hits under the “Descriptions” tab.
When you move the mouse over a BLAST hit in the graphical summary, a tooltip will appear which shows the name of the subject sequence. When you click on a hit in the diagram, a larger tooltip will appear which shows additional information regarding the BLAST hit, such as the alignment score and E-value. You can navigate to the sequence alignment by clicking on the “Alignment” link at the bottom of the tooltip.
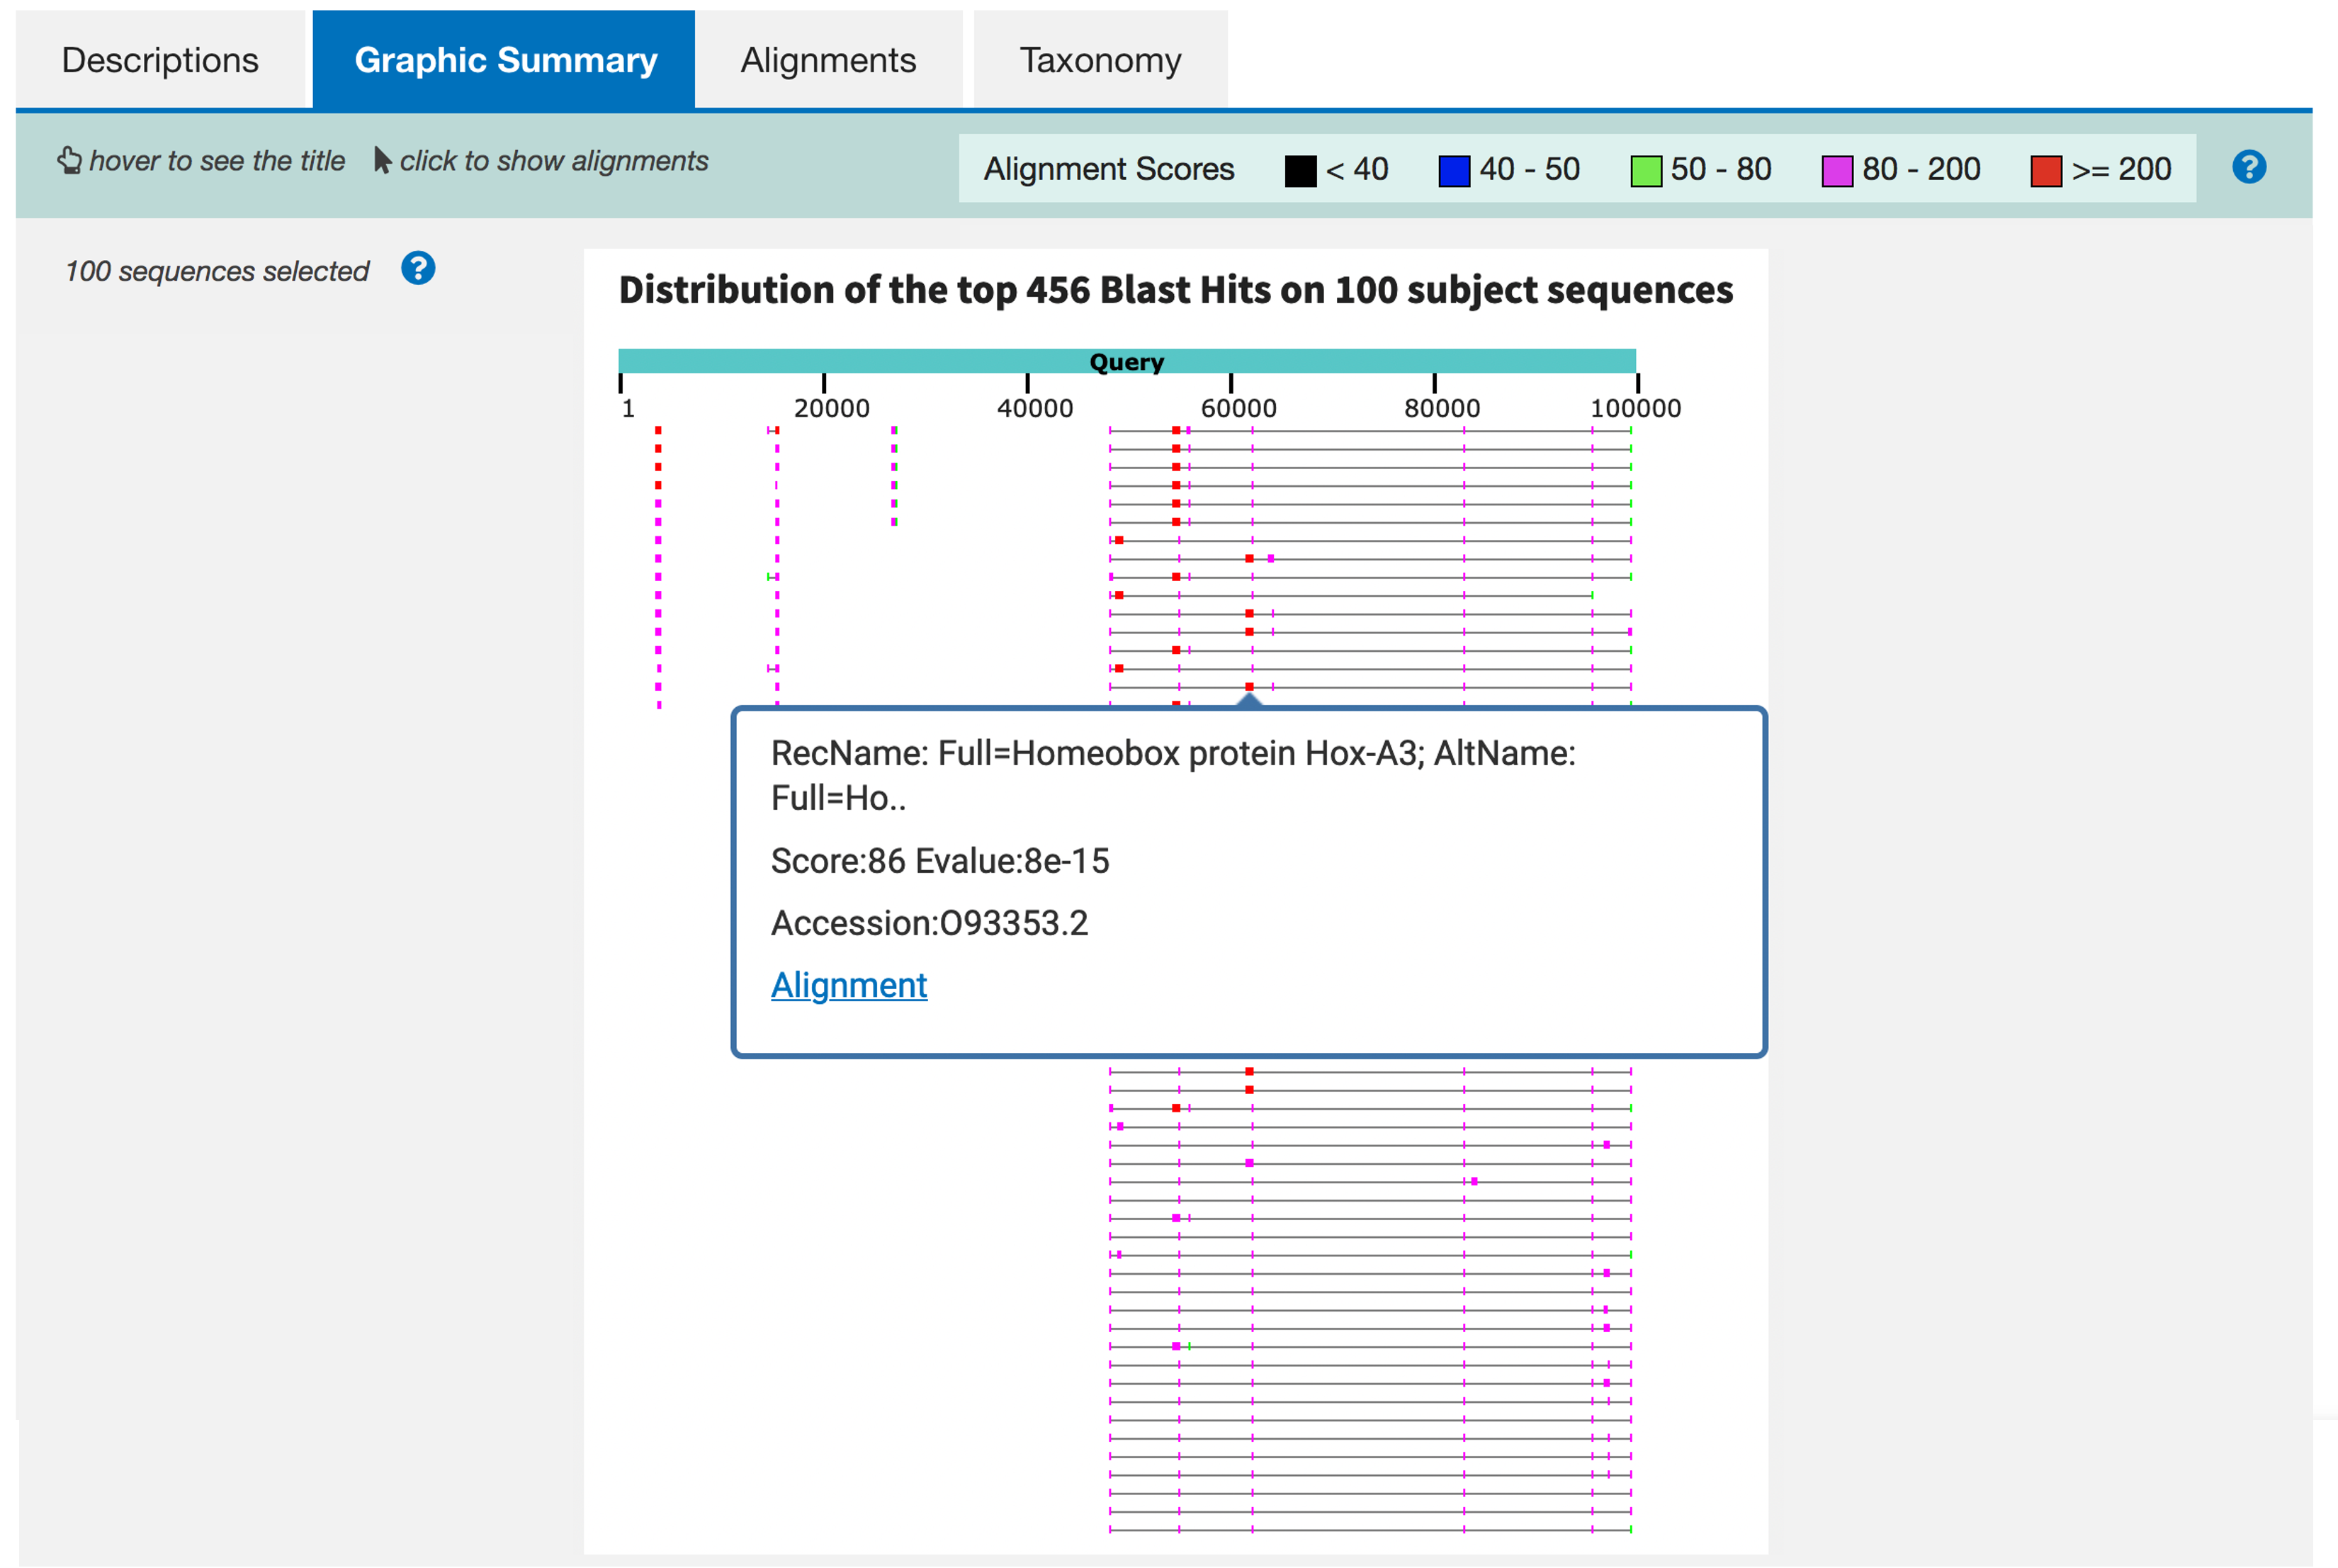
About how many different regions in your contig appear to have one or more matches to Swiss-Prot? What family of genes seems to predominate in the blastx output?
A basic BLAST viewer
While the diagram generated by the web-based NCBI BLAST provide us with a general overview of the locations of the BLAST hits relative to the query sequence, we often need to investigate individual BLAST hits and examine their alignments during annotation. It is possible to interpret the BLAST output manually, but doing so is extremely time-consuming and error-prone. To make life easier, we need a program that can help us organize and display multiple BLAST matches to a query sequence.
There are some fancy annotation workbenches and display systems available, such as Apollo and Artemis. If you get a job doing genome annotation, you might use one of these high-powered programs or their commercial counterparts. For this exercise, we took the simple approach and generated web pages that allow you to view the BLAST hits and alignments graphically.
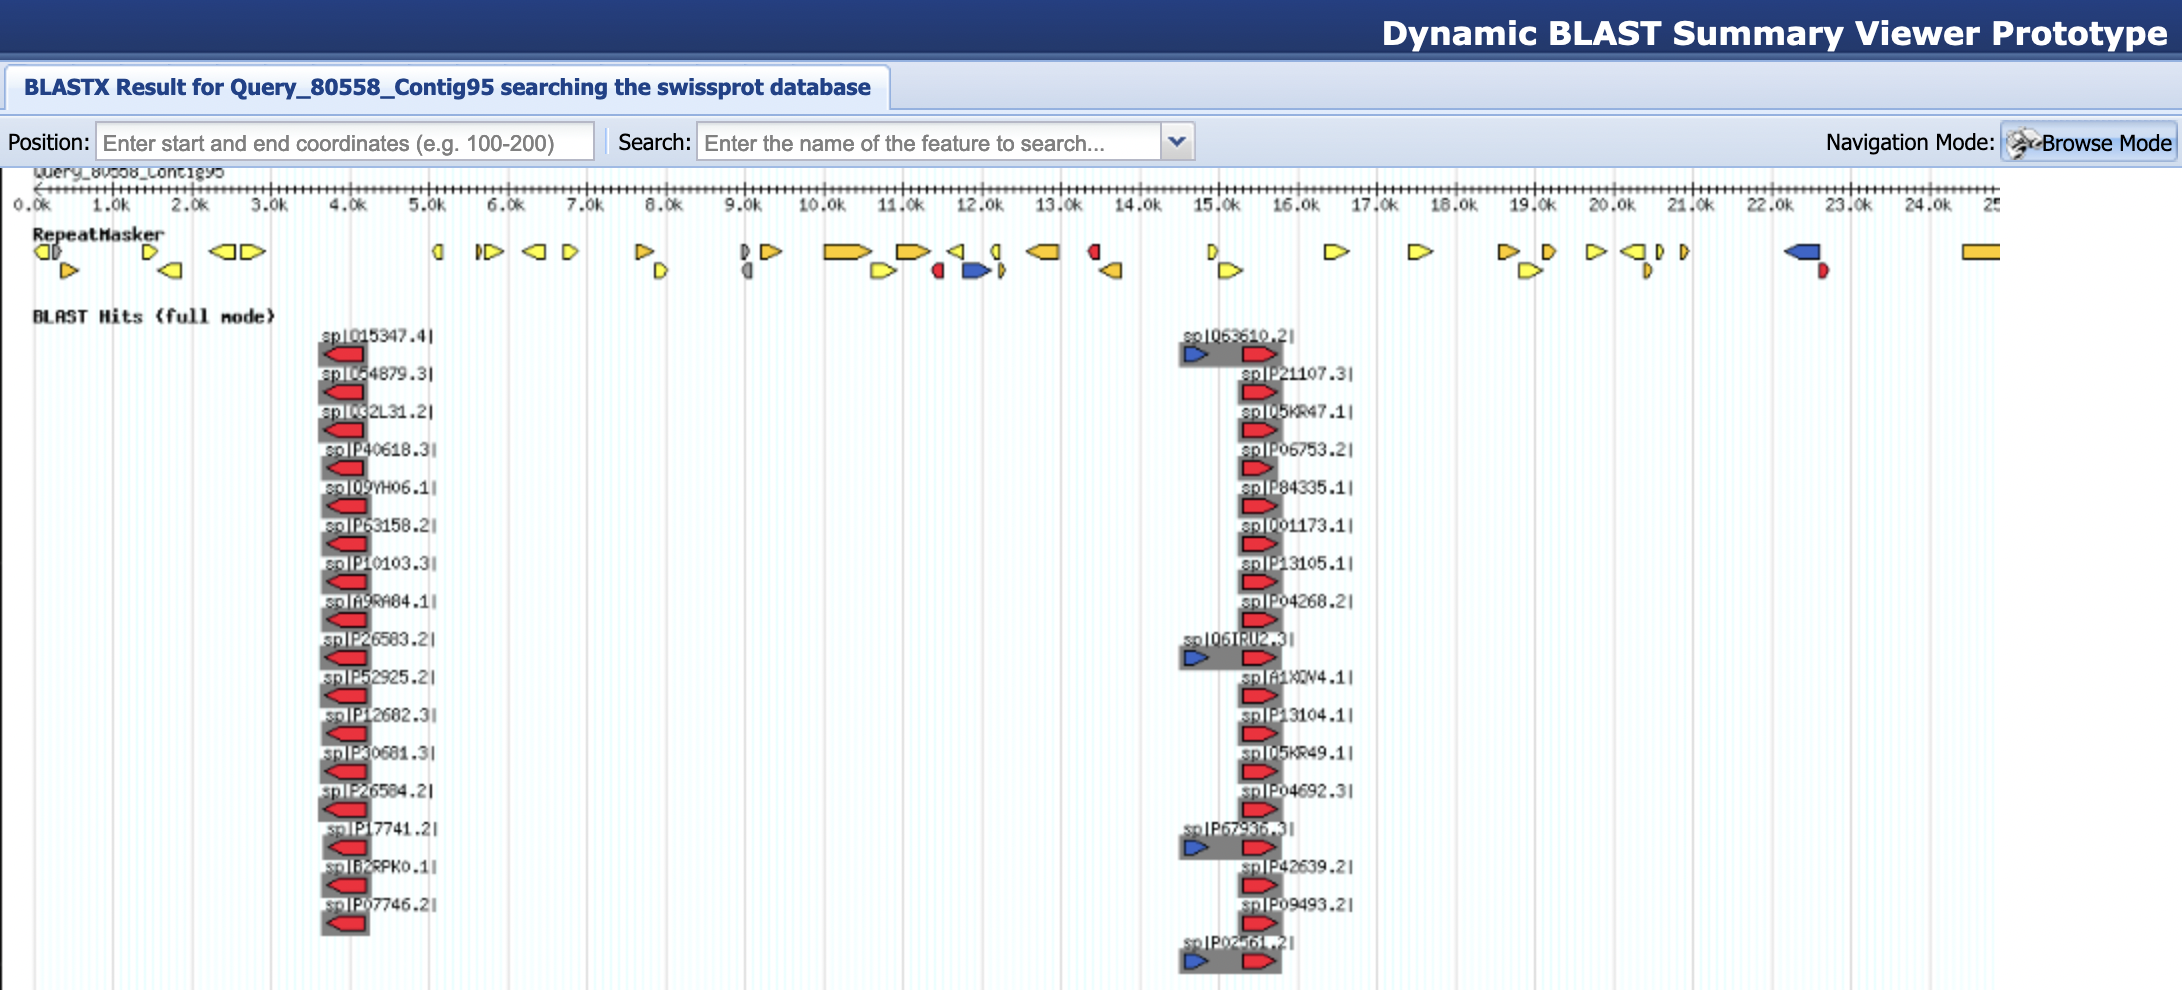
To see a graphical summary of the blastx result, open a new web browser window and navigate to the BLAST Output Viewer Portal for this exercise. Click on the “blastx Swiss-Prot results” link under the “BLAST Output Viewers” section. If all goes well, you should see an image of all the BLAST hits and RepeatMasker results (Figure 6). The navigation controls for the BLAST Output Viewer are similar to those used by Google Maps. You can zoom by clicking on the image or by using your mouse scroll wheel. You can pan the image by holding on the left mouse button while dragging the mouse. Alternatively, you can also use the navigation toolbar at the bottom right corner to zoom and pan the image.
As for the image itself, the ruler across the top of the window indicates your position in the sequence. This is followed by two data tracks. The track labeled “RepeatMasker” shows the location of all the repetitious elements identified in the RepeatMasker .out file. The color of each hit corresponds to its repeat class:
| Repeat Class | Color |
|---|---|
DNA Transposons |
Red |
LINE |
Orange |
SINE |
Yellow |
LTR |
Blue |
Simple Repeat |
Green |
Low Complexity |
Light green |
Other |
Grey |
The track labeled “BLAST Hits (full mode)” shows the locations of all the BLAST hits. The direction of the arrow corresponds to the orientation of the match relative to the query sequence. The color of each hit corresponds to its E-value. “Warmer” colors (e.g., red and orange) are better than “cooler” colors (e.g., yellow, green, and black). Multiple matches to the same sequence in the database are grouped together in a gray box. The name of each hit is displayed at the left top corner of the gray box. Multiple matches to the same part of the query (your contig) are vertically “stacked” — you may have to scroll down to see them all.
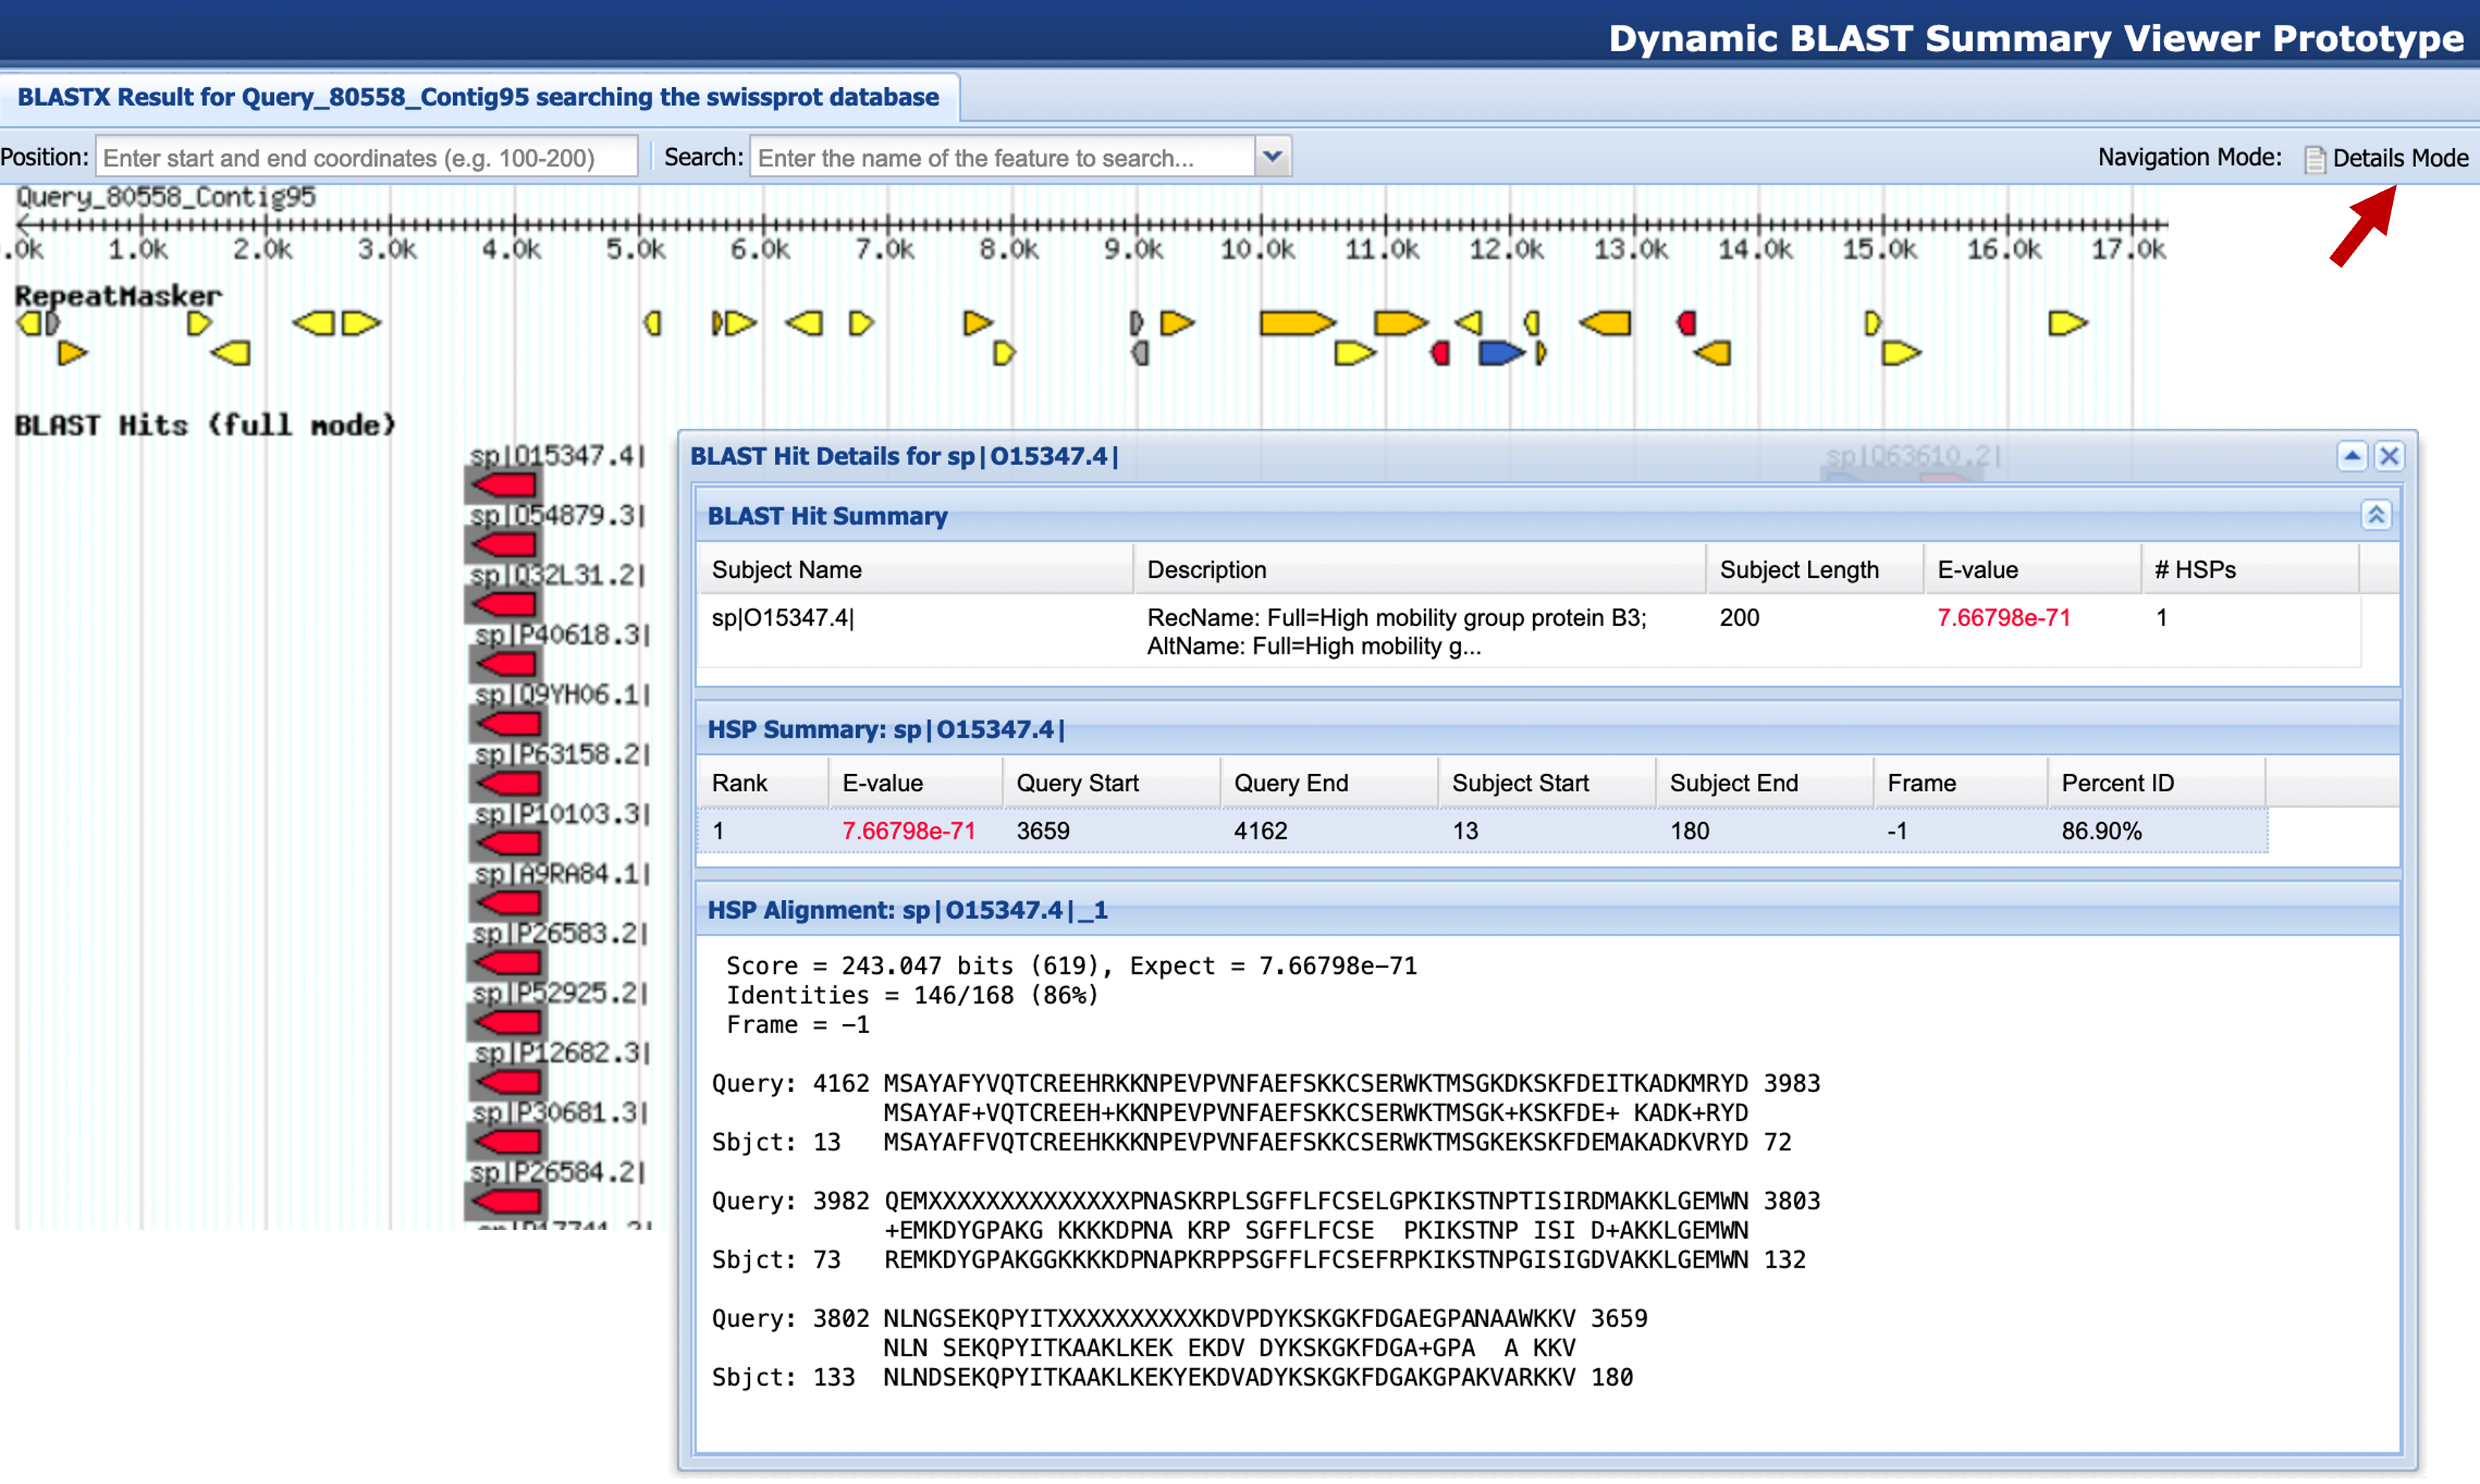
The BLAST Output Viewer has two different navigation modes. When the viewer is in “Browse Mode”, you can use the mouse to pan and zoom to different parts of the image. When the viewer is in “Details Mode”, you can interact with the items shown in the image. Hover the mouse over an item in an evidence track to see a brief summary of the item. Click on a BLAST hit or an HSP to see a summary table and the BLAST alignment (Figure 7). You can toggle between the Browse and Details modes by clicking on the top right button on the main toolbar.
A first look at Expressed Sequence Tags (ESTs)
The Swiss-Prot matches highlight regions within the contig that are similar to well-known genes. However, protein matches cannot tell us about the extent of a gene’s 5' and 3' untranslated regions (UTRs), or about its degree of homology to known sequences at the mRNA level. Moreover, Swiss-Prot does not include genes whose existence are only predicted and have not been experimentally confirmed. While annotations involving such hypothetical features are less immediately useful for determining what functions a region of the genome might perform, they nonetheless can lend credence to the hypothesis that such conserved regions probably correspond to real genes.
A comprehensive method to detecting matches to all known and hypothetical proteins is to use the blastx program with our contig sequence and search against the GenBank non-redundant (nr) protein database. However, the nr database is much larger than Swiss-Prot, leading to a substantially longer search time. As of December 21, 2025, the nr database contains 979,788,021 sequences, and the Swiss-Prot database has 485,662 protein sequences. We will skip this blastx search in this tutorial but you may want to perform this search for your own annotations.
An alternative way to identify potentially interesting genes or gene-like features at the mRNA level is to use a database of expressed sequence tags (ESTs). ESTs are produced by directly sequencing the ends of transcribed mRNA sequences. Each EST is sequenced in just one pass which means ESTs are low-quality nucleic acid sequences with all the same problems as individual genomic reads.
Of the various types of BLAST searches you know of (i.e., blastn, blastp , blastx, tblastn, tblastx), which is the most sensitive for finding coding DNA matches between an mRNA database and a piece of genomic DNA? Why? Which type of BLAST search will give the most EST-based evidence about the extent of a gene’s untranslated region (UTR)?
Unfortunately, doing the “right” thing is too computationally expensive for long genomic sequences. In fact, accelerating sequence alignment algorithms is still an active research problem (reviewed in Xia Z et al., 2022). Some researchers have implemented the alignment algorithms in computing hardware to speed up sequence alignments against large genomic datasets (e.g., de Oliveira FF et al., 2022).
We will therefore compare our repeat-masked chimp contig to the human EST database at the DNA level using the blastn program. We can use blastn in this case since the chimp genomic sequences have very high sequence homology with the human genomic sequences. For more distantly-related species (e.g., mapping D. melanogaster ESTs onto the D. mojavensis genome), you would have to use tblastx to detect the conserved coding regions.
Designing the blastn search against the human EST database
NCBI collects EST sequences from different projects together into a single BLAST database called “Expressed sequence tags (est)”. We can configure the BLAST web interface to limit our search to human ESTs in this database.
Since our contig sequence (100 kb) and the human EST database are quite large, we should change several BLAST parameters to make the search go quicker and produce more meaningful results.
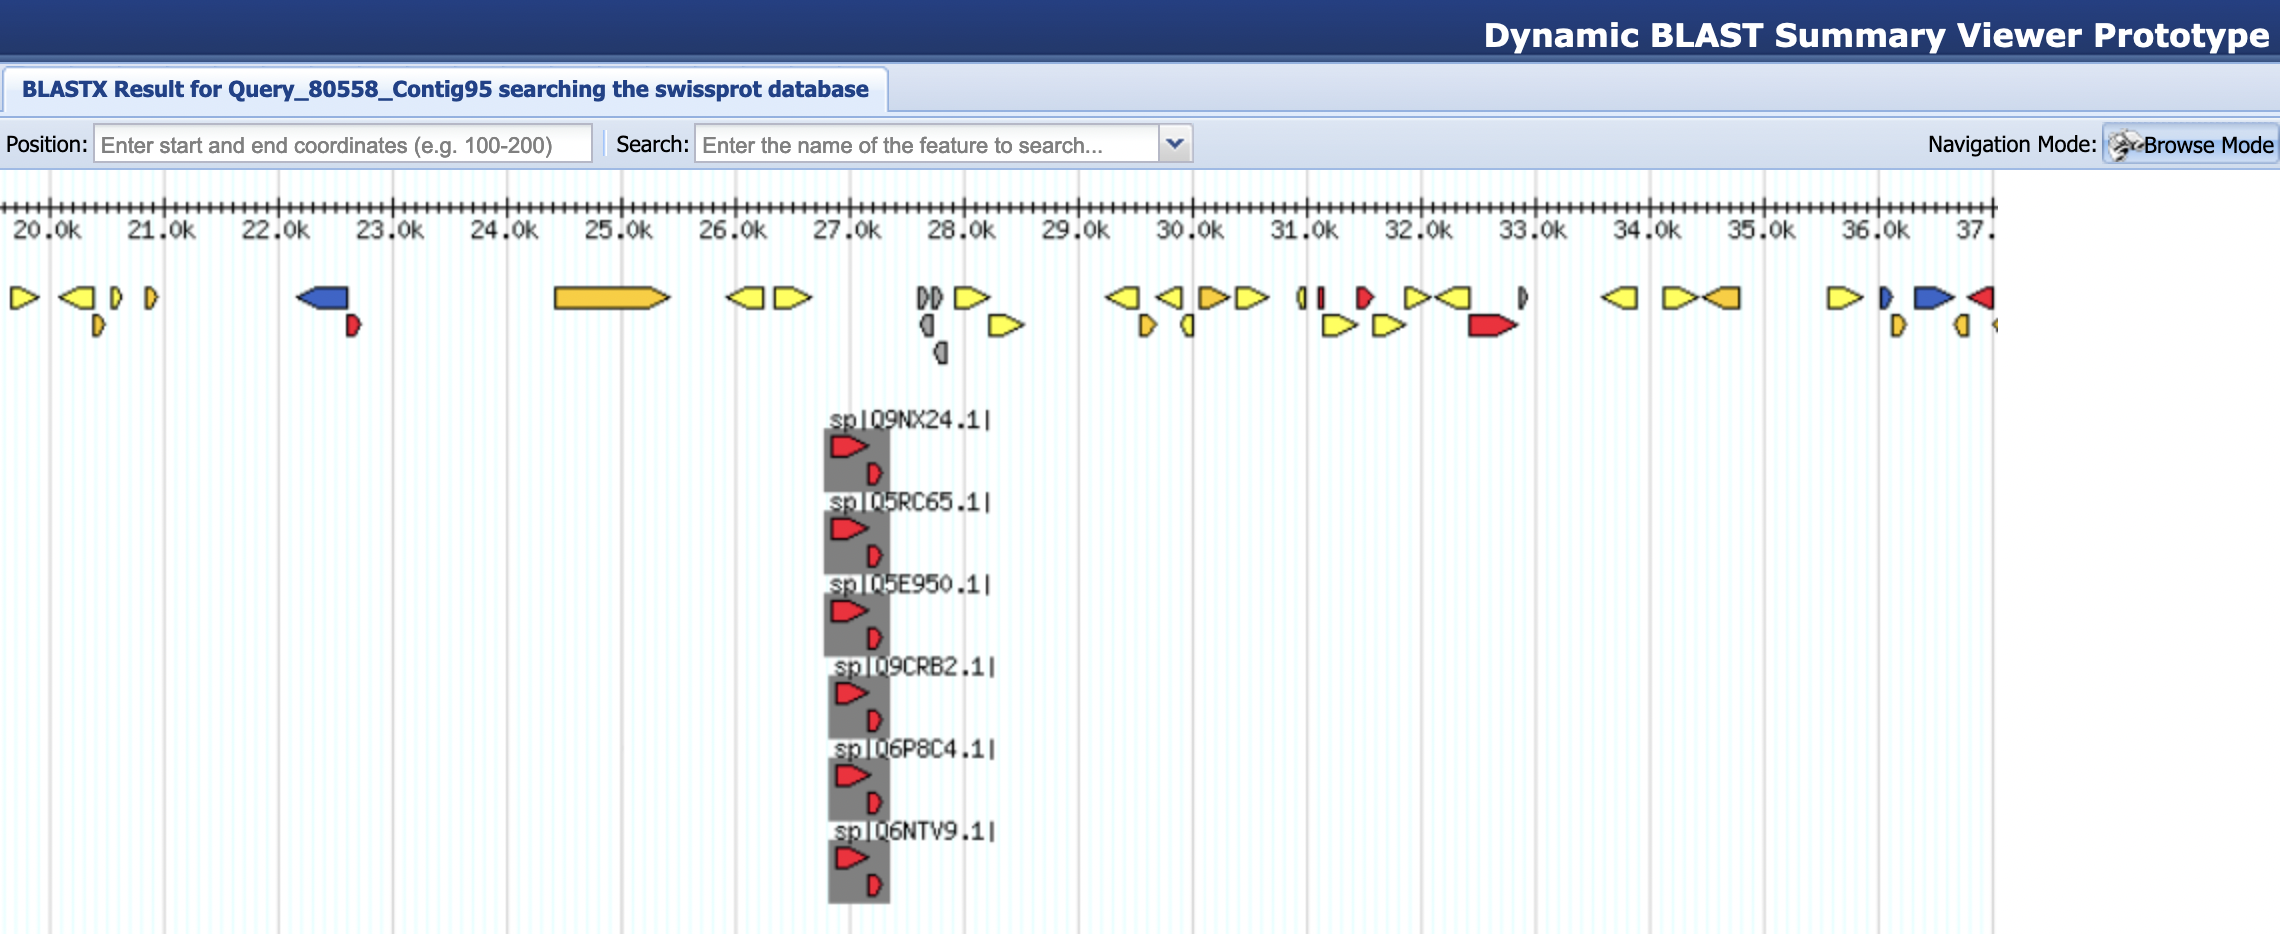
First, we will investigate only specific regions of the contig with our blastn search against the human EST database, using the blastx output against the Swiss-Prot database as our guide. You should see a relatively short but strong set of Swiss-Prot matches at ~27 kb of your contig in the BLAST Output Viewer (Figure 8). Therefore, we will focus on the region between 25 and 30 kb of our contig and investigate this region with a blastn search against the human EST database.
Second, standard NCBI blastn is not optimized for long (tens to hundreds of kilobases) queries like our contig sequence — taking much longer than it should to analyze them. Fortunately, there exists a much faster (though less sensitive) nucleotide BLAST search mode called megablast for highly similar sequences (e.g., between chimp and human). This option is available in the “Program Selection” section of the blastn web interface.
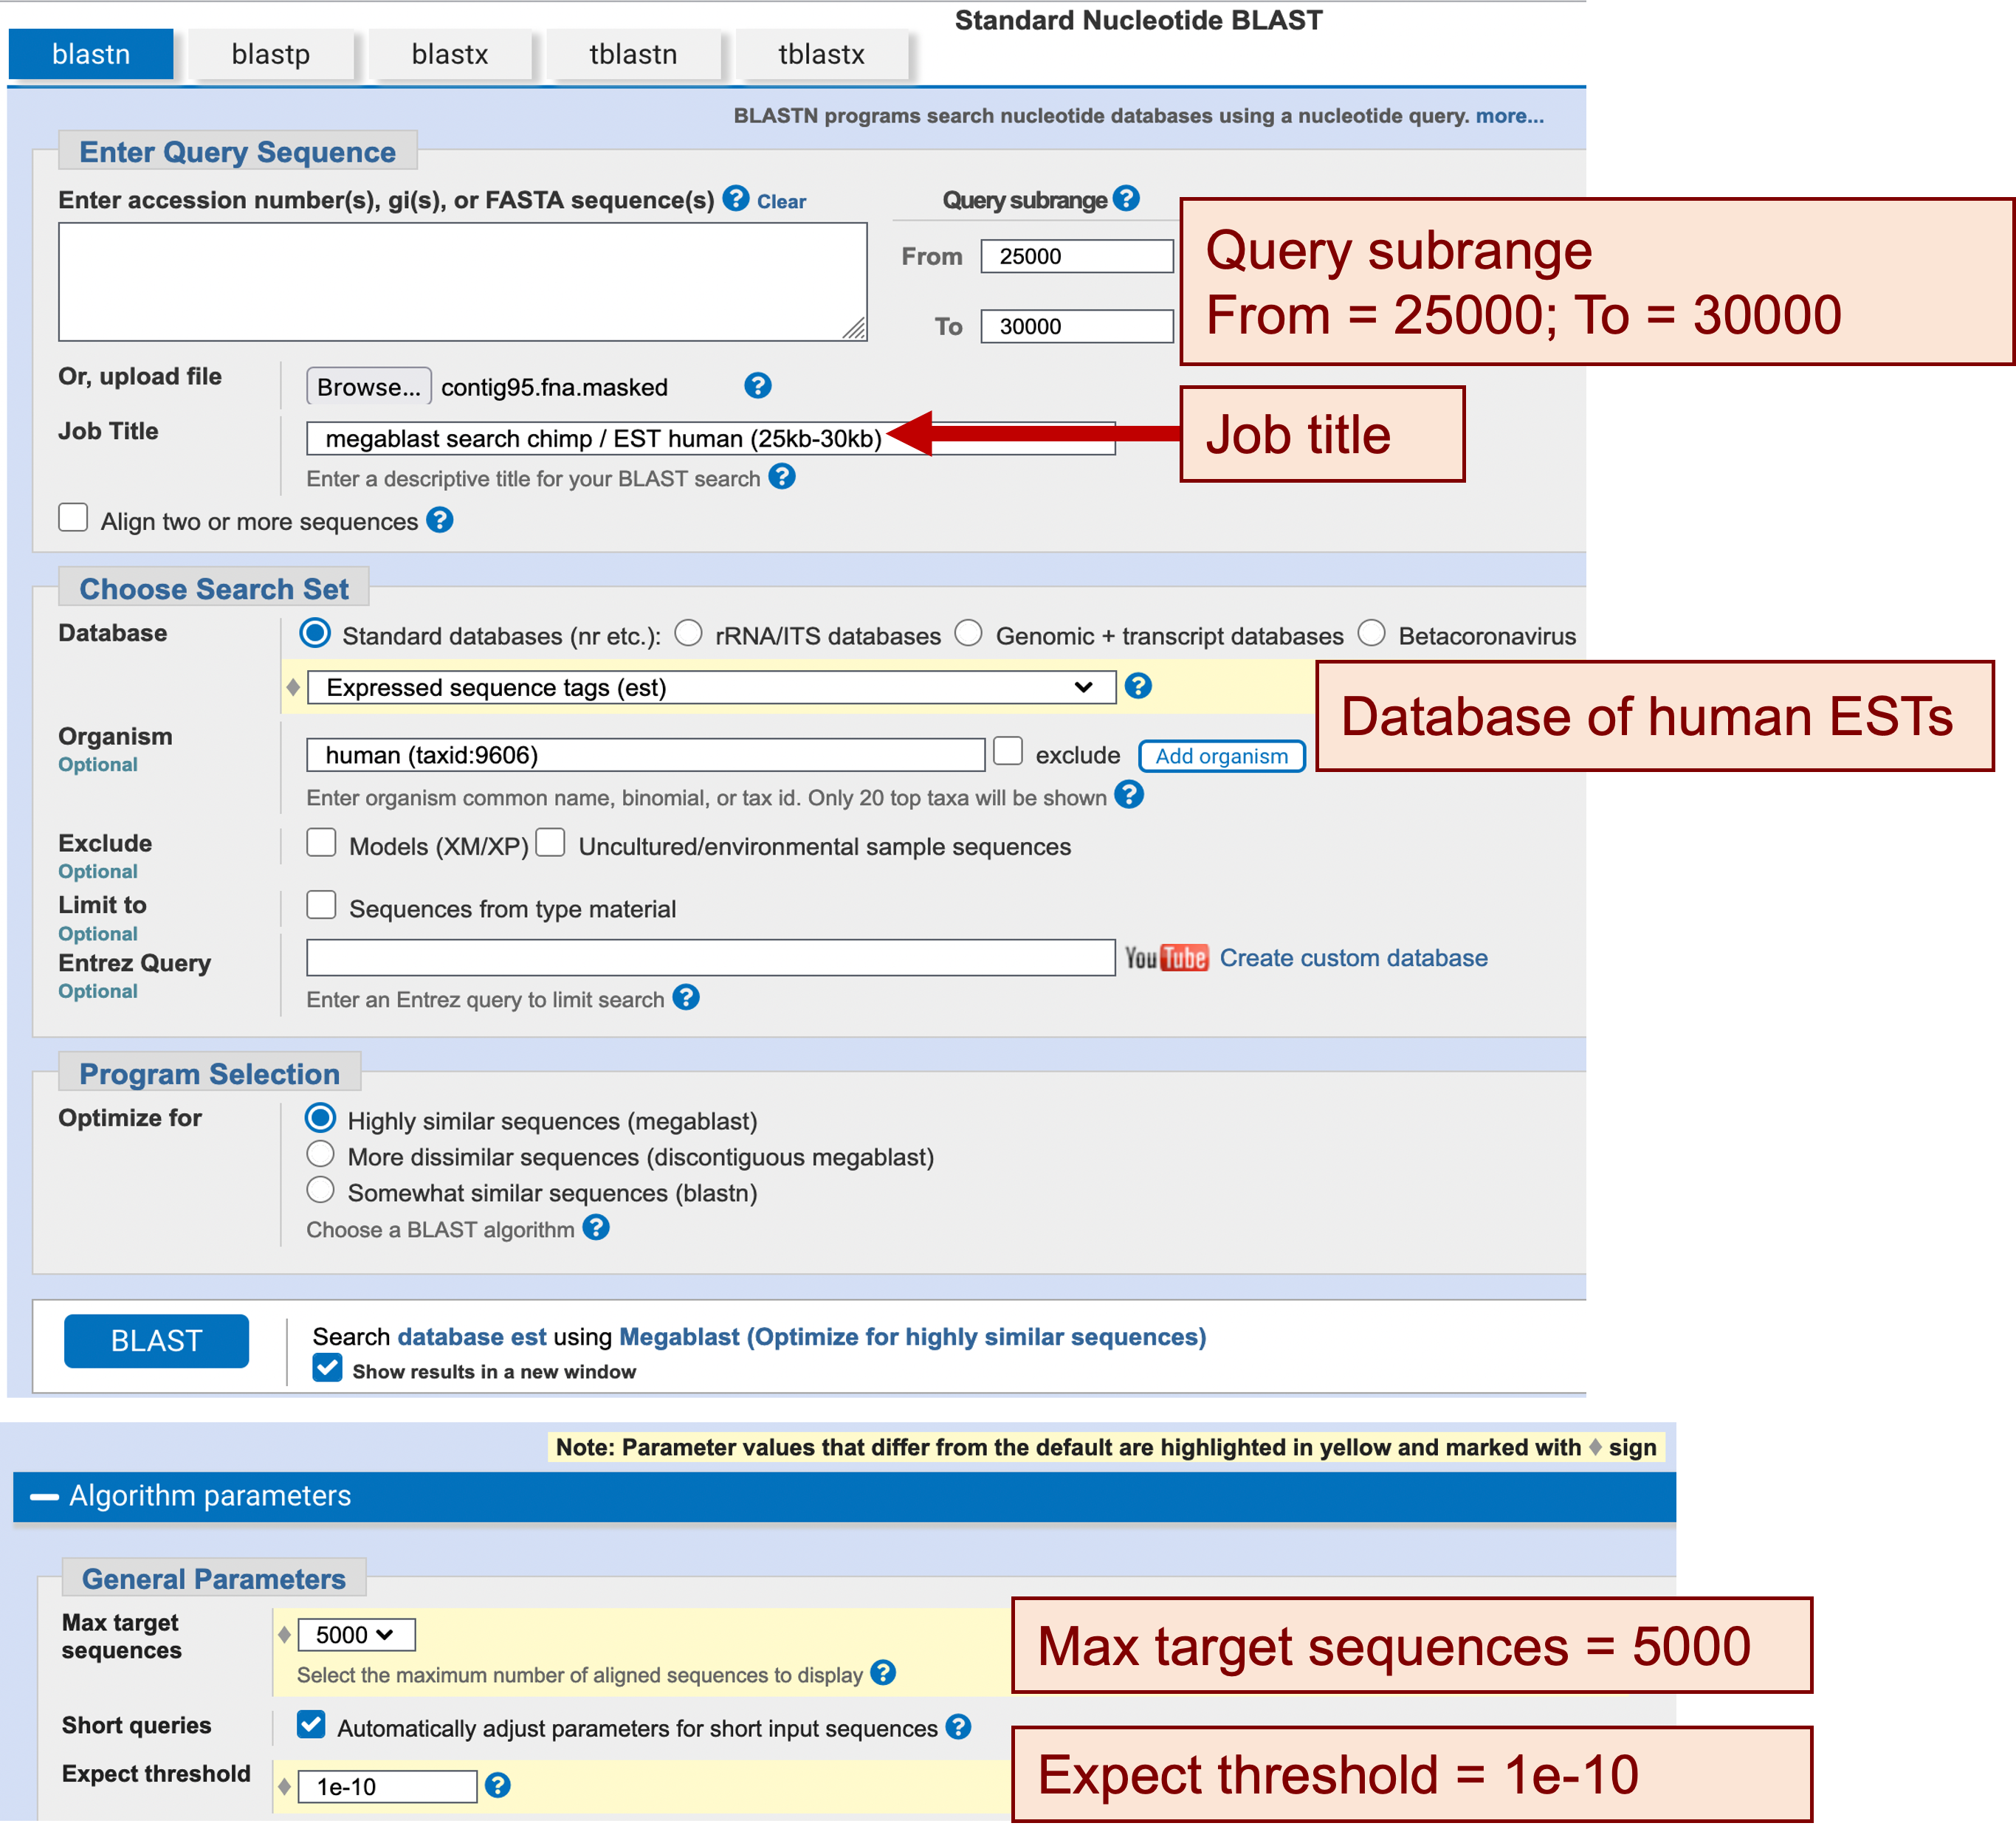
Third, since the human EST database is quite large, we expect there will be many EST matches. By default, BLAST will only display up to 100 matches. To increase the number of significant hits and alignments shown in the BLAST output, we will change the “Max target sequences” option to “5000” under the “Algorithm parameters” section. We will also set a more stringent “Expect threshold” of “1e-10” to reduce the number of spurious matches (Figure 9).
Now that we have developed a strategy for our blastn search, we can open a new web browser window and navigate to the NCBI BLAST web server to configure the search parameters:
-
Click on the “Nucleotide BLAST” image under the “Web BLAST” section
-
Under the “Enter Query Sequence” section, click on the “Browse” or the “Choose File” button and select the repeat masked sequence (contig95.fna.masked)
-
In the Query subrange section, enter “25000” in the “From” field and “30000” in the “To” field
-
Enter “megablast search chimp / EST human (25kb-30kb)” in the “Job Title” field
-
In the “Choose Search Set” section, change the database to “Expressed sequence tags (est)”
-
Enter “human (taxid:9606)” in the “Organism” field
-
Under the “Program Selection” section, verify that the “Highly similar sequences (megablast)” option is selected
-
Click on “Algorithm Parameters” to expand this section
-
Change the “Max target sequences” field to “5000”
-
Change the “Expect threshold” to “1e-10”
-
-
Click on the “BLAST” button
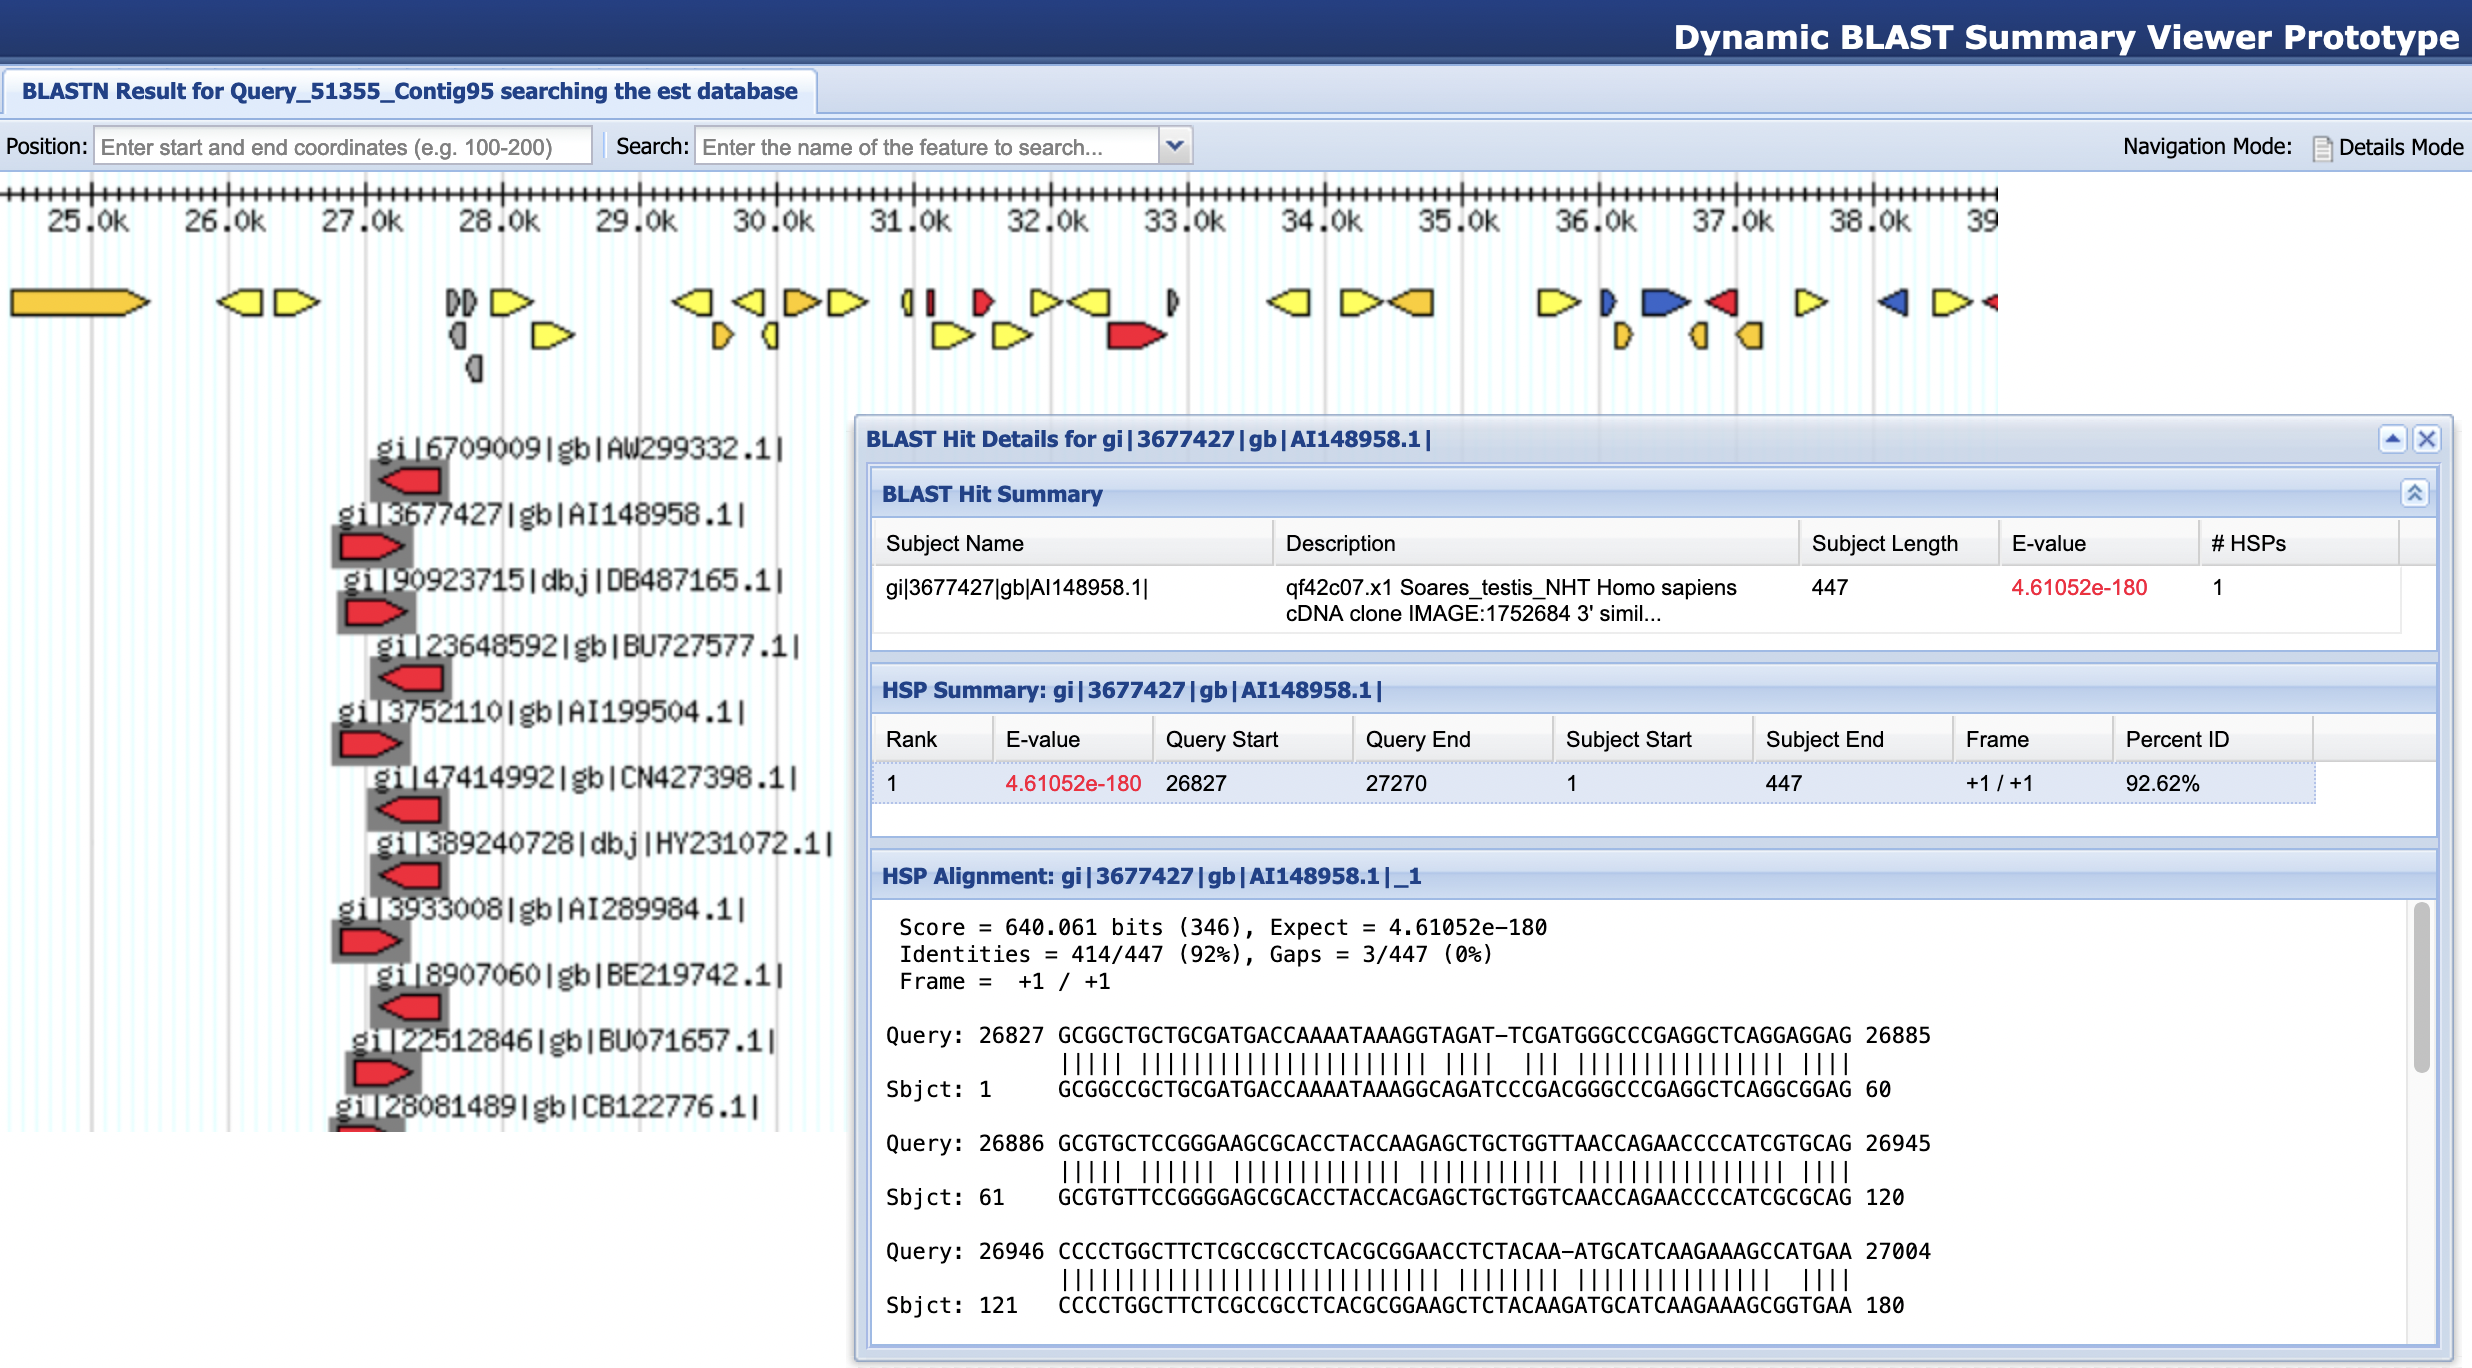
For teaching purposes, the result of this megablast search against the extracted region of the chimp sequence is available in the file contig95_25-30k_esthuman_bln.txt inside the blast_results directory. To see a graphical summary of the megablast search result, navigate to the BLAST Output Viewer Portal for this exercise and then click on the “megablast contig95:25-30kb / human ESTs results” link under the “BLAST Output Viewers” section. The viewer shows that there is a large number of EST hits around 27 kb in our chimp contig (Figure 10).
Digging in — Interpreting your BLAST hits
At this point, you should have two browser windows open showing results of BLAST searches for this chimpanzee sequence: the blastx search results against the Swiss-Prot database, and the blastn search results against the human EST database.
Based on the Swiss-Prot matches, which gene exhibits the strongest similarity to the feature at around 27 kb of our chimp sequence? Which organisms gave rise to the best three matches by E-value?
|
|
Check the protein records in NCBI or in Swiss-Prot. |
Now find the corresponding region in the blastn results against the human EST database, and look at the matches there.
Based on the percent identity of the human EST matches to this feature, do you think that the human mRNAs that gave rise to these ESTs were likely transcribed from the orthologous region of the human genome? Why or why not?
|
|
Look at just the first few EST matches; the others have comparable levels of similarity. |
Why might a particular gene not produce any EST sequences in a particular library, even though it is transcribed?
|
|
Think about experimental issues with mRNA/cDNA library construction. |
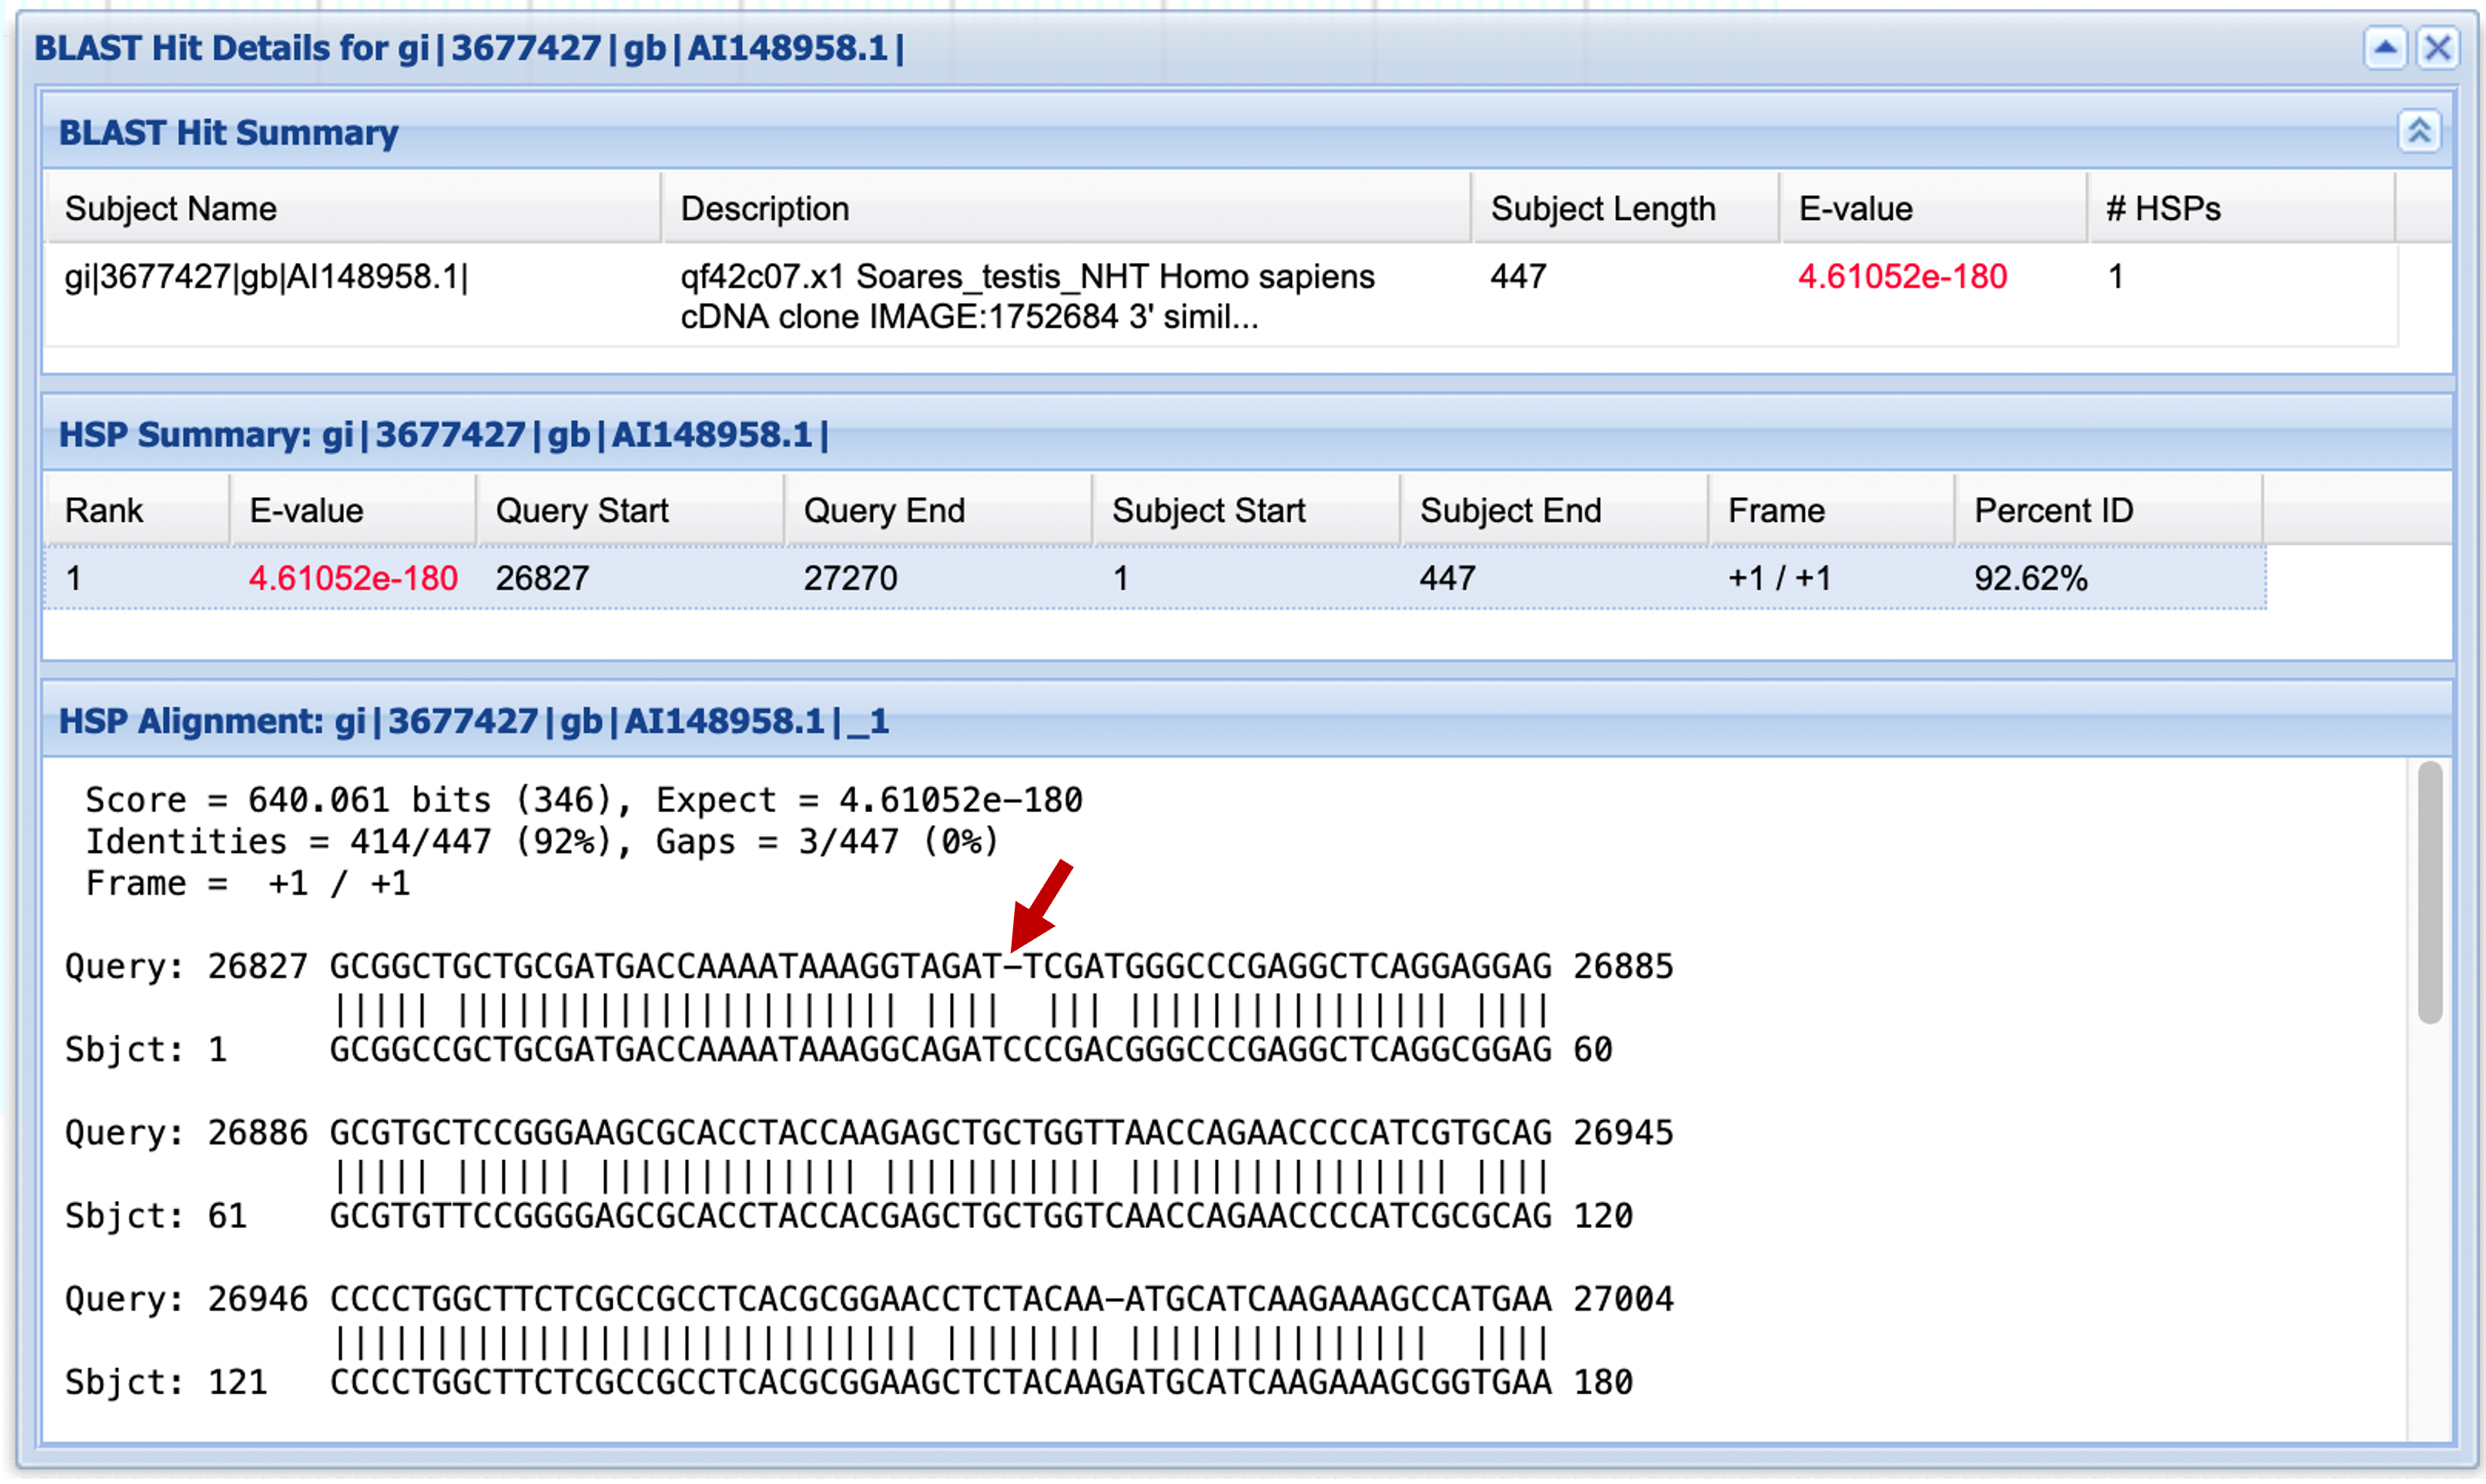
One interesting characteristic of the EST alignment with AI148958.1 (second match in the graphical output) is that it contains a one-base gap after base 26,859 of our chimp sequence (Figure 11). If this gap were in the middle of a putative coding region, we might suspect that we were looking at a pseudogene derived from the gene family that produced the ESTs.
Is it wise to attribute a gap in an EST-to-genome alignment to a real variation in the genome, based on a single EST match? Why or why not? Use the blastn output to gather additional evidence for or against the hypothesis that the mRNA that produced the ESTs really does differ from the genome at this locus.
We can follow up this hypothesis by performing another blastn search using this region of the contig against a more complete nucleotide database, such as the NCBI core_nt database. This is left as an optional exercise to the reader.
Using ESTs to annotate mRNAs
In this section, we will look at how ESTs can be used to annotate mRNA sequences that include the UTRs of genes.
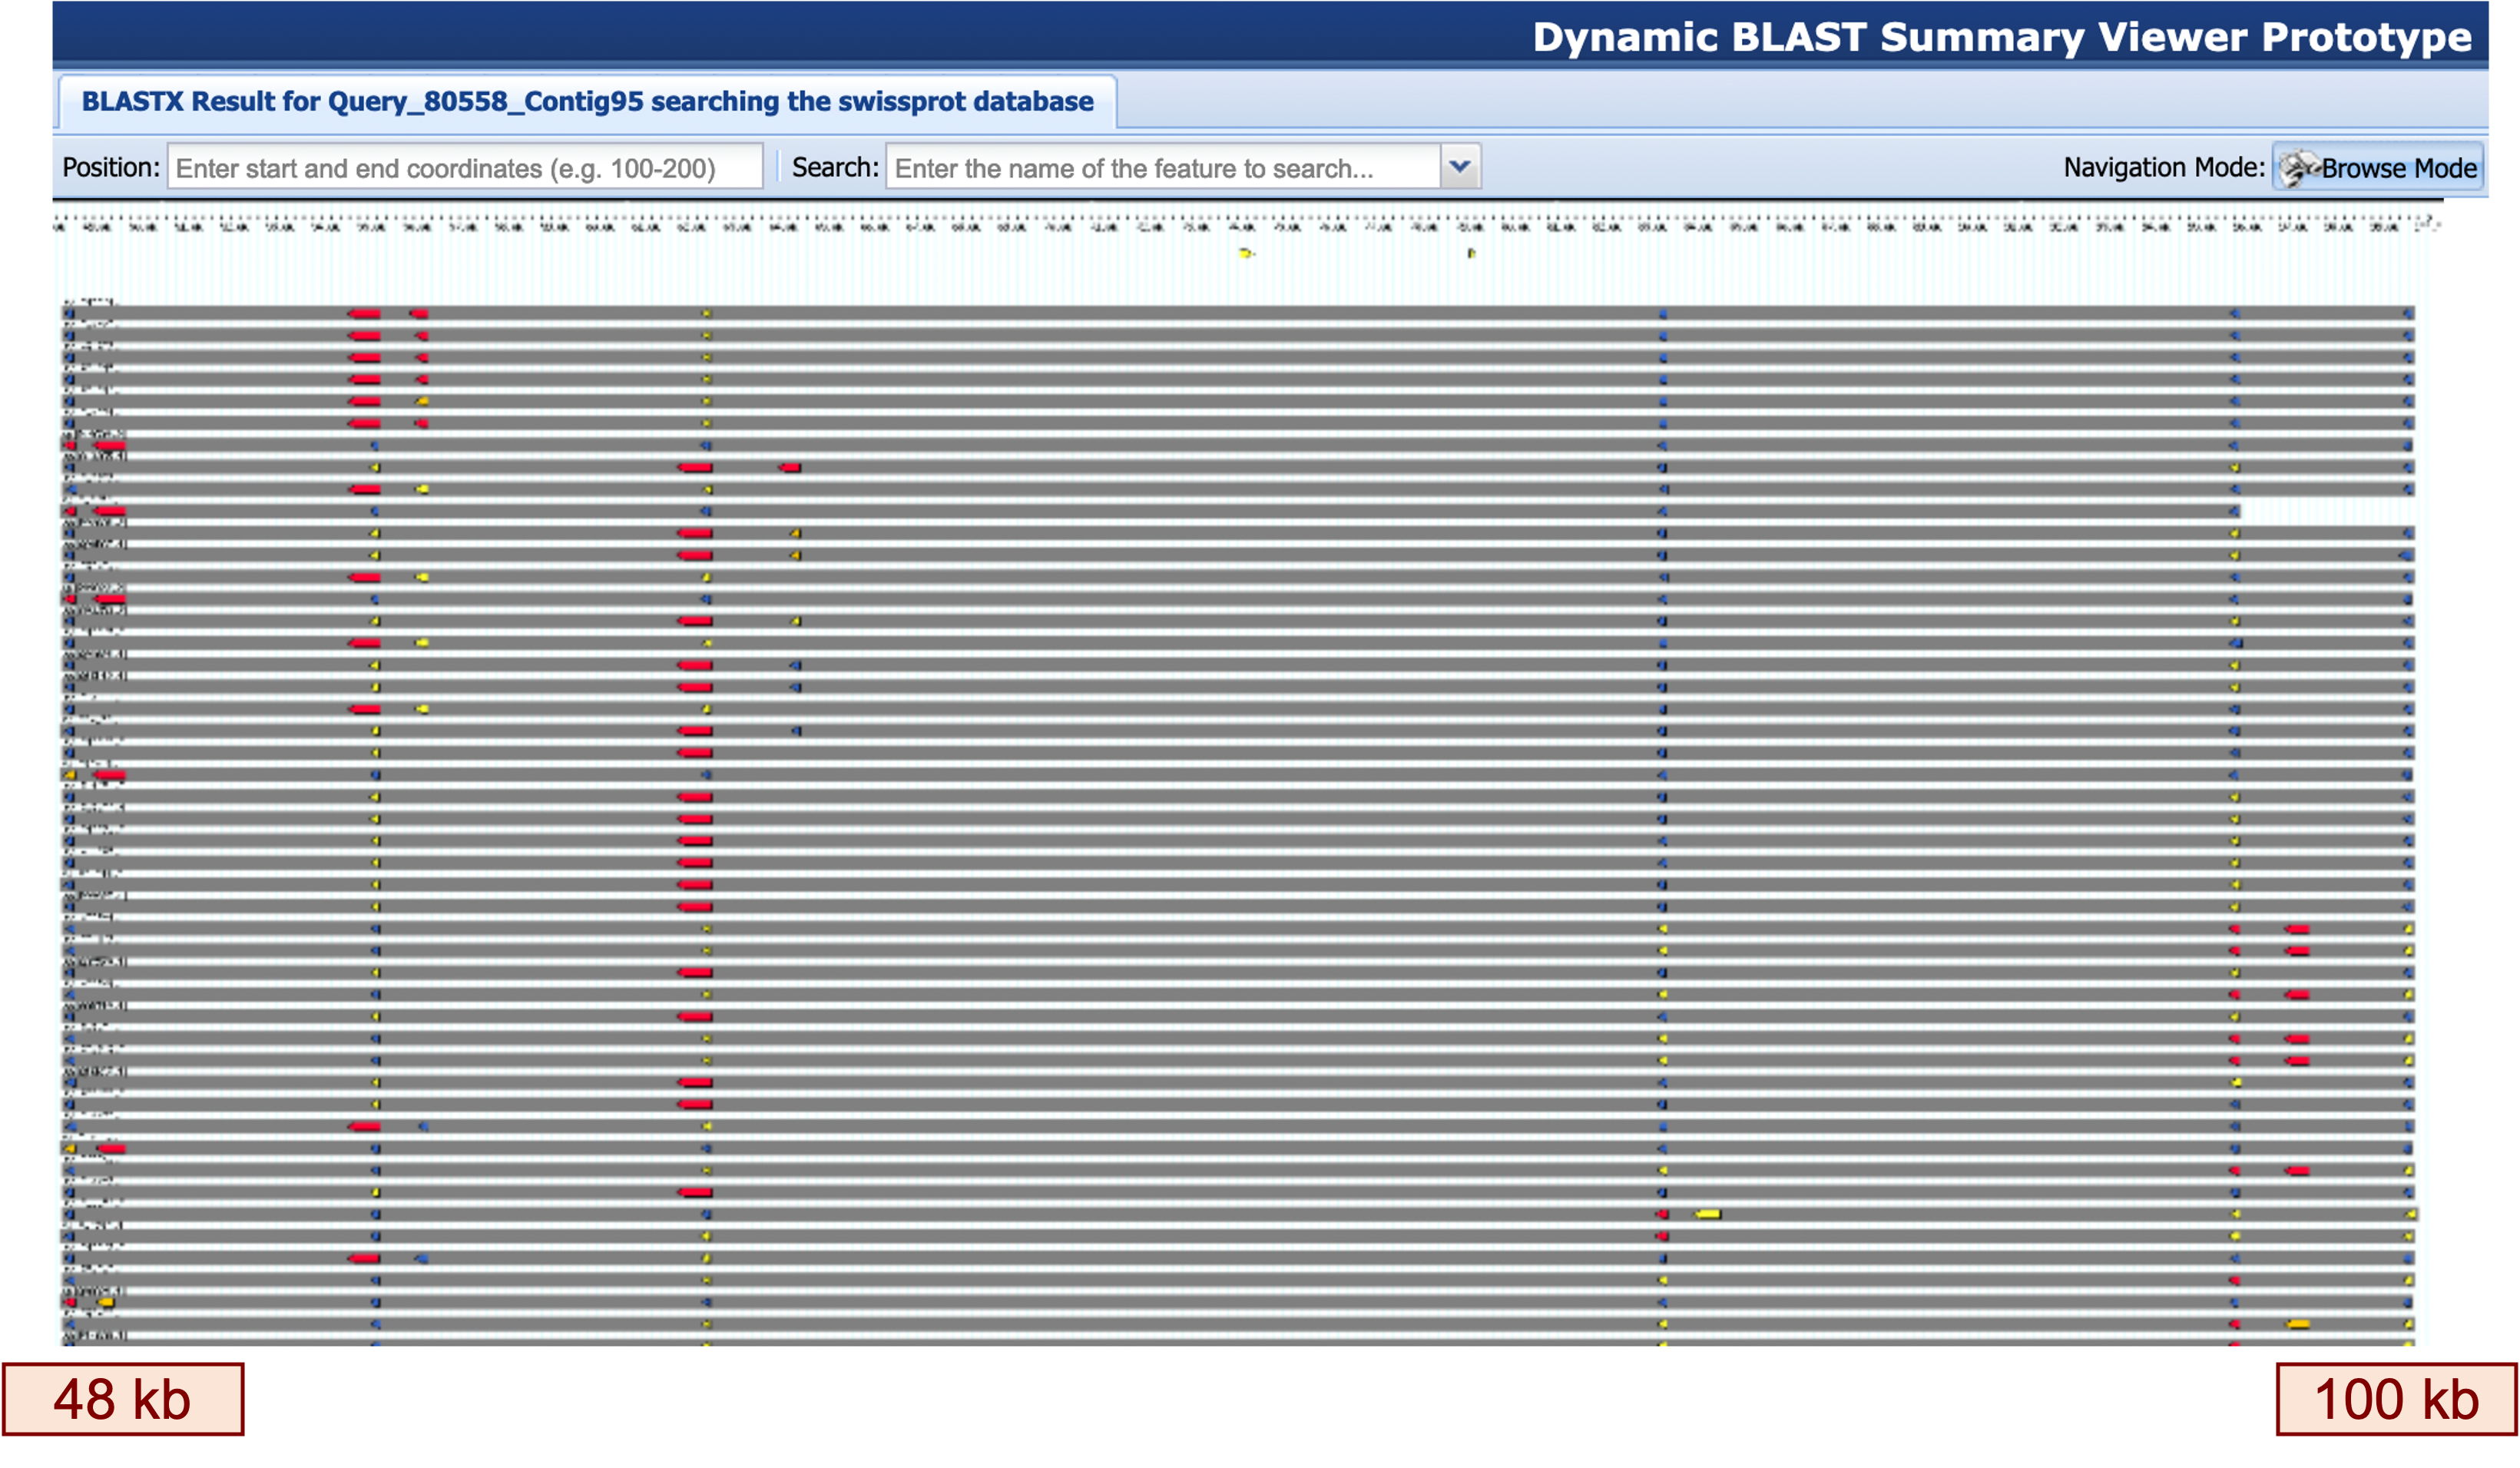
Look at your blastx output against the Swiss-Prot database in the region starting around 48 kb. This region contains a large number of matches to proteins in Swiss-Prot, with most of the matches spanning the region from 48 kb to 100 kb of our contig (Figure 12).
Based on the Swiss-Prot matches, what family of genes seems to be present in this region?
Before we look at the EST evidence in this region, we should take a moment to analyze the matches to the human protein sequences. Go back to the blastx search result against the Swiss-Prot database. Under the “Filter Results” section at the top right panel of the blastx output, enter “human (taxid:9606)” in the “Organism” field and then click on the “Filter” button to display only the matches to human proteins (Figure 13).
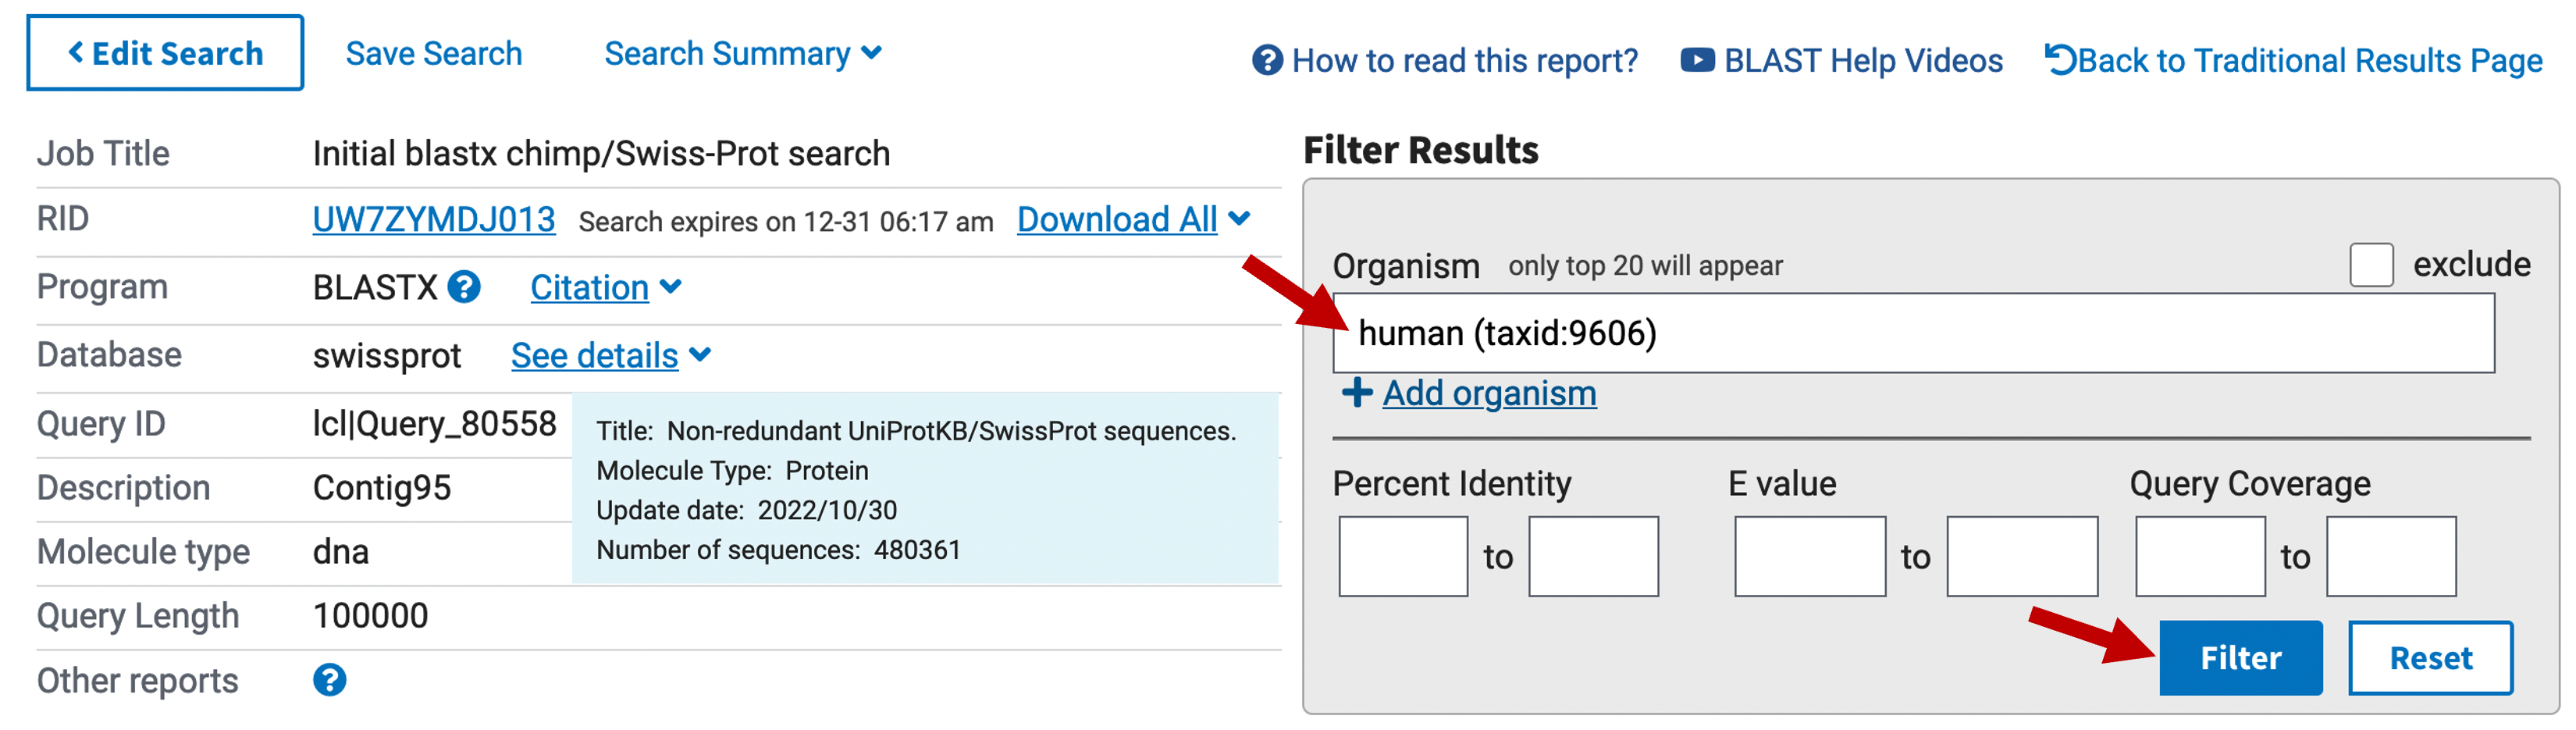
Select the “Alignments” tab to view the blastx alignments to the human proteins. Find the human subject match with the best (i.e., lowest) E-value at around 49 kb. Go back to the BLAST Output Viewer and enter this accession number into the “Search” field in the main toolbar and then press return. Examine the weaker matches to the same subject sequence located at several loci further to the right in the contig.
Which part of the protein is represented in the weak matches? Use the “Function” section of the Swiss-Prot records to form a hypothesis about what is matching the genome at these loci.
We should now examine the matches at each of these loci in the BLAST Output Viewer to find at least one protein at each locus that matches over a much longer stretch and has lower E-value than the other matches.
Based on these longer matches, how many distinct genes seem to be present between 48 kb and 100 kb? Which genes do you think are present in this region?
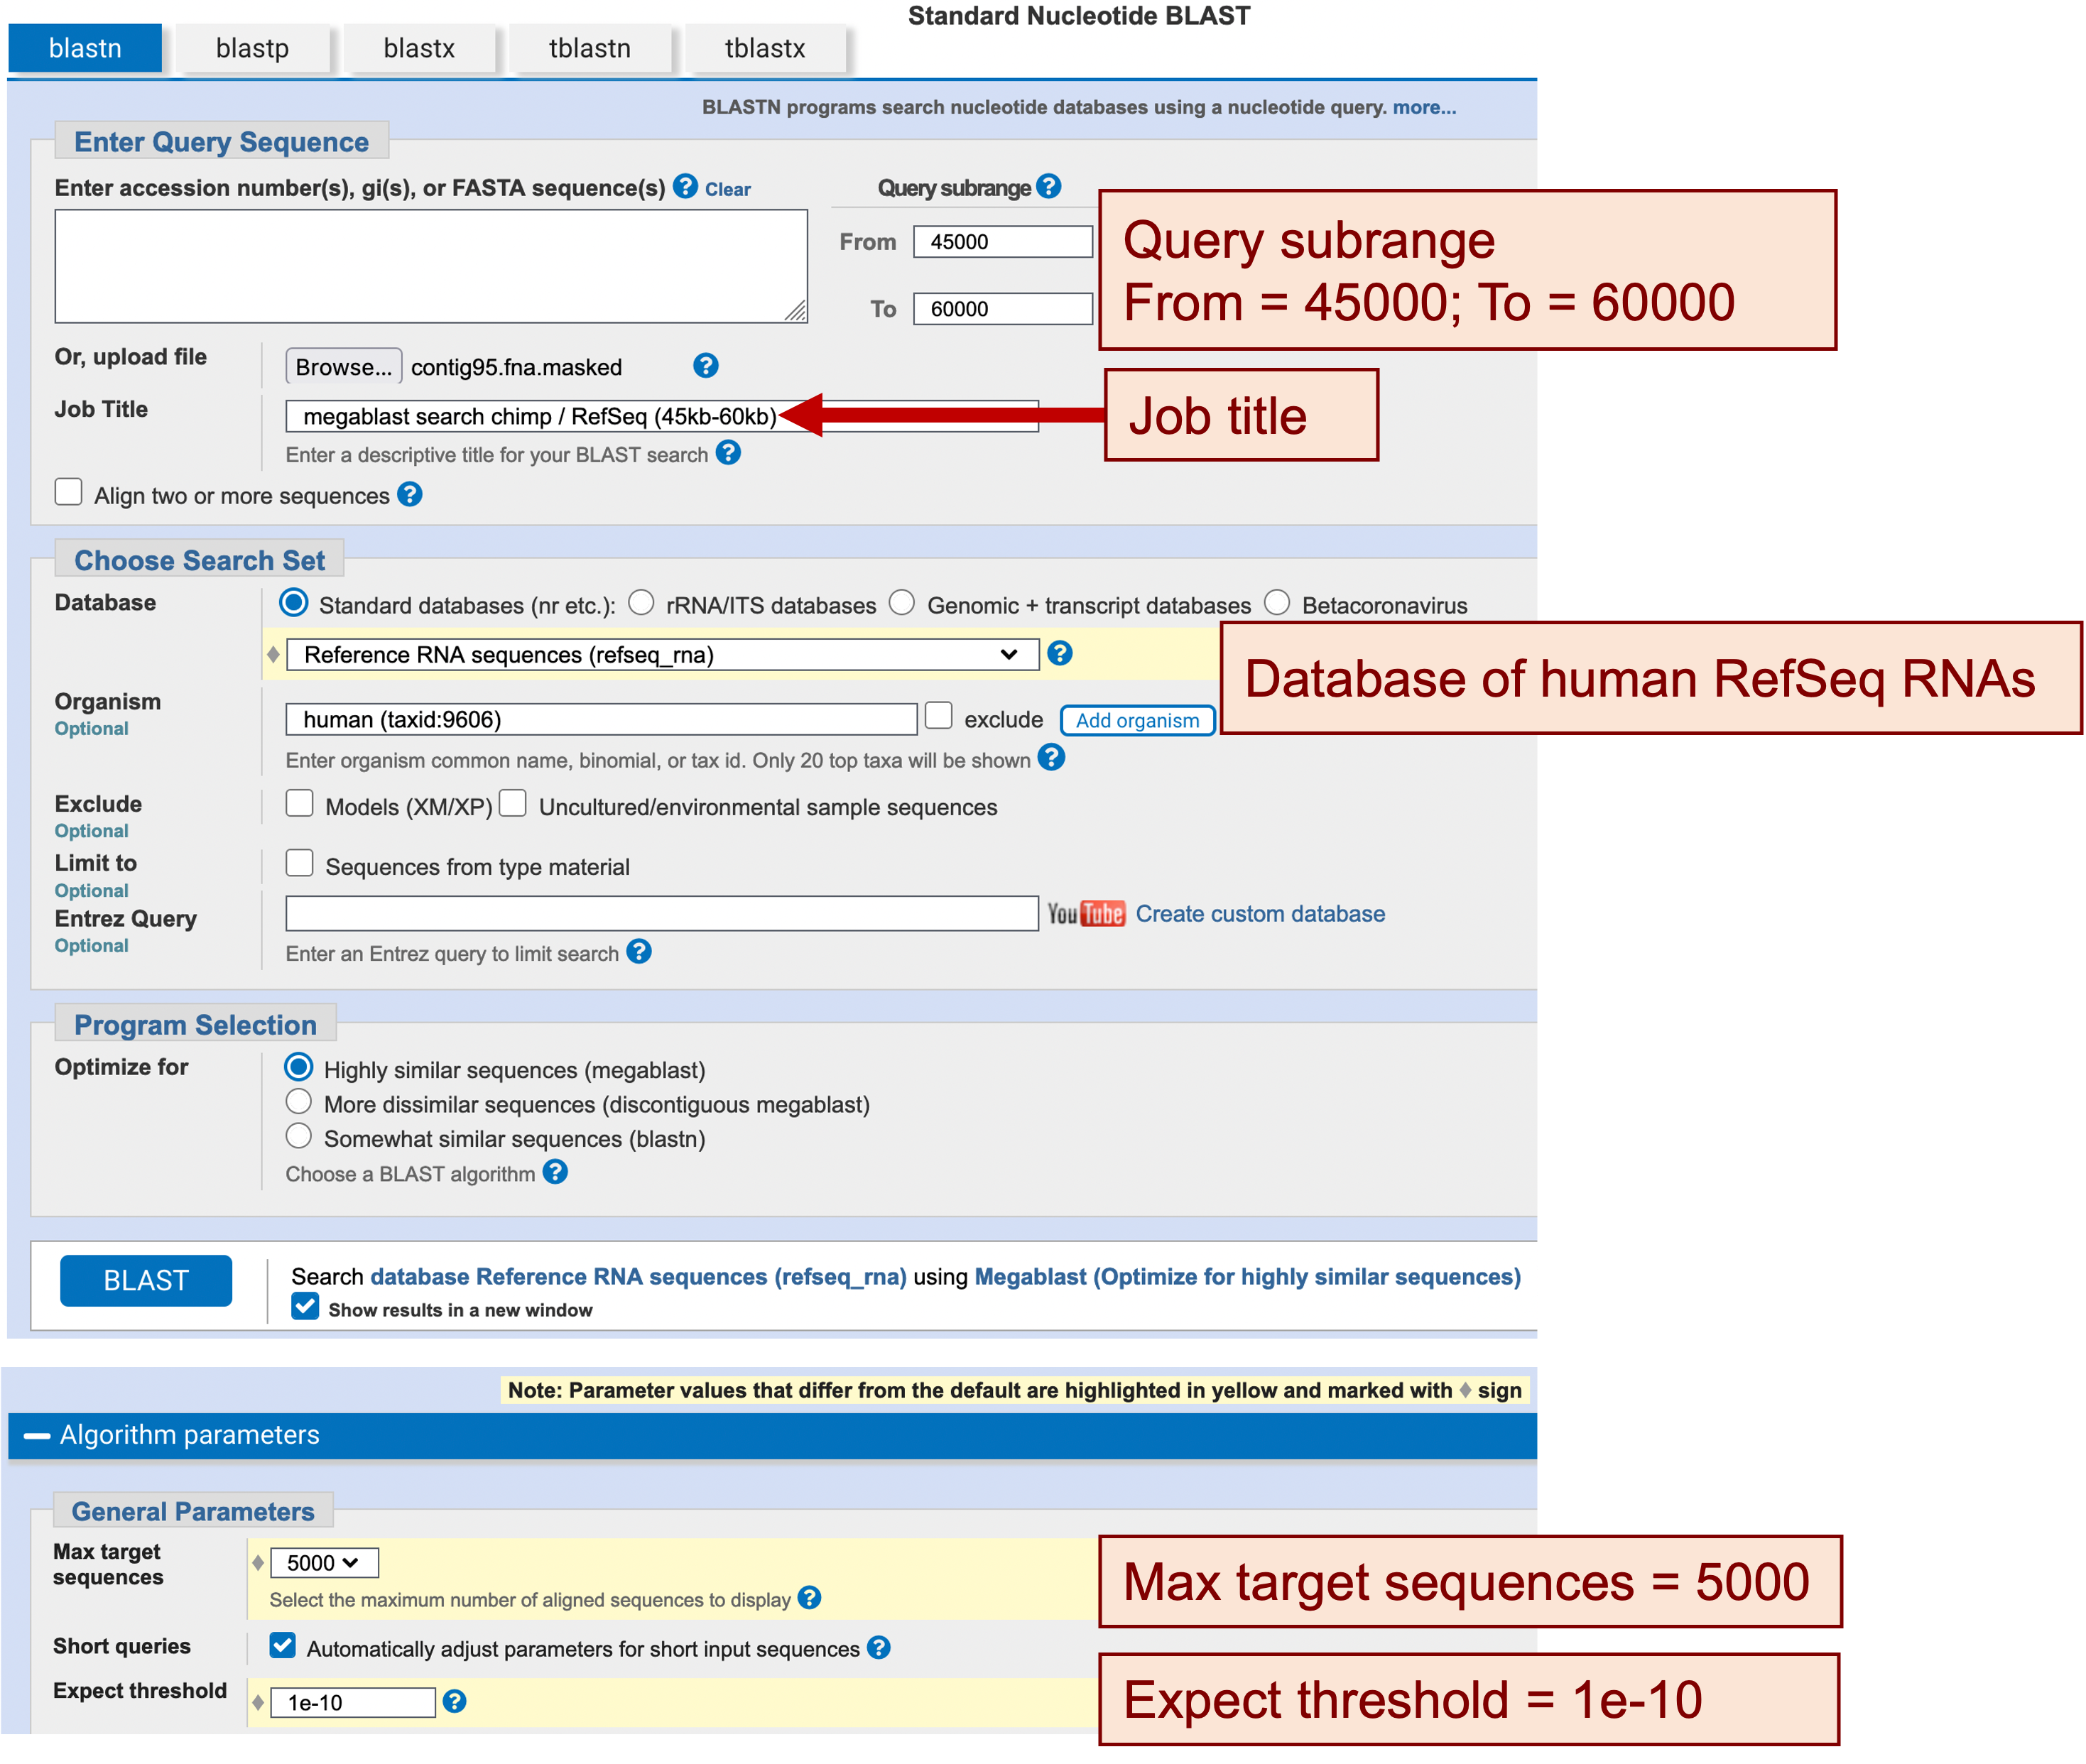
We will now focus our analysis on the region from 45 kb to 60 kb, which should contain at least two genes according to our blastx output. To ascertain the boundaries of the UTRs for these genes, we will use megablast to search this part of the contig against the RefSeq RNA database.
Similar to the search above, we will restrict our search to only matches to human mRNAs. We will also use the query subrange fields to limit the scope of our megablast search against the RefSeq RNA database to the region from 45 kb to 60 kb of our contig (Figure 14):
-
Open a new web browser window and navigate to the NCBI BLAST web server and click on the “Nucleotide BLAST” image
-
Under the “Enter Query Sequence” section, click on the “Browse” or the “Choose File” button and select our masked sequence (contig95.fna.masked)
-
In the Query subrange section, enter “45000” in the “From” field and “60000” in the “To” field
-
Enter “megablast search chimp / RefSeq (45kb-60kb)” in the “Job Title” field
-
In the “Choose Search Set” section, change the database to “Reference RNA sequences (refseq_rna)”
-
In the “Organism” field, type “human (taxid:9606)”
-
Click on “Algorithm Parameters” to expand this section
-
Change the “Max target sequences” field to “5000”
-
Change the “Expect threshold” to “1e-10”
-
-
Click on the “BLAST” button
For teaching purposes, the result of this megablast search is available in the file contig95_45-60k_refseq_bln.txt inside the blast_results directory.
The blastn output contains five matches: two of these matches correspond to the two isoforms of HOXA1, one of the match corresponds to an isoform of HOXA2, and the other two matches correspond to two long non-coding RNAs (Figure 15).
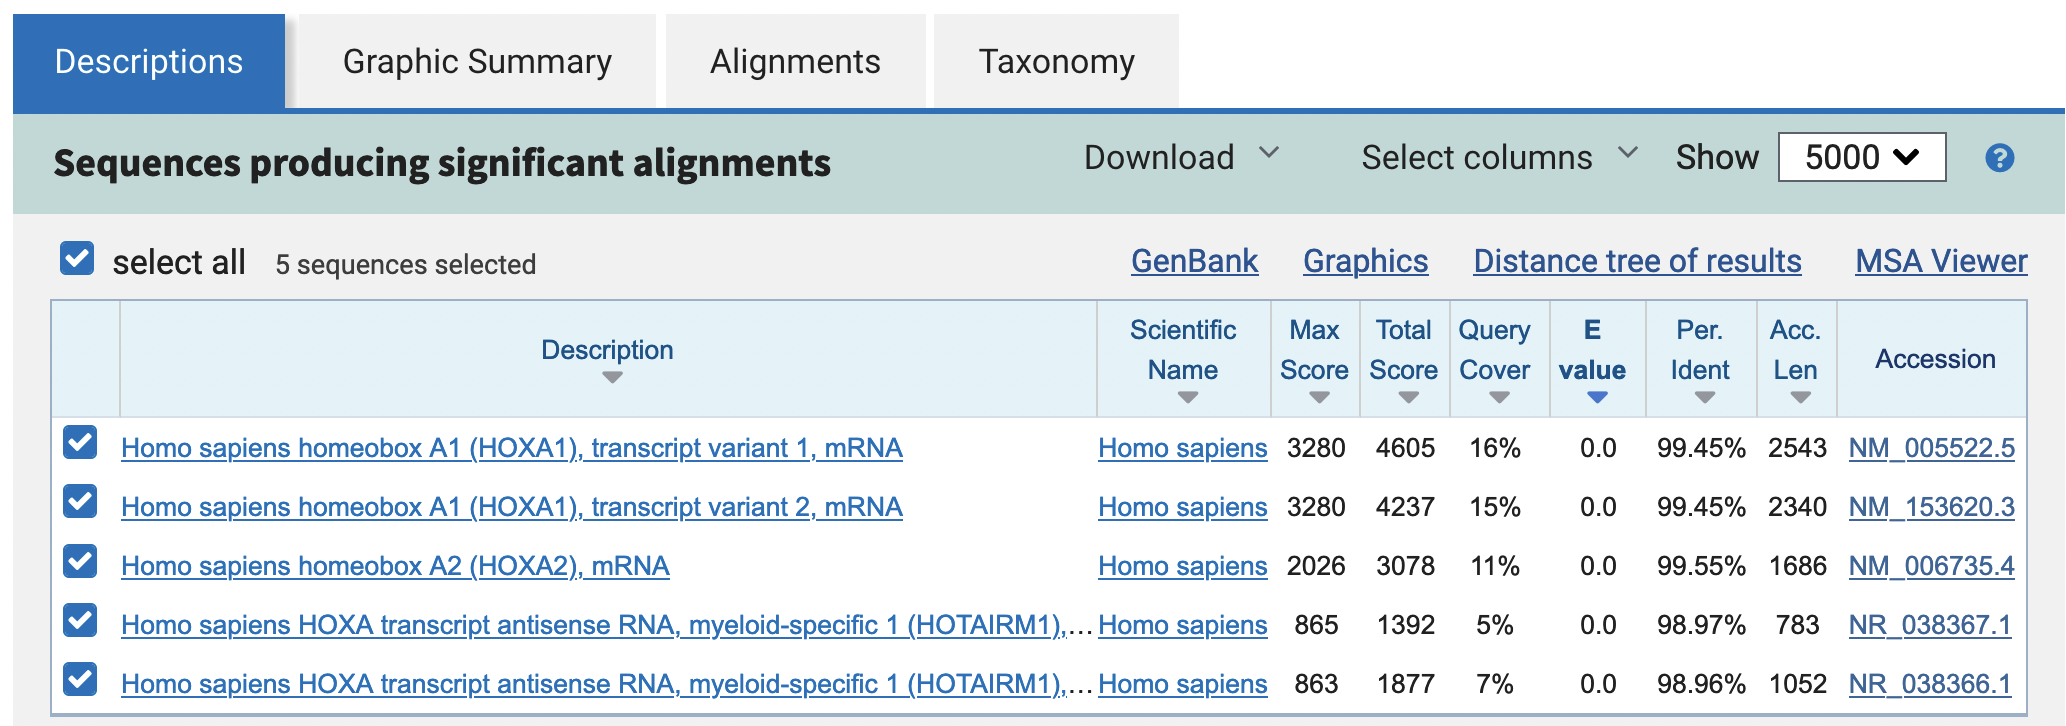
We can use the information under the “Graphic Summary” and “Alignments” tabs to determine the distance between the two human HOX genes. Note that since the RefSeq matches are on the reverse orientation (“minus” strand) relative to our contig sequence, you will need to locate the 5' end of the left feature and the 3' end of the right feature.
Where in this region do the RefSeq matches end? Do the matches extend to the ends of their respective RefSeqs?
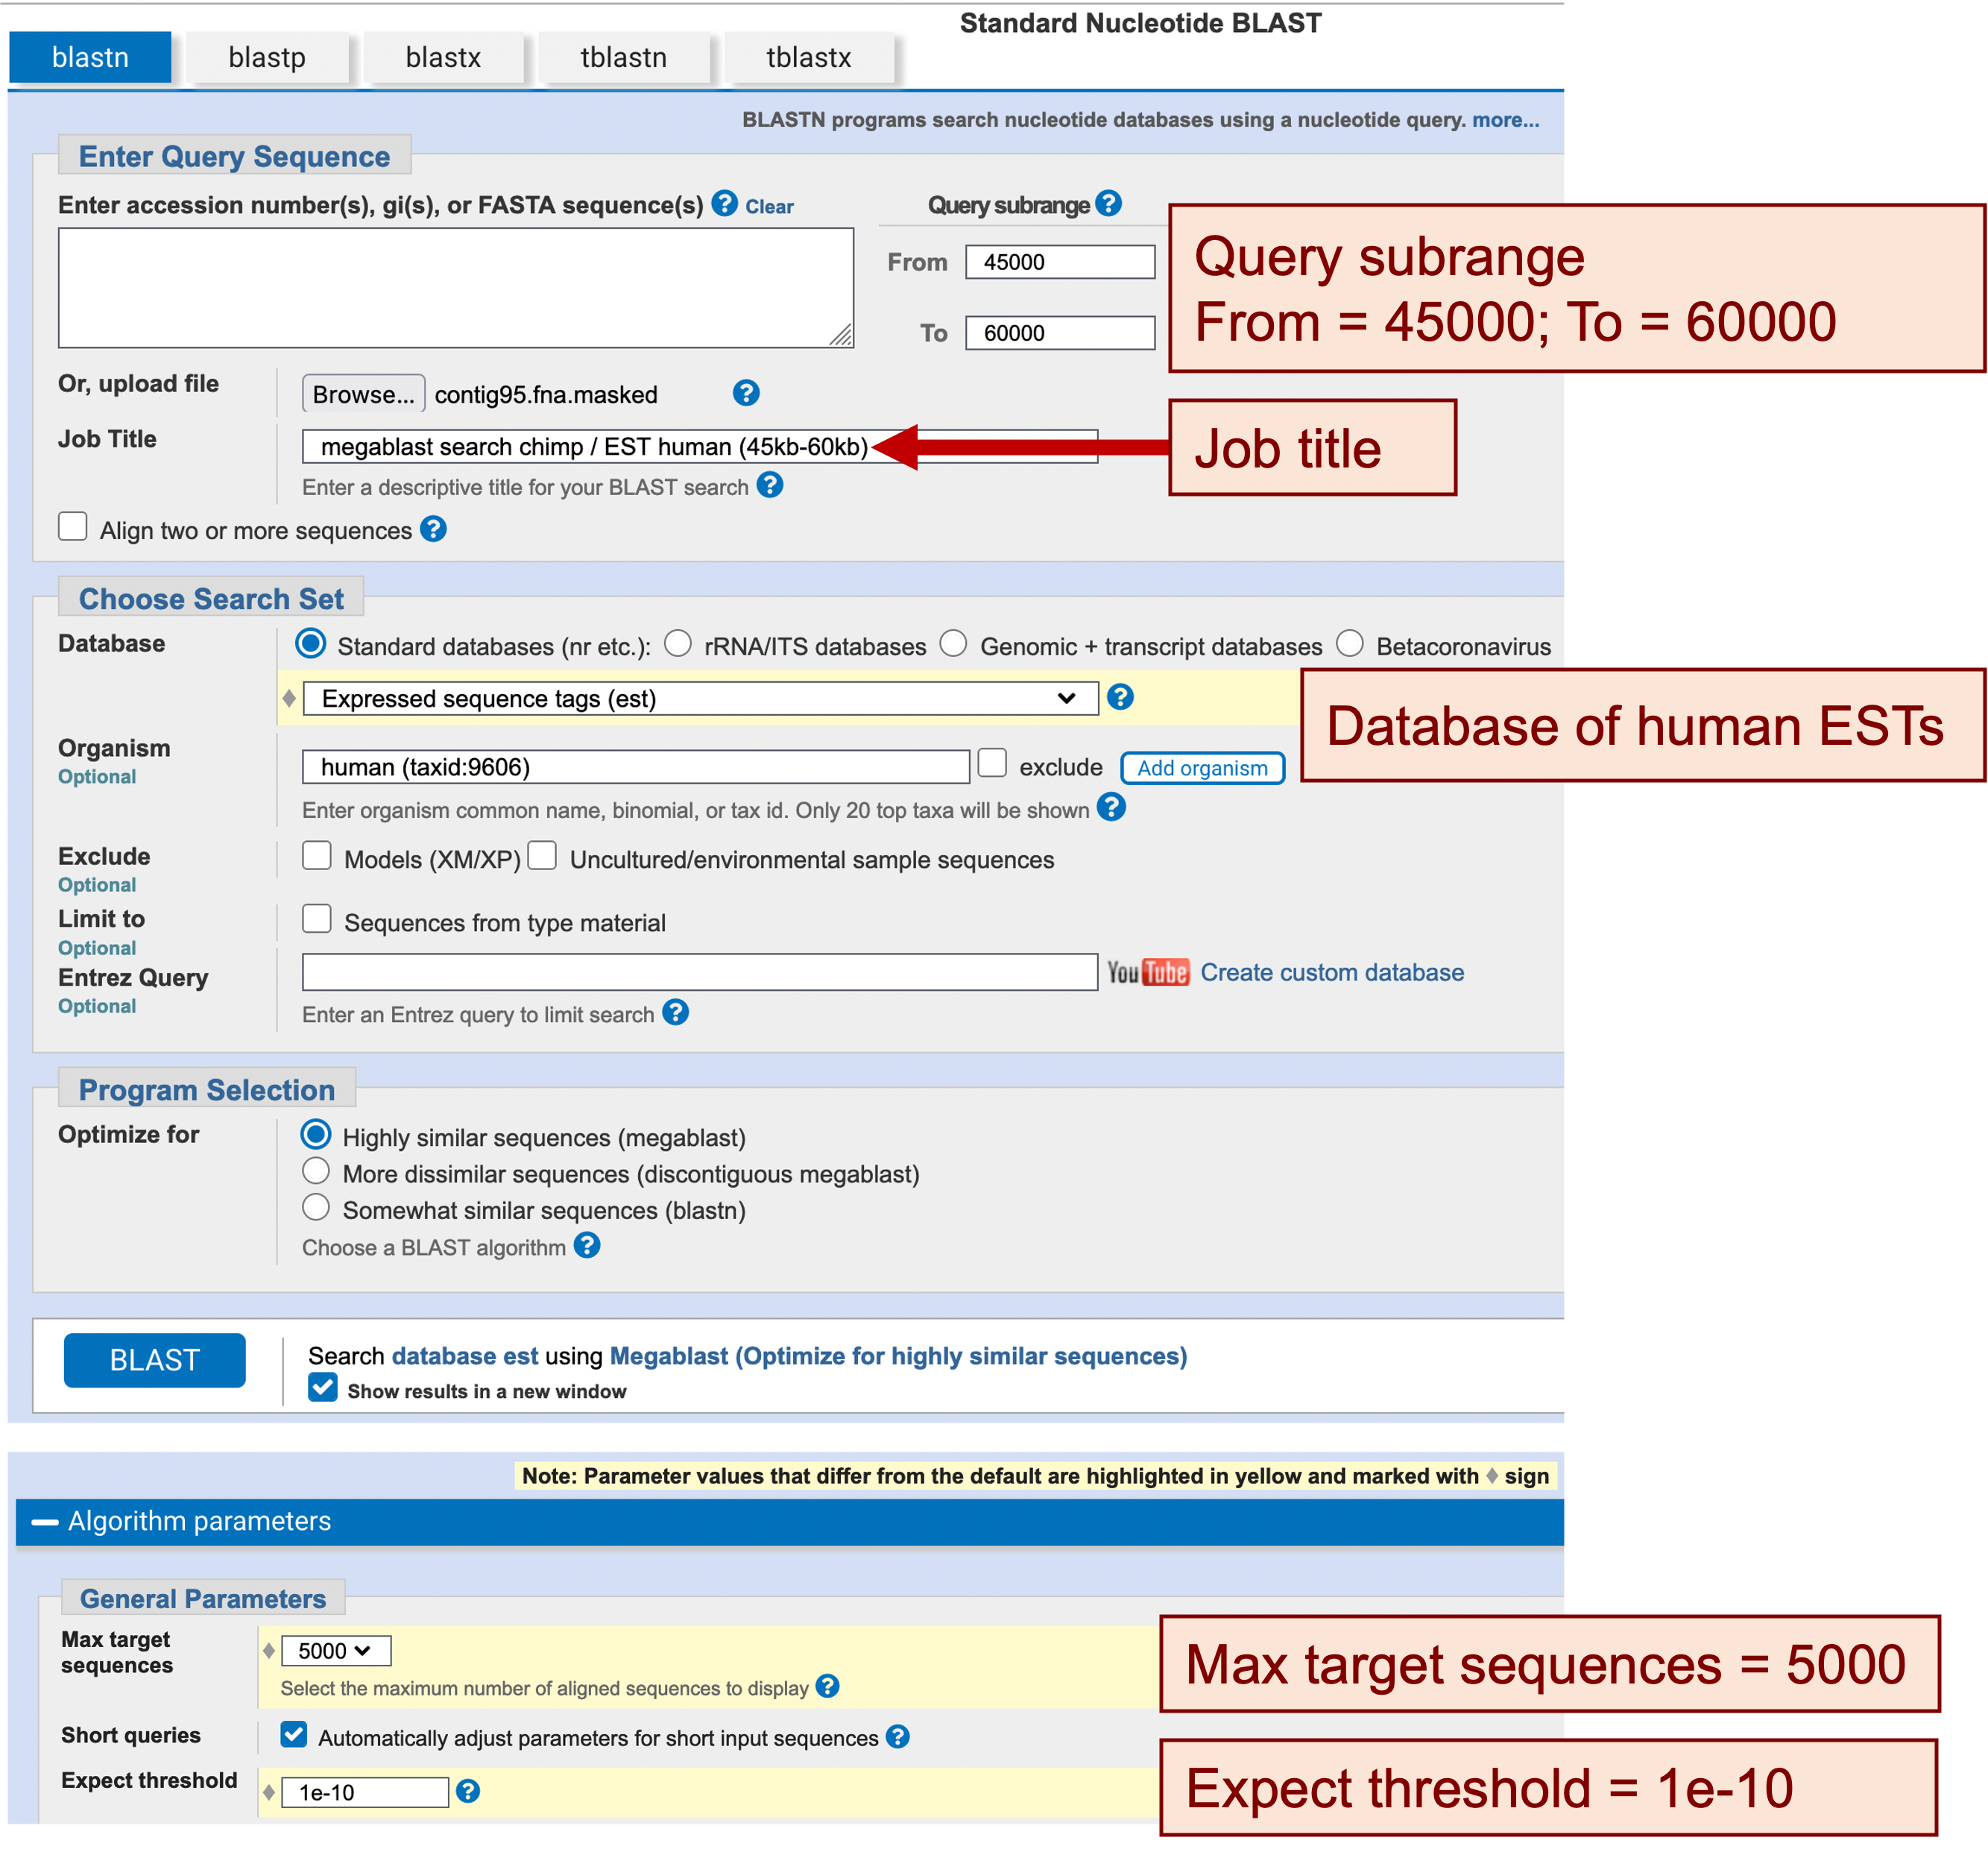
You should find that a large part of this region is outside the boundaries of either flanking RefSeq mRNAs of the HOXA1 and HOXA2 genes, even assuming that the matches for both could be extended to full length. Now we will examine the EST matches in this region by performing another megablast search against the human EST database (Figure 16):
-
Open a new web browser window, navigate to the NCBI BLAST web server and click on the “Nucleotide BLAST” image
-
Under the “Enter Query Sequence” section, click on the “Browse” or the “Choose File” button and select our masked sequence (contig95.fna.masked)
-
In the Query subrange section, enter “45000” in the “From” field and “60000” in the “To” field.
-
Enter “megablast search chimp / EST human (45kb-60kb)” in the “Job Title” field
-
In the “Choose Search Set” section, change the database to “Expressed sequence tags (est)”
-
Enter “human (taxid:9606)” in the “Organism” field
-
Under the “Program Selection” section, verify that the “Highly similar sequences (megablast)” option is selected
-
Click on “Algorithm Parameters” to expand this section
-
Change the “Max target sequences” field to “5000”
-
Change the “Expect threshold” to “1e-10”
-
-
Click on the “BLAST” button
For teaching purposes, the result of this megablast search is available in the file contig95_45-60k_esthuman_bln.txt inside the blast_results directory.
To see a graphical summary of the search result, navigate to the BLAST Output Viewer Portal for this exercise and then click on the “megablast contig95:45-60kb / human ESTs results” link under the “BLAST Output Viewers” section.
Roughly how many EST matches lie between the ends of the two flanking RefSeq matches? Do you think it’s worth investigating whether there are more features between the two flanking genes?
We should examine the blastn matches against the human RefSeq RNA database more carefully to see if any of the RNA matches fall within this region between HOXA1 and HOXA2.
What are the accession numbers for the two RNA records located between the two HOX genes? What roles do these two RNAs have in regulating the expression of HOX genes?
|
|
See the comment section of the GenBank record. |
Look at the EST matches within the contig interval spanned by the two non-coding RNAs. How similar are they to the contig? Does it seem plausible that they were actually transcribed from the orthologous interval in human?
Summary
Based on the evidence you have gathered in this exercise, how would you annotate the 45–60 kb region of the chimp contig? What uncertainties remain? Compose a short paragraph that describes your annotation of this region.